









What Is Parabolic SAR in Trading? The Dots, the Maths and the Stop
Parabolic SAR ("stop and reverse") is a trend indicator that puts one dot on each candle. The dot sits below price when the market is trending up and above price when it is trending down. When price crosses a dot, the dots flip to the other side, which signals a possible reversal. Most traders use it to read trend direction and as a trailing stop that tightens as the trend runs.
That last use affects your money directly. If the dots decide your exit, they decide where you take a profit or a loss. So you need to know how each dot is placed, why the dots speed up and where they mislead you.
How Parabolic SAR shows the trend on a chart
J. Welles Wilder Jr. introduced Parabolic SAR in his 1978 book New Concepts in Technical Trading Systems. RSI and ATR first appeared in the same book. The name tells you what the dot is for: it marks the level where you would stop out of your trade and reverse into the opposite direction.
You can read it at a glance. Dots under the candles mean the indicator is in uptrend mode, which favours a long position (buying). Dots over the candles mean downtrend mode, which favours going short (selling).
The flip is the signal. When price crosses the dots, the whole series jumps to the other side. Dots that move from above price to below give a buy signal. Dots that move from below price to above give a sell signal. The chart below shows one full cycle.
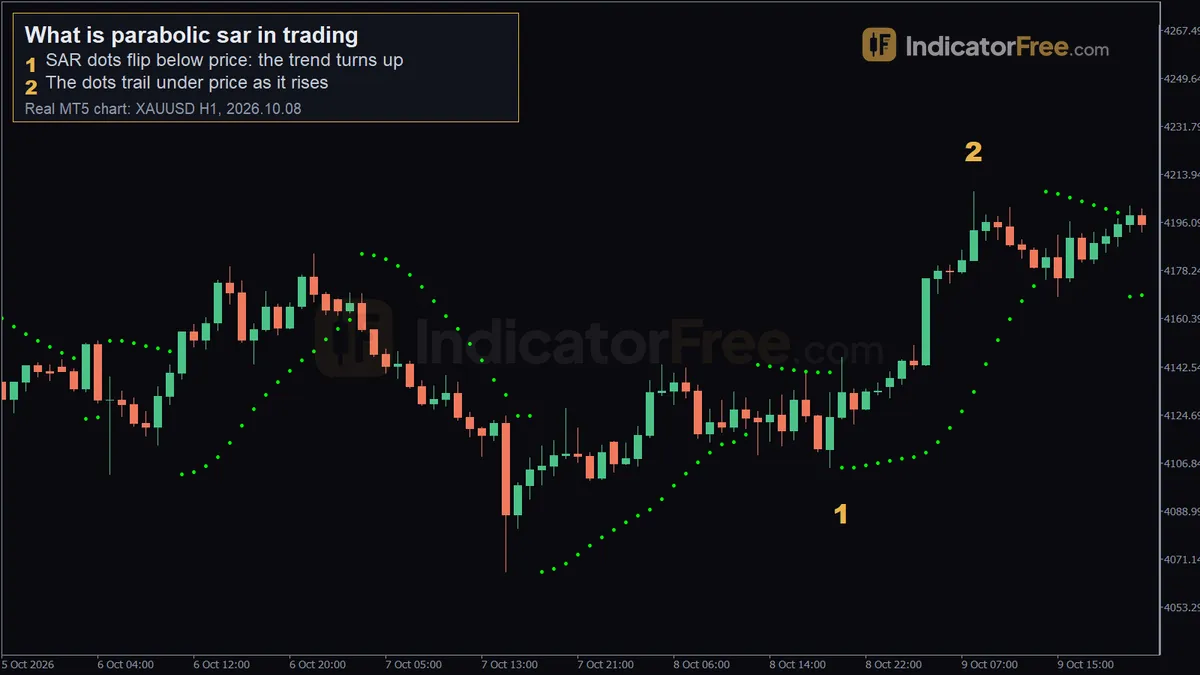 Real XAUUSD H1 chart from MetaTrader 5, a past example, not a forecast. 1 - SAR dots flip below price: the trend turns up; 2 - the dots trail under price as it rises.
The chart above is a past example from gold (XAUUSD) on the 1-hour chart, not a prediction. At marker 1, on 2026.10.08 at 20:00, the dots flipped below price around 4123.06: the first dot of the new uptrend sat at 4105.18 and that candle closed at 4132.81. At marker 2, on 2026.10.09 at 08:00, price had climbed to about 4207.55 and the dots were still trailing underneath it. Over the 20 candles after the flip, price rose 74.74.
Look at how the dots move in the uptrend. They start well below the candles and climb a little faster on each bar, curving up toward price. That curve is the "parabolic" part, and one number controls it.
Why the dots speed up: the acceleration factor
Each new dot is built from three values:
- Extreme Point (EP): the highest high of the current uptrend, or the lowest low of the current downtrend.
- Acceleration Factor (AF): the share of the gap between the dot and the EP that the dot closes on each bar.
- Prior SAR: the previous dot.
In an uptrend, new SAR = prior SAR + prior AF × (prior EP − prior SAR). In a downtrend it works the other way: new SAR = prior SAR − prior AF × (prior SAR − prior EP).
The AF starts at 0.02. Each time the trend sets a new extreme (a new high in an uptrend, a new low in a downtrend), the AF goes up by 0.02, to a maximum of 0.20. The chart below shows how it climbs during one long uptrend.
This explains why the dots are sometimes close together and sometimes far apart. Big jumps between dots mean the AF is high and price keeps making new extremes. Small steps mean the trend is still young (AF still low), or price has stopped making new highs, so the EP is not moving.
Also watch the gap between the dot and the candles. If the gap keeps widening, price is running away from your stop. If the gap shrinks while price moves sideways, the dot is still climbing every bar but price is not, so a flip is getting close. Treat that as an early warning, not a sell signal.
A common misread is "a big gap means a strong trend, so it is safe to add more". A big gap also means your stop is far away. If the move snaps back, you lose more.
Worked example: calculate the next dot by hand
The numbers in this section are an illustrative example on a pair priced around 1.1000. Suppose the market is in an uptrend. On bar 1 the dot is at 1.1000, the highest high so far (the EP) is 1.1100 and the AF is 0.02.
During bar 2, price makes a new high at 1.1152. That changes two things: the EP becomes 1.1152 and the AF rises to 0.04. The calculation below finds the next two dots.
The dot rose 2 pips on the first bar and 6 pips on the next, because the AF doubled and the gap grew.
Wilder added one safety rule. In an uptrend, the dot can never be placed above the lower of the last two lows. In a downtrend, it can never be placed below the higher of the last two highs. If the formula would put it there, the dot goes to that low (or high) instead. Staying with the same example, suppose the last two lows were 1.1030 and 1.1015. The lower of the two is 1.1015, and the formula's 1.1008 is already below it, so the rule does not change the dot this time. If the lows had been 1.1030 and 1.1005 instead, 1.1008 would sit above 1.1005, so the dot would be placed at 1.1005.
Using the dots as a trailing stop
Most traders use the dots as a trailing stop. You hold the trade while price stays on the right side of the dot. You exit, or reverse, once price closes on the other side. The dot only moves in the direction of the trend, so the stop only ever tightens.
Three details decide whether this works for you:
- Move your stop every bar. The dot changes with each new candle. A stop you set once at the first dot is not a Parabolic SAR stop. Update your stop order on every new bar, or use a trailing tool that follows the indicator.
- Decide between touch and close. The indicator flips as soon as price crosses the dot during a bar. Many traders wait for a candle to close beyond the dot before they act, so a short spike does not shake them out. Choose one rule and stick to it.
- Allow for the spread on short trades. Charts usually draw the Bid price, but you exit a short at the Ask price, so your stop can fill before the candle reaches the dot. Put the stop a little beyond the dot.
Base your position size on the distance to the dot, not on habit. Staying with the same example, say you buy at 1.1150, right after the buy flip while the trend is still young, and the bar 3 dot is at 1.1008. Your stop distance is 1.1150 − 1.1008 = 0.0142, which is 142 pips. Say you are willing to lose $100, and one pip on a standard lot of a pair quoted in US dollars is worth $10. Then your size is $100 ÷ (142 × $10) ≈ 0.07 lots, which is seven micro lots (a micro lot is 0.01 of a standard lot).
Early in a trend the dot sits far from price, so the right position size is small. As the dot catches up, the amount you can lose on the open trade gets smaller.
Where Parabolic SAR fails: sideways markets
Parabolic SAR always points either up or down. It has no "no trend" setting. In a sideways range it keeps flipping, and if you trade each flip, each one tends to end in a small loss. The chart below shows a choppy range where the dots kept switching sides.
Each flip came near the edge of the same band, so a trader taking every flip bought near the top and sold near the bottom.
Before you act on any flip, run through these rules:
- If price has been making higher highs and higher lows, take only buy flips. Treat sell flips as exits, not as new short trades.
- If price has been making lower lows and lower highs, take only sell flips, and treat buy flips as exits.
- If the last few flips alternated inside the same price band, treat the market as ranging and stay out until price breaks out of that band.
- If you use a long moving average as a trend filter, take buy flips only above it and sell flips only below it.
Which timeframe and settings to use
Parabolic SAR works the same way on any timeframe, because it counts bars, not hours. What changes is the amount of noise. There is no single best timeframe: 15-minute works, but expect more noise flips than on 1-hour or 4-hour. The table compares the trade-offs.
| Chart | How often it flips | Distance from price to dot | Suits |
|---|---|---|---|
| 1-minute to 15-minute | Very often, many flips caused by noise | Small, but the spread is a large share of it | Traders who watch the screen all session |
| 1-hour | Less often | Medium | Trades held for a few hours |
| 4-hour | Less often again | Medium to wide | Trades held for a day to several days |
| Daily | Rarely | Wide, so position sizes must be small | Trades held for days to weeks |
In practice, use the timeframe on which you plan to hold the trade. Then count how many flips happened during the last sideways stretch on that chart. If there were a lot, move up one timeframe.
The standard settings are Wilder's own: the acceleration factor starts at 0.02, goes up by 0.02 with each new extreme and stops at a maximum of 0.20. Some charts show only two inputs, a step of 0.02 and a maximum of 0.20, because the start and the step use the same value.
Changing the settings shifts the trade-off. If you raise the increment or the maximum above the defaults, the dots move toward price faster. You get tighter stops and more flips, and more of those flips come from noise. If you lower them, the dots move more slowly and give price more room. You get fewer flips, but you lose more when a flip does come, and you exit later after a real reversal.
Mistakes that cost beginners money
- Reversing on every flip. Wilder's original system is always in the market: each exit is also a new trade the other way. In a range, every exit also opens a new losing trade, so the losses pile up on both sides. Fix: treat the exit and the new trade as two separate decisions, and only open the new trade if the filter rules above allow it.
- Tuning the settings until old charts look perfect. Settings that fit one past stretch almost never fit the next one. Fix: start with the defaults and only change one setting after you have checked it over several different market periods.
- Assuming the stop fills exactly at the dot. Over a weekend or a major news release, price can jump straight past the dot. Your stop then fills at the next available price, which can be worse than the dot. Fix: when you size the trade, plan for losing more than the distance to the dot, and avoid holding full size through scheduled news.
- Entering long after the flip. If you buy many bars after a buy flip, the trend has already run, the AF may be at its cap and the dot is tight under price. A normal pullback can stop you out at a loss. Fix: if you missed the flip, wait for the next clear setup instead of chasing.
FAQ
Why does the dot jump so far away right after a flip?
When the trend reverses, the first dot of the new trend goes at the extreme point of the old one. After an uptrend ends, for example, the first dot sits at the highest high of that uptrend. You can see this in the first chart in this lesson: the first red dot after the flip sits level with the old highest high, far above price. The AF also resets to 0.02, so the new dots start slowly and only speed up as the new trend makes fresh extremes.
Does Parabolic SAR work on gold, indices and crypto?
Yes. It only needs each bar's high and low, so it calculates the same way on any chart. The same limit applies everywhere: it works when the market trends and keeps flipping when the market goes sideways.
Should I add MACD to confirm Parabolic SAR signals?
You can, but MACD is also a trend and momentum tool built from price averages. It often agrees with the dots for the same reason the dots moved, so it adds less independent confirmation than it seems to. A filter that measures something different, such as the overall swing structure of highs and lows, usually tells you more, and a long moving average filter, like the rule above, sets the trend direction before you act on any flip.
How to Start Forex Trading in Ethiopia: A Step-by-Step Beginner GuideNext lesson →
How to Learn Forex Basics: What to Learn First, With the Maths Shown
Part of Forex basics: more guides, terms and free tools on this subject.