Average True Range
Also called ATR
Average True Range (ATR) is an MT5 indicator that measures how much price moves per candle, in pips on forex or in price on gold and stocks, by averaging the true range over a set number of candles.
Average True Range (ATR) is a volatility indicator built into MT5. It averages the true range of the last N candles to show how big price swings currently are, in pips on forex pairs or in price on gold and stocks. Traders use it to size stops, set take-profits, and judge whether a market is quiet or active — it says nothing about direction.
The ATR formula and what the line shows
True Range for one candle is the largest of three distances:
True Range = max(High - Low, |High - Previous Close|, |Low - Previous Close|)
ATR = Wilder-smoothed average of True Range over N candles
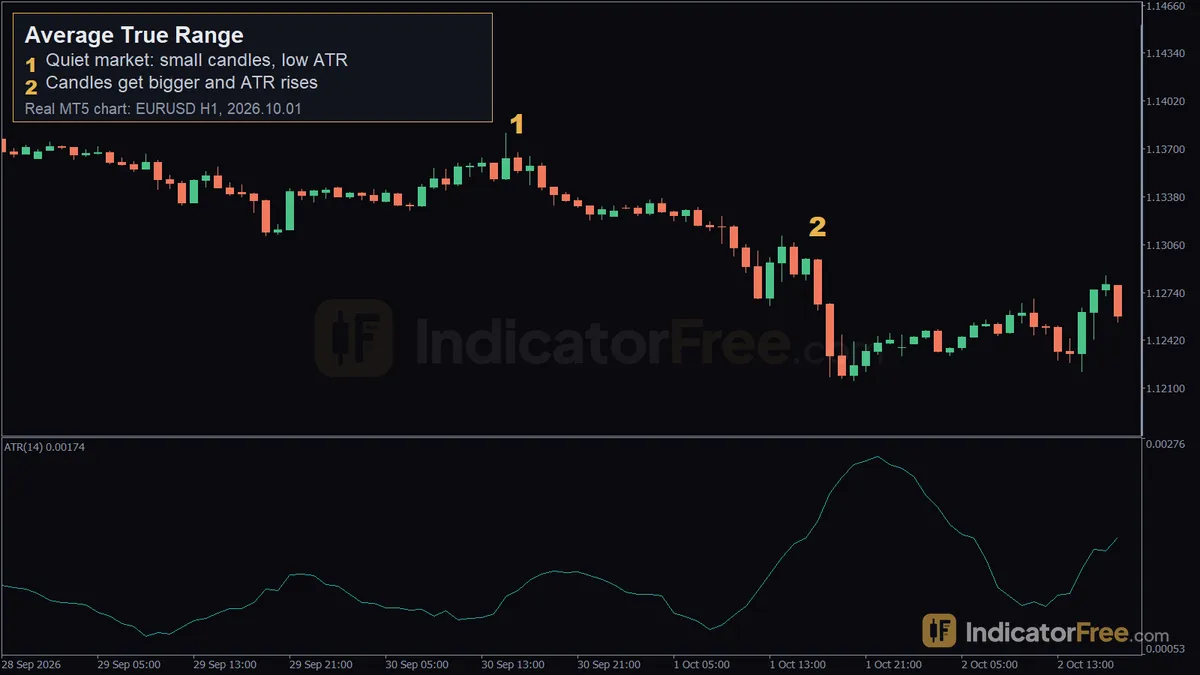
MT5 loads ATR with a period of 14 by default, on any symbol or timeframe. The line plotted below the chart is just that average. A rising line means candles are getting bigger; a falling line means they're getting smaller — that's all it tells you.
Reading the ATR line on your chart
On EURUSD H1, the 14-period ATR averaged 11 pips while the market stayed quiet, through 2026.09.30 16:00 (price 1.13677) — small candles, a flat ATR line. By 2026.10.01 17:00 (price 1.12961), candles had widened and ATR had risen to 17 pips, about 1.6 times higher. That's a past example, not a forecast: ATR confirms that volatility changed, it doesn't predict the change before it happens.
When ATR works well, and when to leave it alone
Works well when:
- Volatility is clearly shifting, for example around a session open like London or New York
- You want a stop-loss distance that adapts to current conditions instead of a fixed pip value
- You're comparing the current move to the market's own recent history
Avoid or treat with caution when:
- The market has been flat for a long stretch — ATR stays flat too and says little about what comes next
- You're on M1, where a single spike candle can distort the average for several bars
- You're right around high-impact news, when True Range can spike several times its normal size and temporarily skew ATR-based stops
ATR pros and cons
| Pros | Cons |
|---|---|
| Adapts stop-loss and target distance to current volatility | Gives no direction — needs a trend or breakout signal alongside it |
| Works the same way on forex, gold, and other symbols | Reacts after candles grow, not before |
| Simple to read: one line, higher means bigger candles | Not directly comparable across symbols — pips versus price units |
Practical ATR setups
//Setting a stop loss at 1.5 x ATR
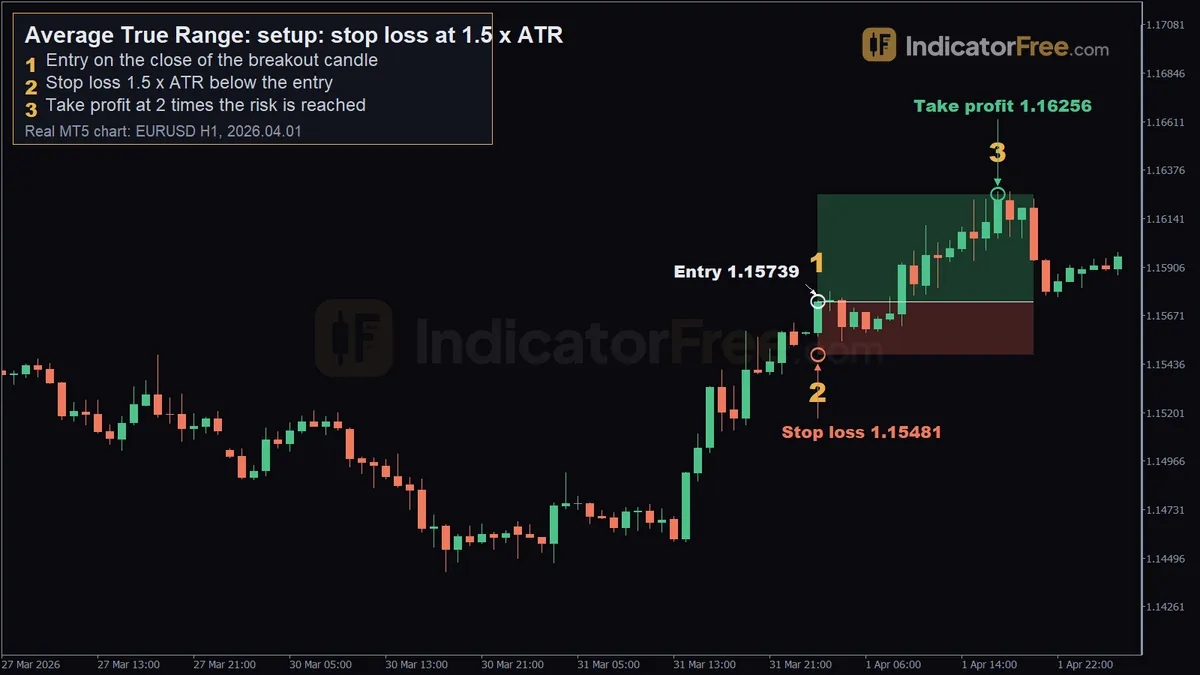
Average True Range, setup: stop loss at 1.5 x ATR: real EURUSD H1 MT5 chart (2026-04-01).
EURUSD H1, ATR(14) at 17 pips. Entry: the breakout candle closes at 1.15739 (2026.04.01 02:00). Stop loss: 1.5 x ATR below entry, at 1.15481 (26 pips risk). Take profit: 2 x the risk, at 1.16256, reached on 2026.04.01 17:00 (52 pips). One past example, not a rule that this ratio always works.
//Trailing a stop with ATR
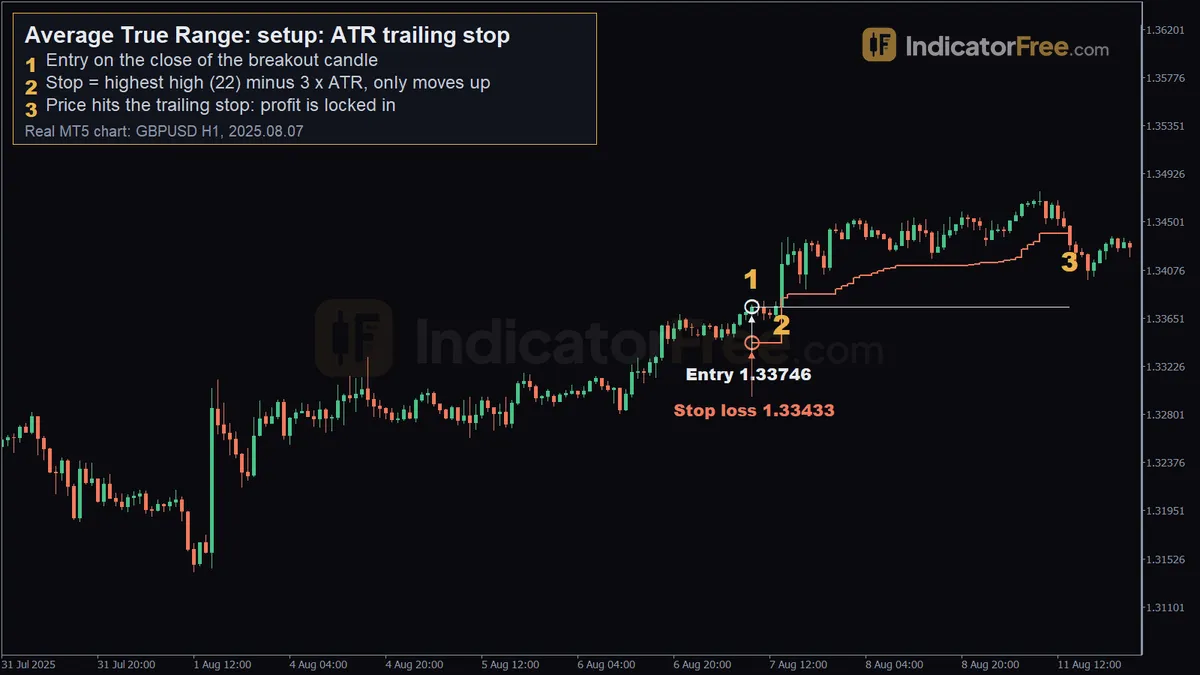
Average True Range, setup: ATR trailing stop: real GBPUSD H1 MT5 chart (2025-08-07).
GBPUSD H1. Entry: the breakout candle closes at 1.33746 (2025.08.07 09:00), first stop at 1.33433. From there the stop trails the highest high of the last 22 candles minus 3 x ATR, moving up only, never back down. The trade closes on 2025.08.11 14:00 at 1.34400 when price hits the trailing stop, locking in 65 pips.
//Breakout with ATR rising as a filter
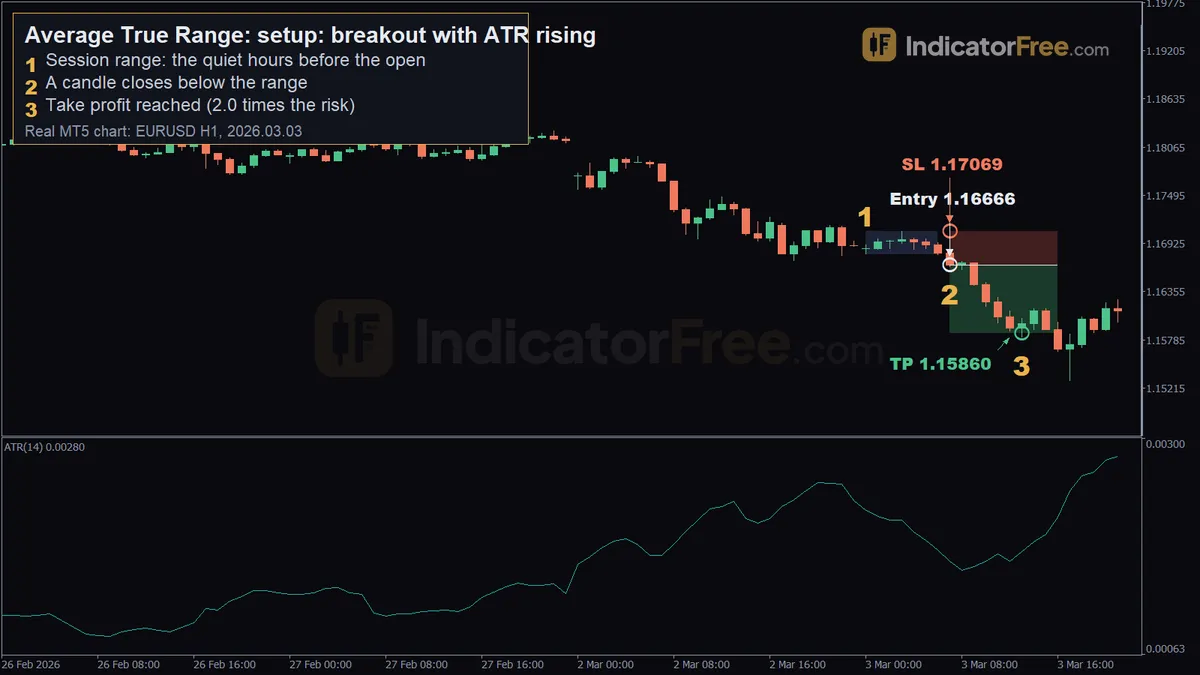
Average True Range, setup: breakout with ATR rising: real EURUSD H1 MT5 chart (2026-03-03).
EURUSD H1 held a 28-pip range between 1.16792 and 1.17069 from 2026.03.03 00:00 to 06:00, with ATR(14) at 20 pips at the start of that window. Entry: the 07:00 candle closes below the range, at 1.16666. Stop loss: 1.17069 (40 pips risk). Take profit: 1.15860, 2.0 x the risk, reached on 2026.03.03 13:00. The rising ATR here is used as a filter confirming there was enough movement to trade, not as the entry trigger itself.
Choosing the ATR period for your trading style
| Trading style | Typical timeframe | ATR period to start with |
|---|---|---|
| Scalping | M5 / M15 | 7 |
| Day trading | H1 | 14 (MT5 default) |
| Swing | H4 / D1 | 14-28 |
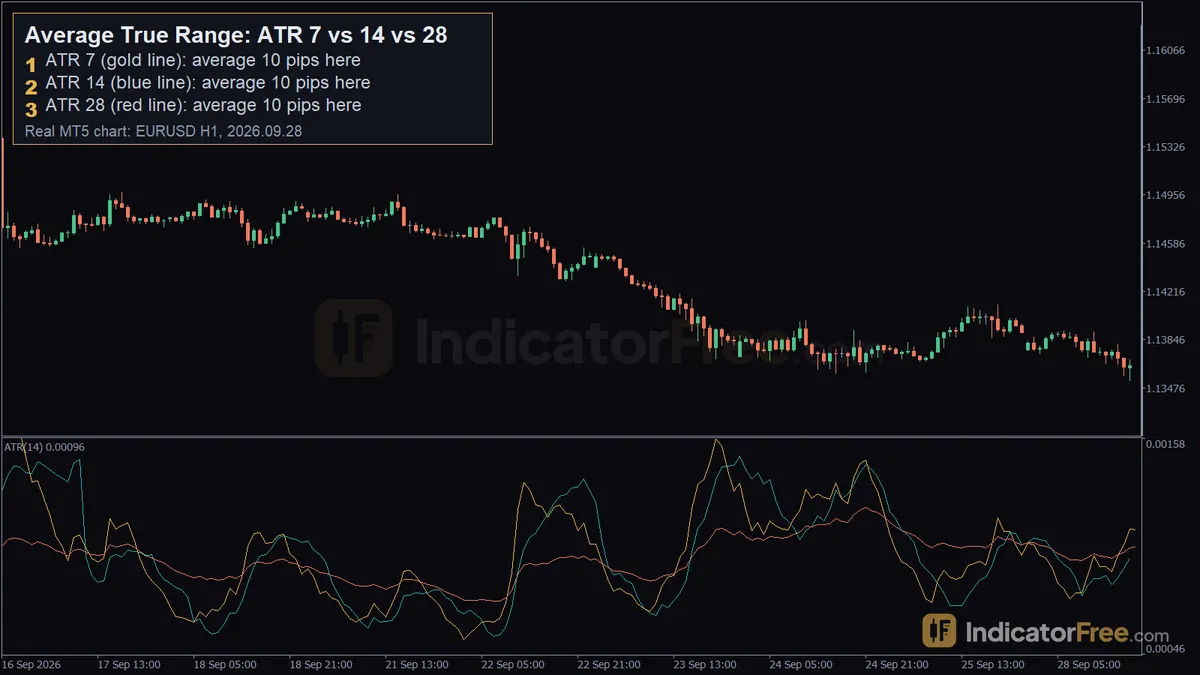
Average True Range, ATR 7 vs 14 vs 28: real EURUSD H1 MT5 chart (2026-09-28).
On EURUSD H1 over 190 candles (2026.09.16 19:00 to 2026.09.28 17:00), ATR 7, ATR 14 and ATR 28 all averaged around 10 pips at the same point, 2026.09.28 09:00 — in that window the period made less difference than expected. A shorter period still reacts faster to new candles; a longer one stays smoother and lags more.
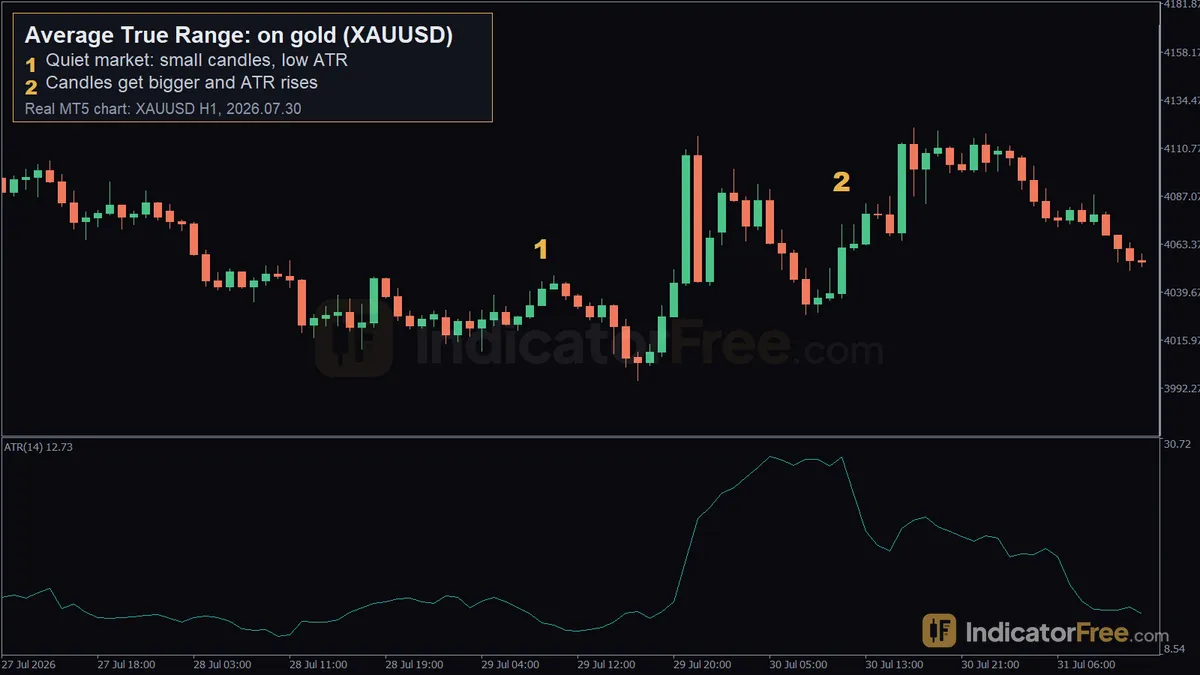
Average True Range, on gold (XAUUSD): real XAUUSD H1 MT5 chart (2026-07-30).
Gold reads ATR in price, not pips. XAUUSD H1's 14-period ATR averaged $13.50 before 2026.07.30 11:00, then rose to $21.99 (about 1.6 times higher) as candles widened into 2026.07.30 11:00 ($4072.95, versus $4044.83 on 2026.07.29 09:00 in the quiet period). A reading of "20" on XAUUSD isn't the same size move as "20" on EURUSD — the units differ.
What the IndicatorFree Lab measured
The Lab ran ATR(14) over 12 months of past broker demo data in MT5. Past data, not a forecast:
- EURUSD H1: averaged 11.7 pips; half of candles below 10.9 pips; top 10% above 16.2 pips
- EURUSD H4: averaged 24.1 pips; half below 22.7 pips; top 10% above 32.9 pips
- XAUUSD H1: averaged $21.9; half below $18.9; top 10% above $32
- XAUUSD H4: averaged $44.8; half below $38.9; top 10% above $67.9
By session, EURUSD H1's average 1-hour range was 8.8 pips in Asian hours (01:00-09:59 server time), 13.1 pips in the London morning (10:00-14:59), 17.8 pips in the London/New York overlap (15:00-18:59), and 10.4 pips late in New York (19:00-23:59). XAUUSD H1 showed $21.3, $18.9, $30.9 and $18.7 across the same sessions — the overlap was the most active window for both, past data only.
Practical tips for using ATR
- Set stops as a multiple of ATR (1.5x, 2x) instead of a fixed pip count, so the distance adapts between quiet and active markets
- Compare the current ATR value to its own recent average, not to a number from a different symbol
- On gold, read ATR in dollars — a reading of 20 on XAUUSD is not the same move as 20 on EURUSD
- Expect ATR to widen during session overlaps and around high-impact news, and to narrow in quiet Asian-session hours
- Pair ATR with a direction signal — it has no view on direction, only on size
- When trailing with ATR, let the stop move only in your favor, never back toward price
Quick checklist before you trade with ATR
- Check the current ATR value against its recent average: is the market quiet or active right now?
- Pick an ATR period that matches your holding time — shorter for scalping, longer for swing
- Size the stop and target as a multiple of ATR, not a fixed pip count
- Pair ATR with a trend, breakout or structure signal before entering
FAQ
Does ATR work the same way in stocks, forex and gold? Yes — the formula is identical everywhere. The only difference is the unit: pips on most forex pairs, price (dollars) on gold and on stocks.
Does a rising ATR mean I should buy? No. ATR only measures how big candles are, not which direction price is heading. A rising ATR during a downtrend means a bigger downtrend, not a reversal.