









Uptrend
Also called Bullish trend, Upward trend, Rising market
An uptrend is a market where price keeps making higher highs and higher lows: each rally peaks above the last one, and each pullback stops above the previous low.
Reading an uptrend correctly tells you which side to trade and where your stop belongs. Traders often lose money by buying something that only looks like an uptrend. It may be a range, or a trend whose last low has already broken.
In forex, an uptrend on a pair means the first currency is gaining against the second. On EURUSD, it means the euro buys more dollars over time. The same structure applies to stocks, indices and commodities.
How to confirm an uptrend: a 6-step checklist
A swing high is a peak with lower highs on both sides of it. A swing low is a dip with higher lows on both sides of it. Work through these steps in order:
- Mark the last two swing highs. The newer one must be higher than the older one.
- Mark the last two swing lows. The newer one must also be higher. This is the higher low.
- Check the latest pullback. It must stop above that higher low.
- Wait for a candle to close above the latest swing high. A wick poking above it is not enough. This close is the break of structure: proof that buyers are still pushing price up.
- Check the next timeframe up. A 15-minute uptrend is stronger when the 1-hour or 4-hour chart is rising too.
- Rule out a range. If price keeps bouncing between the same two levels without new highs, you are in a sideways market.
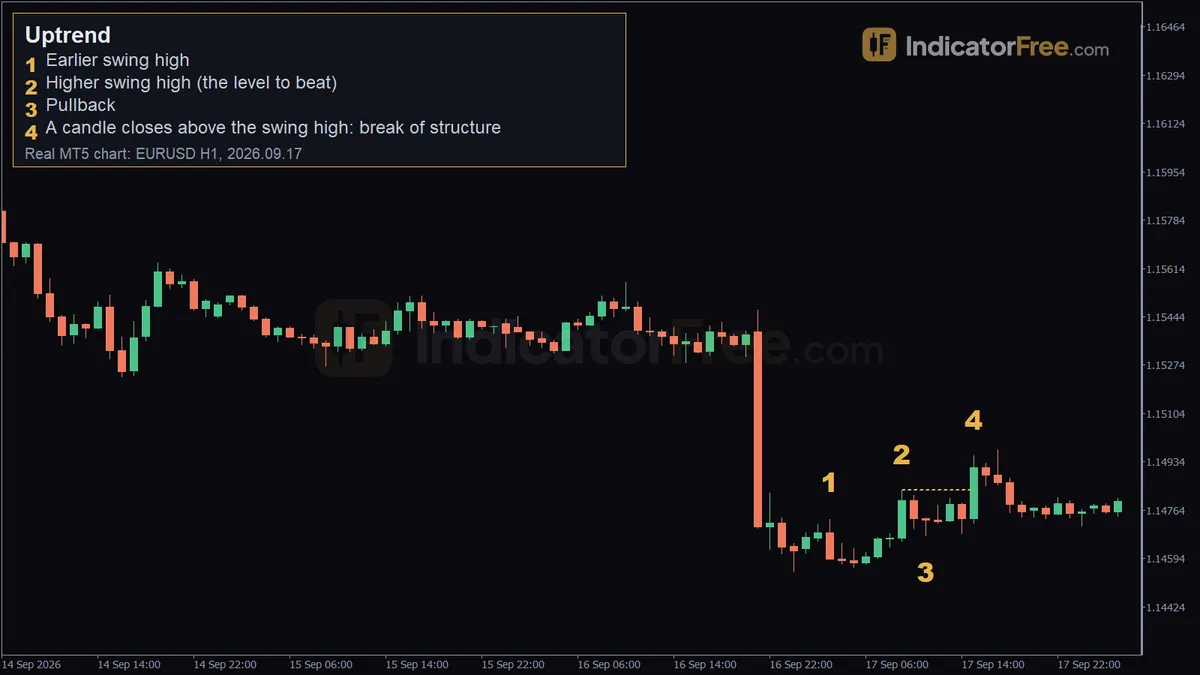
The drawn chart below shows every step on one picture. The first swing low sits lowest, the next low holds above it, and the trend is confirmed when a candle closes above the prior high.
The EURUSD 1-hour chart above: a break of structure, marker by marker
The EURUSD 1-hour chart at the top of this page is a past example, not a prediction. It shows the second half of the checklist: a higher high, a pullback and the close that breaks structure. All four markers fall on 17 September 2026.
- Marker 1 (03:00): an earlier swing high at 1.14731.
- Marker 2 (09:00): a higher swing high at 1.14835. Step 1 passes, and this is the level buyers must beat.
- Marker 3 (11:00): a pullback down to 1.14674. The setup depends on this low. A close below it cancels the trade idea.
- Marker 4 (15:00): this candle closed at 1.14913, above the 1.14835 high. That close is the break of structure. The marker is drawn above the candle's high, at 1.14957, so it does not hide the bars. The price that counts is the close.
The chart does not mark the swing low that came before the 1.14674 pullback. To pass steps 2 and 3, scroll left and check that this earlier low sits below 1.14674. If it does, 1.14674 is a higher low and the uptrend is confirmed. If the earlier low is higher, you have a break above a high, but not proof of an uptrend.
Healthy, weak or broken: telling uptrends apart
Pullback depth alone does not break a trend. Healthy uptrends often give back half or more of a rally before turning up again. Some traders only buy when a pullback is shallower than about half of the rally. That is a filter you choose for yourself, not a rule the market follows. Depth only starts to matter once the pullback threatens the last higher low.
| Healthy | Weak | Broken | |
|---|---|---|---|
| Swing lows | Clearly rising | Flattening, nearly equal | A candle closes below the last higher low |
| New highs | Confirmed by a candle close | Wick above the old high, close back below | No new high |
| Pullbacks | Hold well above the last low | Erase almost all of the rally | Run through the last low |
| What you do | Trade with it | Tighten stops, no new buys | Close or stop adding to longs |
A common misread is the failed break. On the candle itself you see a long upper wick above the old high, with the body closing back below it. If no candle has closed above the high, treat it as not broken.
Trading the uptrend: buy the break or wait for the next higher low
Buying the close above 1.14835
- Entry: on the close of the confirming candle, 1.14913.
- Stop loss: at the pullback low of 1.14674. Price there means the trade idea is wrong. The plan below uses that exact level. If you place your stop a few pips lower so a single wick does not take you out, add those pips to the stop distance before you size the trade.
- Target: the chart gives no natural target, so size it from the risk. The plan uses two times the stop distance (2R).
The figures below are an illustrative example. They use the chart's real entry and pullback low and a 10,000-unit position (0.1 lot), where one pip on EURUSD is worth $1.
Buying the next higher low
This setup comes after the chart ends, so it has no price on the image yet. If you missed the break, do not chase it. Wait for the next pullback after 15:00 and watch whether it holds above 1.14674. Enter when a candle closes above the high of the last pullback candle. Put your stop just below the new low, which gives a tighter stop than the first setup.
For the exit, use the same 2R maths or trail the stop. To trail, move your stop up to just below each new higher low once it holds. You stay in while the structure holds and get out when it breaks.
When uptrend setups work and when to stand aside
They work best when swings are clearly separated and the higher timeframe is rising too. Then both the pullback and the break give you an obvious stop level.
They work poorly after a long, fast rally, because the last higher low sits far away and your stop gets wide. They also fail in slow, choppy markets where highs and lows barely clear each other. Decision rule: if the distance to the last higher low is more than you normally risk, skip the trade or wait for a closer higher low.
| Pros | Cons |
|---|---|
| Gives you an objective read on direction | One pair of swings means little without the higher timeframe |
| The last higher low is a logical stop level | Normal pullbacks can look like reversals and shake you out |
| A close above the high is a clear trigger | A swing is only confirmed a few candles after it forms, so the read lags |
| The same rules work from 15-minute to daily charts | Late entries after a big rally carry wide stops |
Uptrend, downtrend and sideways markets
An uptrend is the bullish version of trend structure: you look for buys and place stops under higher lows. The bearish mirror is a downtrend, built from lower highs and lower lows. When neither pattern holds, you have a sideways market. Both have their own glossary entries.
Practical tips for trading an uptrend
- Judge structure on closed candles only. A high or low that is still forming can change before the candle ends.
- Use one swing definition every time, for example a peak with two lower highs on each side, so your reads stay consistent.
- Write down your invalidation level, the last higher low, before you click buy.
- A trend line under the higher lows that starts to flatten warns that the trend is slowing.
FAQ
Can a pair be in an uptrend and a downtrend at the same time?
Yes, on different timeframes. A daily chart can be rising while the 1-hour chart prints lower highs during a pullback. Pick the timeframe you trade and use the higher one as context.
What if price makes a higher high but a lower low?
Treat the market as trendless until a new higher low forms and a candle closes above the latest swing high. The lower low has broken the higher-low pattern, even though the high is still rising.
How long does an uptrend last?
Nothing on the chart predicts it. Length scales with the timeframe: a 15-minute uptrend may last hours, a daily one may last months. Don't plan around a time target. Trail your stop and let the structure decide your exit.