









Swing High/Low
Also called Swing Point, Swing High, Swing Low, Pivot High/Low
A swing high is a candle whose high sits above the highs of the candles on both sides of it. A swing low is a candle whose low sits below the lows on both sides. Together they mark the turning points of price.
Almost every price-action decision rests on these points: which way the trend runs, where your stop goes, and whether a breakout is real. If you mark the wrong swing, your stop ends up inside ordinary noise and gets hit for no good reason.
How to mark a swing high or swing low: a 7-step checklist
A swing is the move from one swing point to the next. Price moves in a zigzag of these legs, and the swing points are the corners. To mark the corners the same way every time, follow these steps in order:
- Pick one timeframe and stay on it. A swing on the 1-hour chart can be invisible on the daily chart.
- Find the candidate candle. For a swing high, its high must be above the highs of at least 2 candles before it and 2 candles after it. For a swing low, its low must be below the lows of 2 candles on each side. More candles per side gives fewer, larger swings.
- Wait for the right-side candles to close. Until they do, the point is only a candidate. It is not a swing yet.
- Check that price really moved away. The move away from the point should be at least two average candle ranges. On the chart below, price moved 36 pips in closes from the swing low to the swing high. A one-pip wiggle is not a turning point.
- Keep highs and lows alternating. There must be a swing low between two swing highs. If you have two highs in a row, keep only the higher one.
- Mark the wick, not the body. The swing level is the candle's extreme high or low, because that is where price turned.
- Judge breaks by candle close. A level counts as broken only when a candle closes beyond it.
The chart below uses made-up prices to show the checklist at work. It has a swing low, a swing high, a higher swing low, and then a candle that closes above the swing high.
Telling a strong swing point from a weak or broken one
A strong swing point has a clear move away from it, sits at the edge of a visible leg, and lines up with a swing on the next timeframe up. Price left it with intent, so stops placed beyond it are protected by a real turn.
A weak swing point formed inside a tight range, after only a small pullback, or during a news spike. Several equal highs a few pips apart in a choppy market are weak too. They are easy to mark and easy to break, so they tell you little.
A broken swing point has had a candle close beyond it. A swing high broken by a close above is no longer the level to beat. The new high takes its place.
A common misread is treating a wick through the level as a break. If price pokes above a swing high and the candle closes back below it, the level was only swept, not broken. Wait for the close before you act.
Reading the swing points in the EURUSD 1-hour example
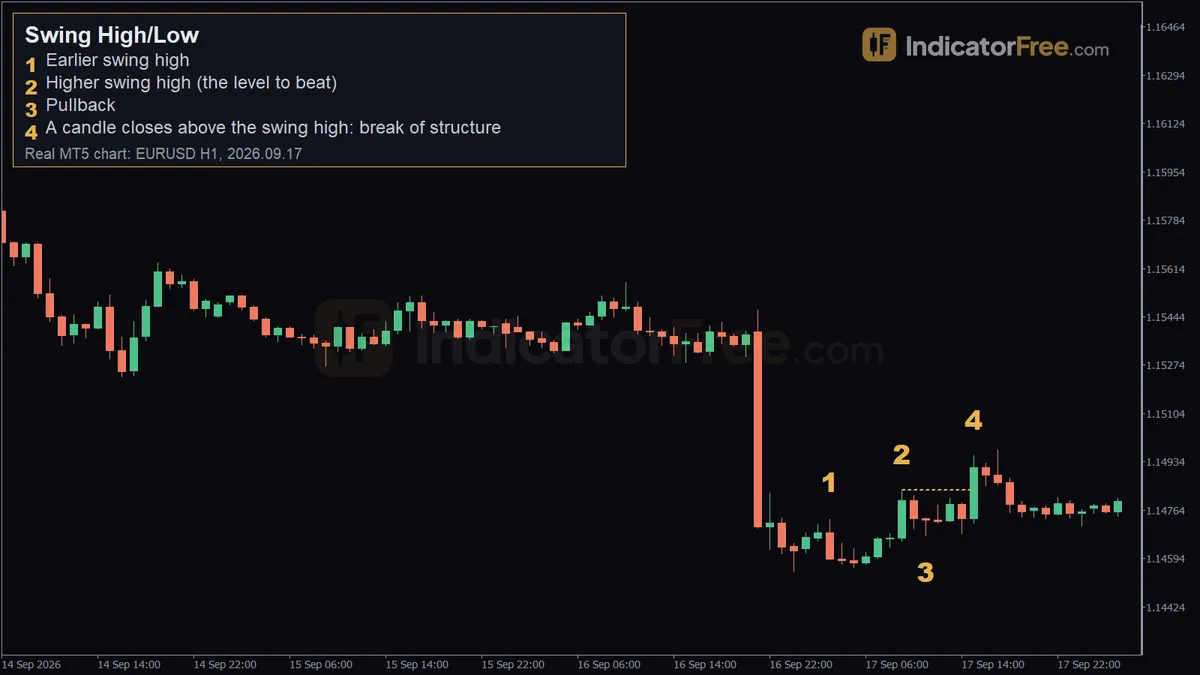
The chart at the top of the page is a past example from EURUSD on the 1-hour chart, 17 September 2026. It is not a prediction. Read it marker by marker:
- Marker 1, earlier swing high (03:00, 1.14731). This is the first turning point in the sequence.
- Marker 2, higher swing high (09:00, 1.14835). This one is above marker 1, so buyers are pushing each peak higher. It becomes the level to beat.
- Marker 3, pullback (11:00, 1.14674). Price pulled back to 1.14674; this low is where your stop goes in setup 1. Note that it went 5.7 pips below the old swing high at 1.14731 (1.14731 − 1.14674 = 0.00057), so that old high did not hold as support.
- Marker 4, break of structure (15:00). The candle closed at 1.14913, which is 7.8 pips above the 1.14835 swing high (1.14913 − 1.14835 = 0.00078). The marker sits above the candle, at 1.14957. The close is what confirms the break.
The lesson: one old level failing (marker 3) did not cancel the uptrend. The swing that mattered was the most recent high, and price closed above it.
Trade setups built on swing highs and lows
Setup 1: Buying the close above a swing high
The trade plan below is an illustrative example built on the prices of that past EURUSD chart. It is not a record of a real trade. You enter at the close of the break candle, 1.14913. Your stop goes below the swing low that formed the pullback, 1.14674. If price falls back under that low, the up-structure has failed. Your target is twice the risk.
The calculation below assumes a 0.20-lot position. On a USD-quoted pair such as EURUSD, one standard lot (100,000 units) is worth $10 per pip.
If you add a small buffer below the swing low, measure the stop from that buffer price instead. Then reduce the lot size so the money at risk stays the same.
Setup 2: Buying from a higher swing low
Use the illustrative chart from the checklist section. The higher swing low is only confirmed once the two candles after it have closed, so your earliest entry is the close of the second of those candles. Your stop goes 3 pips under the higher swing low, which puts it 32 pips from your entry. Your first target is the swing high marked on the chart, only 15 pips away.
Before you enter, ask one question: is the distance to your target at least as large as your stop? Here it is not, 15 pips against 32. This leads to a decision rule: if the distance to the previous swing high is smaller than your stop, either skip the trade or wait for a close above that high. On this chart, waiting would have meant entering at the close above the swing high and using setup 1 instead.
When swing points work and when to avoid them
Swing points are most useful in a market that is clearly trending on the 1-hour chart or above, where legs are long and pullbacks are obvious. They are least useful in tight sideways ranges, on very short charts such as 1-minute, and in the minutes around high-impact news, when candles spike through levels and reverse.
| Pros | Cons |
|---|---|
| Objective rule: anyone can mark the same point | Confirmed only after the right-side candles close, so always late |
| Gives a logical place for your stop | Tight ranges produce many weak, meaningless swings |
| Shows trend direction without any indicator | Different candle counts per side give different swings |
| Works on any market and timeframe | News spikes create swings that mean nothing |
Bullish and bearish swing structure
In a bullish structure, each swing high and each swing low is higher than the one before. Your bias is to buy pullbacks.
In a bearish structure, each swing high and each swing low is lower than the one before. Your bias is to sell rallies.
Practical tips for marking swing points
- Mark swings on the higher timeframe first, then drop down. A 1-hour swing low that sits on a 4-hour swing low is worth more than one in the middle of nowhere.
- Use the same number of candles per side on every chart. Changing it from trade to trade lets you see whatever you want to see.
- Put your stop beyond the swing that would prove you wrong, not beyond the nearest wiggle.
- Delete broken levels from your chart. Old lines that no longer matter clutter your view and pull you into bad trades.
- When you see two or three swing highs at almost the same price, expect stops to sit just above them and expect a sweep before any real move.
FAQ
Can an indicator mark swing highs and lows for me?
Yes. Many charting platforms include fractal or pivot indicators that mark these points automatically. Each one has a lookback setting, which is the number of candles checked on each side. Set it to match your manual rule so the marks agree with your eyes.
Why does a swing marker from an indicator disappear?
An indicator may mark a candidate and then remove it, or move it, when a new candle prints a more extreme high or low. Check that a mark has stayed in place before you act on it.
Which timeframe should I use to mark swing points?
Start with the timeframe your trade idea comes from, usually the 1-hour or 4-hour chart for intraday and swing traders. Use the next timeframe up to judge which way the trend runs. Use the lower one only to time your entry.