









Downtrend
Also called Bearish trend, Downward trend, Falling market
A downtrend is a market move where each swing high and each swing low is lower than the one before it, which shows that sellers are in control.
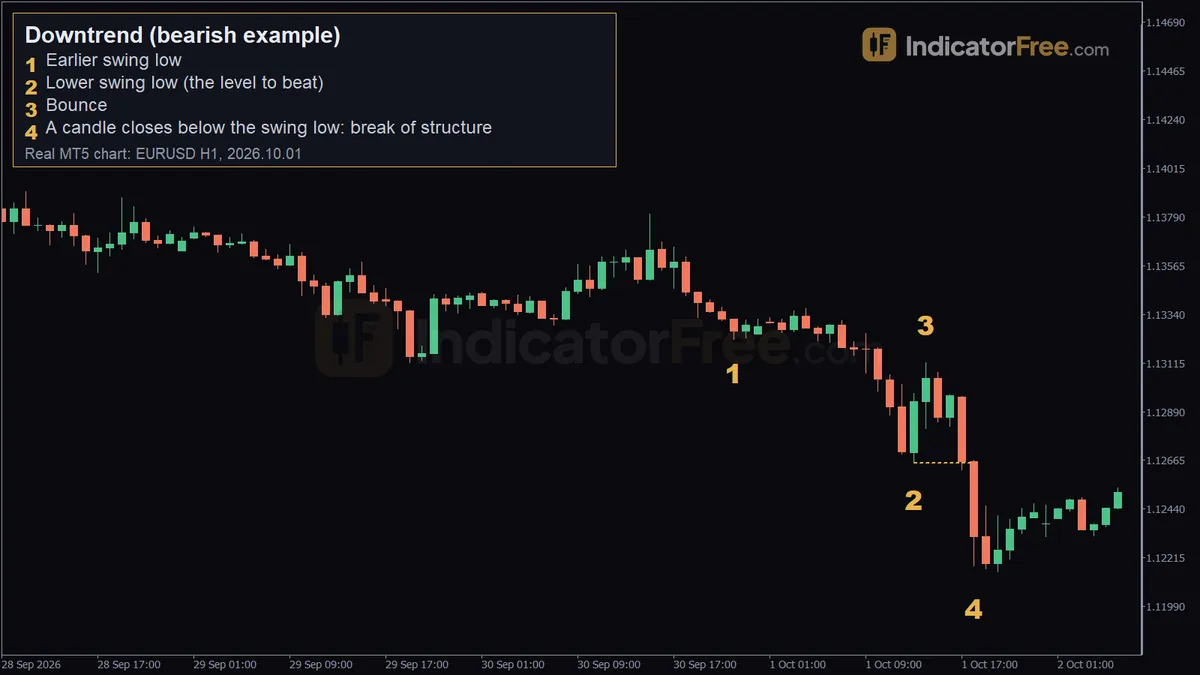
A common way to lose money in a falling market is to buy a bounce before the price pattern has changed. Knowing you are in a downtrend tells you which trades to skip. It also shows you the exact level where a short trade is proven wrong.
How to identify a downtrend: a six-step check
- Mark only the clear turning points. A swing high is a peak whose high is above the highs of the candles on both sides. A swing low is a trough whose low is below the lows on both sides.
- Compare each new swing high with the previous swing high. If it is lower, it is a lower high.
- Compare each new swing low with the previous swing low. If it is lower, it is a lower low.
- Count before you trade. You need at least two lower highs and at least one lower low already on the chart.
- Wait for a candle to close below the latest swing low. This is a break of structure: sellers have pushed price to a fresh low, which prints the next lower low.
- Repeat steps 2 and 3 on every new swing. The downtrend lasts only while both stay true.
Always compare like with like: a high against the previous high, and a low against the previous low. If you compare a bounce with an old low, you learn something different (see the EURUSD case below). That comparison does not make the bounce a lower high.
Reading a downtrend on the chart, swing by swing
The chart below is an illustrative example drawn to show the structure. It is not real market data. Read it from left to right, using the six steps above.
- Swing high. This is the starting peak and the highest point on the chart. You measure every later high against it.
- Swing low. This is the first trough. You measure every later low against it.
- Lower high. The bounce stalls 18 pips under the swing high. That is the first lower high.
- Lower low (the lower line). The next drop ends 20 pips below the first swing low. That is the first lower low.
- Second lower high (the upper line). The next bounce stops 22 pips under the first lower high. You now have two lower highs and one lower low, so step 4 is met.
- Close below the low. The candle before it dipped under the lower line, but only with a wick, and it closed back above the line. A wick does not count. The next candle closed 10 pips below the swing low. That close is the break of structure.
A past EURUSD 1-hour case in numbers
This is a past example, not a prediction. On EURUSD 1-hour candles, a swing low formed at 1.13224 on 30 September 2026. The next swing low, on 1 October 2026, was lower at 1.12653, so it was a lower low. Price then bounced to 1.13118. Later that day, a candle closed at 1.12314, below 1.12653. That close was a break of structure.
The bounce to 1.13118 stalled about 11 pips under the old 1.13224 low. So the old floor acted as a ceiling, which is a sign of seller pressure. But these numbers contain no swing highs. They confirm lower lows and a break, not lower highs. Before you trade a case like this, find the earlier swing highs on your own chart and run step 4.
When a downtrend is weakening or broken
A downtrend is healthy when bounces stay about the same size or shrink, and each leg down reaches a fresh low cleanly. In the chart above, the two bounces measure 32 pips and 30 pips. That is a steady pattern.
A downtrend turns weak when bounces grow and start pushing into old highs, or when new lows only just get past the previous one. Both are warnings that sellers are losing control, even though no rule has been broken yet.
A downtrend is broken when a candle closes above the most recent lower high (the upper line in the chart). From that point, treat the chart as a possible reversal or a sideways market, not as a pause in the fall.
Decision rule: if a bounce only pokes above the last lower high with a wick and closes back below it, the downtrend still stands, but stay alert. If a candle closes above that level, stop looking for shorts. Wait until price forms a new lower high and closes below the latest swing low again.
A common misread is to call one large red candle a downtrend. One drop is just a move. Until steps 2 to 4 are met, you have no structure to trade.
Shorting the break of structure
Short entry on the close below the swing low
This setup uses the illustrative chart above, so every figure below is part of that example.
- Entry: sell when the break candle closes (the "Close below low" mark). Wait for the close, not just a wick, below the lower line.
- Stop loss: 5 pips above the last lower high (the upper line). The lower high sits 40 pips above the entry close, so the stop is 45 pips away. If price closes above that high, the structure has failed and the trade idea is wrong.
- Target: the chart ends before price gets far, so set the target as a multiple of your risk. At twice the risk, the target is 90 pips below the entry.
On EURUSD, one standard lot is 100,000 units, and one pip is worth $10. A 45-pip stop risks $450 per standard lot, or $45 per mini lot of 10,000 units. Choose your size from the stop distance and the amount you are willing to lose, not from a fixed lot size.
Where downtrend trading works and where it fails
Swing rules work best when each swing spans several candles and the turning points are easy to see. They work poorly in a tight range, around major news releases, and on very short charts where a new swing prints every few candles.
Decision rule: if the swings on your chart keep flipping before you can count two of them, switch to a higher timeframe until each swing spans several candles.
| Pros | Cons |
|---|---|
| Lower highs and lower lows are easy to mark on any chart | A swing point is confirmed only after it forms, so you always act a step late |
| Works on any market that shows clear swings | Choppy stretches can print a lower low that reverses straight away |
| The last lower high gives one clear level that cancels the trade | A strong bounce can turn into a full reversal before a new low prints |
| The stop comes from the chart, not from a guess | A news spike can break a swing level without changing the trend |
Downtrend vs uptrend: the bullish mirror
The bullish version is an uptrend: higher highs and higher lows, read with the same steps in the opposite direction. A downtrend is the bearish version. Signs that one is running out of energy are covered under trend exhaustion.
Practical tips for trading a downtrend
- Read the trend on a higher timeframe first, then look for entries on a lower one. A bounce on the 1-hour chart can look like a reversal on the 15-minute chart.
- After each failed bounce, move your reference to the new lower high. That gives you a tighter stop for the next entry.
- If a new low prints only a few pips below the last one and the candle closes back near the old low, treat it as a weak break. Wait for the next bounce to stall under the last lower high, or skip the trade.
- If you missed the break candle and price has already run far, do not chase it. Wait for the next bounce to fail below a new lower high.
- When a bounce stalls under an old broken low, as the EURUSD bounce did under 1.13224, mark that low as a ceiling. A close above it is an early warning, even before the last lower high gives way.
Quick downtrend checklist
- At least two lower highs and one lower low, each compared like with like
- A candle closed (not just wicked) below the latest swing low
- No close above the last lower high since then
- Stop above the last lower high, with size based on that distance
FAQ
Should I buy a currency pair or stock just because it has fallen a lot?
Not on the size of the fall alone. A cheap-looking price can keep falling. Even after the downtrend breaks, wait for a higher low, the first sign that an uptrend may be starting.
Can a moving average confirm a downtrend?
Yes, as a filter. Price that stays below a falling moving average supports the reading. The swing highs and lows still decide whether the trend is valid or broken.
How long does a downtrend last?
There is no fixed length. It lasts as long as new lower highs and lower lows keep forming. A downtrend on the daily chart can run for months, while one on the 5-minute chart may be over within an hour.