









200 EMA
Also called EMA 200, 200-period EMA, 200 exponential moving average, 200-day EMA
The 200 EMA is an exponential moving average of the last 200 candle closes, weighted toward recent prices. Traders use it as a long-term trend line: price above a rising 200 EMA points to an uptrend, price below a falling one to a downtrend.
Most traders use the 200 EMA to decide one thing before any entry: which direction they are allowed to trade. Getting that wrong means buying every dip in a market that is falling.
What the 200 EMA measures, and why it moves slowly
An exponential moving average (EMA) is an average of past closing prices that gives the newest close more weight than older ones. The weight of the newest candle is 2 ÷ (period + 1).
For a 200 EMA that is 2 ÷ 201, or about 1%. Each new candle moves the line by only about 1% of the gap between the close and the line. That is why one news spike barely bends it, and why the line turns long after price has turned.
The period counts candles, not days. A 200 EMA on a 1-hour chart covers roughly eight trading days of closes. On a daily chart it covers about 40 weeks. Choose the chart first, because it decides which trend the line describes.
How to read the 200 EMA: a 5-step checklist
- Add an EMA with period 200, applied to the close, on the timeframe you trade.
- Check the slope. Rising, falling or flat tells you more than where price sits today.
- Check the side. Count only candle closes above or below the line, not wicks.
- Check the distance. Price far from the line is stretched, and price near it is at a decision point.
- Count recent crossings. If price has closed across the line several times in the last 20 candles, treat the market as a range and ignore the line.
Valid 200 EMA signals vs weak or broken ones
A valid read has three things at once: a clear slope, price holding on one side, and pullbacks that touch the line and close back on the trend side.
A weak read has a flat line with price weaving through it. The 200 EMA then sits in the middle of a range and gives no direction.
A broken read is a full candle close on the other side, followed by a retest that fails to get back. A single wick through the line is not a break.
The drawing below shows a valid touch, then a break and a failed retest.
A real pullback to a rising EMA, marker by marker
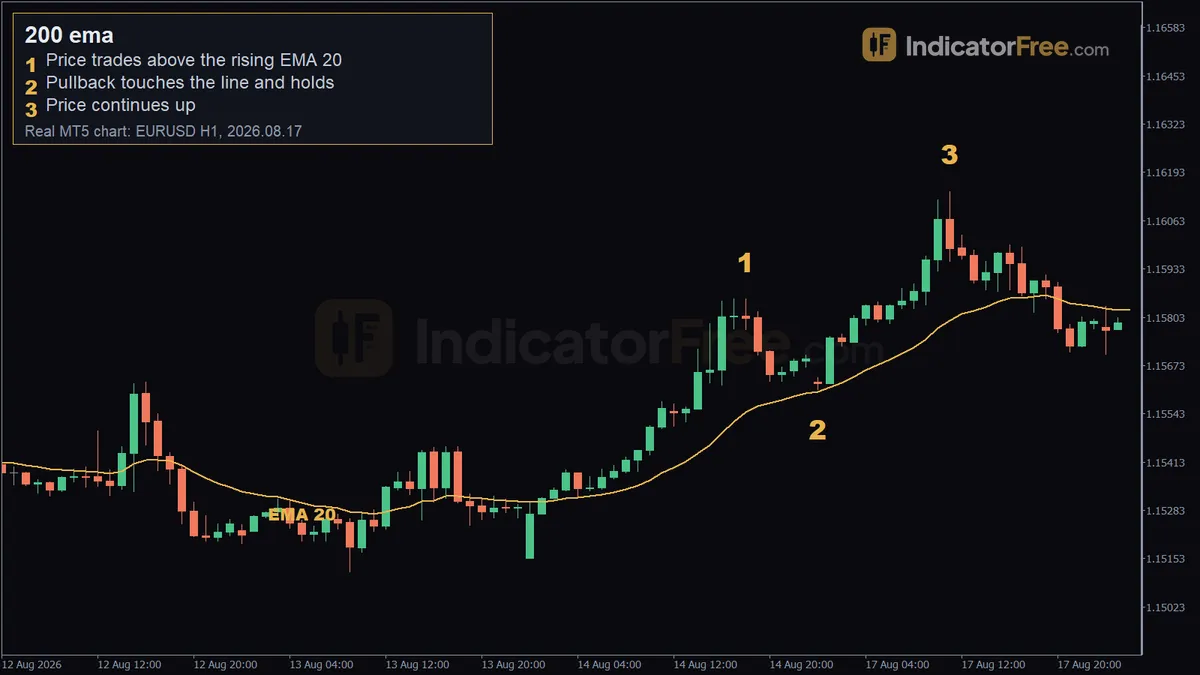
The chart at the top of the page shows a 20 EMA, not a 200. It is EURUSD on the 1-hour timeframe, and the 20 EMA is a much faster line than the 200. The touch-and-hold behaviour is the same thing you look for at a 200 EMA, where it happens far less often. It is a past example, not a prediction.
- Marker 1 (2026.08.14 18:00, 1.15853): price trades above the rising line. It had closed above the line for 15 candles while the line was rising.
- Marker 2 (2026.08.17 00:00, 1.15608): the pullback low at 1.15608 reaches the line at 1.15601, less than a pip away, and the candle closes above it.
- Marker 3 (2026.08.17 11:00, 1.16141): price continues up. The move from the touch was 52 pips in 15 candles.
On a 200 EMA the read is identical: slope first, then the touch, then the close.
200 EMA trading strategy: two setups with entry, stop and target
The pip distances and account figures in this section are an illustrative example with round numbers. The only price levels used are the ones from the past chart at the top of the page.
Setup 1: pullback and hold in the trend direction
Take the touch at marker 2 as the model. The line is rising, and the 20 EMA in the example sits at 1.15601. Price pulls back, makes a low at 1.15608 and the candle closes above the line.
- Entry: buy after the candle has closed above the line, not while it is still forming.
- Stop loss: below both the pullback low at 1.15608 and the line at 1.15601. In this example that is 30 pips from the entry.
- Target: twice the risk, 60 pips above the entry. The pictured move was 52 pips in 15 candles from the touch, so it stopped short of a 60-pip target inside the chart window.
Size the trade from the stop, not the other way round. On a USD-quoted pair one standard lot (100,000 units) is worth $10 per pip.
Setup 2: break and failed retest
Price closes below the 200 EMA, rallies back to the line from underneath and is rejected. The next candle closes lower, away from the line.
- Entry: sell after the rejection candle closes.
- Stop loss: above the line and the retest high. In this example that is 30 pips from the entry.
- Target: 60 pips below the entry.
If the retest candle closes back above the line instead, there is no trade. The break has failed.
When the 200 EMA helps and when to leave it alone
It helps most in markets that travel in one direction for a long stretch.
The IndicatorFree Lab counted how often price closed across a 200-period simple moving average, a close cousin of the 200 EMA. On EURUSD 1-hour (2023-01-02 to 2023-06-08) that was 4.3 times per week on average, against 13.8 for the 20-period line.
The timeframe changes the count. On EURUSD 4-hour over the same period it was 0.4 times per week. On XAUUSD (2025-10-02 to 2026-10-02) it was 3 times per week on the 1-hour chart and 1.1 on the 4-hour. This is past data, not a forecast.
| Pros | Cons |
|---|---|
| One clear rule for trade direction | Turns late, well after price has reversed |
| Few crossings compared with short averages | Gives no direction in a range |
| Widely watched level for pullbacks | Stops are often wide because price can be far from the line |
| Same reading on any market or timeframe | Needs at least 200 candles of history to be meaningful |
Bullish and bearish versions
Bullish: above a rising 200 EMA, pullbacks hold at or above the line.
Bearish: below a falling 200 EMA, rallies fail at or below the line, so the level you bought at in an uptrend becomes the level you sell at.
Practical tips for trading around the 200 EMA
- Treat the line as a zone, not an exact price. Price often pierces it by a few pips and still holds.
- Wait for the close. A candle that is below the line mid-bar can finish above it.
- Do not buy just because price is above the line. If price is far above it, a stop at the line is too wide for a sensible trade size.
- Put the stop beyond both the line and the swing, then work out the lot size from that distance.
- Check the 200 EMA on one higher timeframe. A long above the 1-hour line but below the 4-hour line is trading against the larger trend.
FAQ
Should I use the 200 EMA or the 200 SMA?
Both track the same long-term trend. The EMA weights recent closes more, so it turns a little earlier and sits closer to price. The simple average is smoother. Pick one and keep it, because switching between them changes where your level is.
Does the 200 EMA look the same on every charting platform?
The formula is the same everywhere. Small differences come from the price feed, the session times used to build candles and how much history is loaded. If two charts disagree, check that both use the close and the same timeframe.
Which timeframe is best for the 200 EMA?
There is no single best one. Use it on the timeframe where you hold trades. Day traders often read it on the 1-hour or 4-hour chart for direction, and swing traders use the daily chart.