









50 EMA
Also called EMA 50, 50-period EMA, 50 exponential moving average, EMA(50)
The 50 EMA is an exponential moving average of the last 50 candle closes, with more weight on recent prices. Traders use the line to judge trend direction and as a moving level where pullbacks often stall.
The 50 EMA answers two questions before you risk money: which direction to trade, and where a pullback becomes worth watching. The costliest misread is treating a flat line as a trend.
What the 50 EMA measures on your timeframe
An exponential moving average (EMA) updates on every candle by adding a fixed share of the newest close. For 50 periods that share is 2 ÷ (50 + 1), so the latest close carries about 3.9% of the weight. Older closes fade out gradually and never drop off in one step.
The number 50 means very different things on different charts. Multiply 50 by your candle length to see roughly how much market time the line summarises.
| Chart | 50 candles cover | What the line describes |
|---|---|---|
| 15-minute | 12.5 hours | About half a trading day |
| 1-hour | 50 hours | About two trading days |
| 4-hour | 200 hours | A little over eight trading days |
| Daily | 50 trading days | About ten weeks |
So "price is above the 50 EMA" is only a full statement once you name the timeframe.
How often price crosses a 50-period average
The IndicatorFree Lab counted closes across moving averages on EUR/USD 1-hour, from 20 October 2025 to 21 October 2026 (6,222 candles of broker demo data). This is past data, not a forecast. The Lab counted closes across simple moving averages, not EMAs. Use these counts as a guide to how often price crosses a 50-period line. They are not a measurement of the 50 EMA itself.
Price closed across the 50-period line 7.9 times per week on average. More than one cross per trading day means a close across the line is a common event, not a signal by itself. On EUR/USD 4-hour, from 20 October 2025 to 21 October 2026, the figure was 2.2 times per week, roughly once every two trading days, so a close across the line on the 4-hour chart is a rarer event.
Many traders pair the 50 with a 20 EMA and act on the cross. In the same EUR/USD 1-hour data, the EMA 20/50 crossed 9.1 times per month (109 crosses), and 16% of crosses were reversed by the next cross within 5 candles. On gold (XAU/USD) 1-hour, from 20 October 2025 to 21 October 2026, it crossed 10.6 times per month (127 crosses) and 13% were reversed within 5 candles.
How to read the 50 EMA: a 5-step checklist
- Plot an EMA with period 50, calculated on the close.
- Check the slope. Compare the line now with where it was 10 candles ago: clearly higher, clearly lower, or about the same.
- Check the side. Count the recent closes: mostly above the line, mostly below, or mixed. Bullish: closes hold above a rising 50 EMA and pullbacks into the line are buying areas, the moving-average picture of an uptrend. Bearish: closes hold below a falling 50 EMA and rallies into the line are selling areas, the picture of a downtrend.
- Check the space. Price should have moved away from the line and then come back. That return is the pullback.
- Wait for the candle at the line to close. Decide on the close, never on a candle that is still moving.
Decision rule: if the slope and the side agree, trade only in that direction. If the line is flat or closes are mixed, the 50 EMA gives you no information and you stand aside.
The chart below shows both cases. On the left, closes stay above a rising line and only buys make sense. On the right, the line goes flat and closes land on both sides of it, so there is no trade.
Valid 50 EMA pullback vs a broken one
A valid touch has three parts. The line is sloping, price arrives at it after a clear move away, and the candle that touches it closes back on the trend side.
If price has already tested the line several times in the last few candles, the touch is weak: trade smaller or skip it.
The level is broken when a candle body closes on the other side and the next candle does not reclaim it. A wick through the line is not a break. A frequent misread: a trader sees price pierce the line mid-candle, exits or reverses, and then watches the candle close back where it started.
The drawing below puts both cases side by side. On the left, only the wick goes through the line. On the right, a body closes below it and the next candle stays below.
What the chart at the top of the page shows
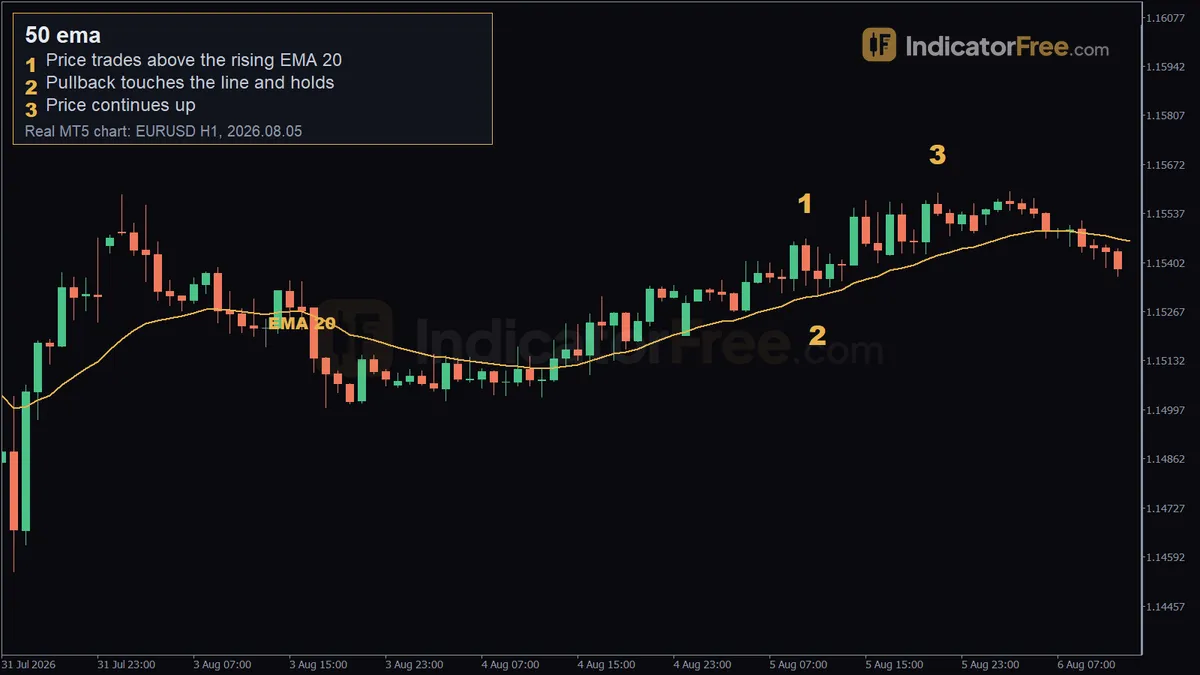
The chart at the top is a past EUR/USD 1-hour example drawn with a 20-period EMA, not the 50. Its markers show price above the rising line, a pullback on 5 August 2026 whose low of 1.15311 touched the line at 1.15310 and closed above it, and price trading higher afterwards at 1.15594.
The 50 EMA follows the same touch-and-hold sequence, and you judge it with the same checklist.
Two 50 EMA trading setups with entry, stop and target
The pip distances in this section are an illustrative example on EUR/USD, using a $5,000 account and 1% risk per trade.
Setup 1: pullback bounce in an uptrend
The 50 EMA is rising. A candle dips a few pips through the line, then closes back above it.
- Entry: buy at the close of that candle.
- Stop loss: a few pips under the candle's low. Risk is 25 pips from the entry.
- Target: twice the risk, 50 pips above the entry.
The drawing below shows where each level sits relative to the line.
Setup 2: break and retest in a downtrend
The 50 EMA has turned down. Price closed below it, then rallied back to touch the line and closed below it again. This is the drawing above flipped: entry at the retest candle's close below the line, stop above that candle's high, and the target below the entry.
- Entry: sell at the close of the retest candle.
- Stop loss: above the retest high. Risk is 25 pips from the entry.
- Target: 50 pips below the entry.
Sizing either setup
Both trades risk 25 pips, so the position size is the same. Set the size from the stop distance, with the stop already placed beyond the touch candle. One standard lot on a USD-quoted pair is worth $10 per pip.
When the 50 EMA helps and when to leave it alone
It helps most when a market is trending in steady legs, with pullbacks that travel back to the line and stop.
Avoid fresh entries at the line just before scheduled high-impact news. A news candle can run through any average without pausing.
| Pros | Cons |
|---|---|
| One line gives direction and a pullback area | Lags price, so it turns after the trend has already changed |
| Reacts faster than a 50-period simple average | Crossed often in ranges, giving false breaks |
| Same rules on any market; only the time span the line covers changes with the timeframe | The line is an area, not an exact price; touches overshoot |
| Easy to combine with a slower average as a filter | Stops placed exactly on it get hit by ordinary wicks |
Tips for trading the 50 EMA
- Log every 50 EMA touch you trade: date, timeframe, slope, and whether the stop or target was hit. After a few dozen entries you can see which conditions your own results depend on.
- Check the next timeframe up. A 1-hour buy at the 50 EMA is cleaner when the 4-hour line is also rising.
- Look left before entering. If a recent swing high sits between your entry and the 2x target, the real room to run is smaller than the plan says, so skip the trade or take profit at that swing.
- After two closes across the line in opposite directions, pause. Resume only when the line is clearly higher or lower than it was 10 candles ago again.
FAQ
Does the 50 EMA behave the same on gold as on EUR/USD?
The rules are the same, but gold was slightly choppier around a 50-period line in the Lab's data. From 20 October 2025 to 21 October 2026 on the 1-hour chart, gold (XAU/USD) closed across its SMA 50 8.9 times per week, against 7.9 times per week for EUR/USD. This is past data, not a forecast. Gold moves in larger price steps, so set your stop from the touch candle rather than copying a pip distance from EUR/USD.
Should I use the 50 EMA or the 50 SMA?
The EMA reacts sooner to a new move because recent closes weigh more. The simple average is smoother and turns later. Pick one and keep it, because switching between them changes where your levels sit.
Why does my 50 EMA show a slightly different value on another charting platform?
The weighting formula is the same everywhere. Small differences come from three places: the price feed, how much history is loaded (an EMA carries a trace of every earlier candle), and how the platform starts the EMA, either from a simple average of the first 50 closes or from the first close. The gap is usually small on liquid pairs.
Can I trade with the 50 EMA alone?
You can read direction with it alone, but it does not tell you when momentum is fading or where a prior high or low sits. Most traders add at least price structure, such as recent swing points, before placing an order.