50 EMA Zone
Free MT5 50 EMA zone indicator: ATR-sized band, slope colours and Bounce/Break arrows. Lab: 0 of 234 signals repainted on EURUSD M15.
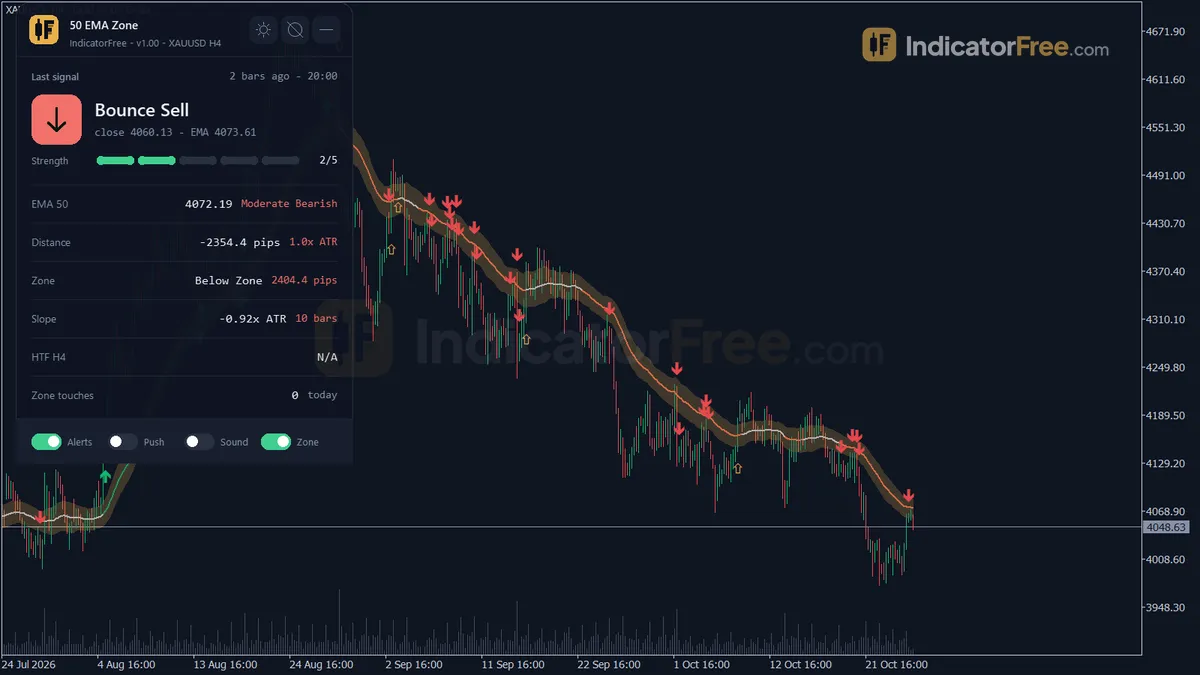
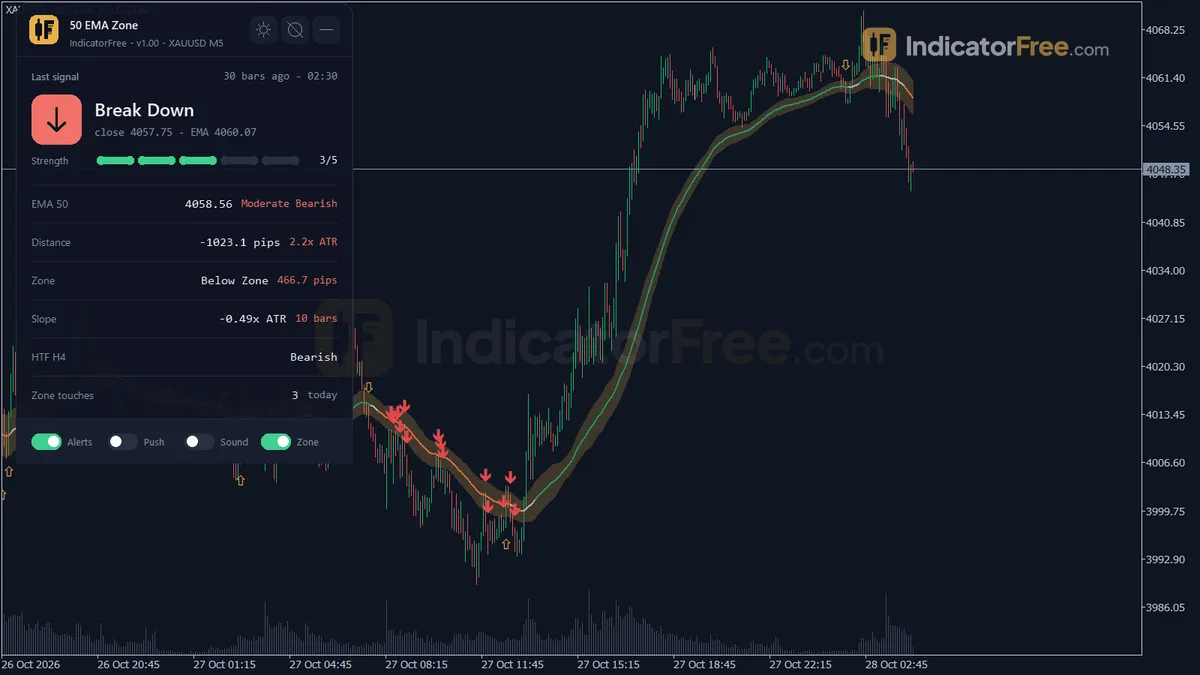
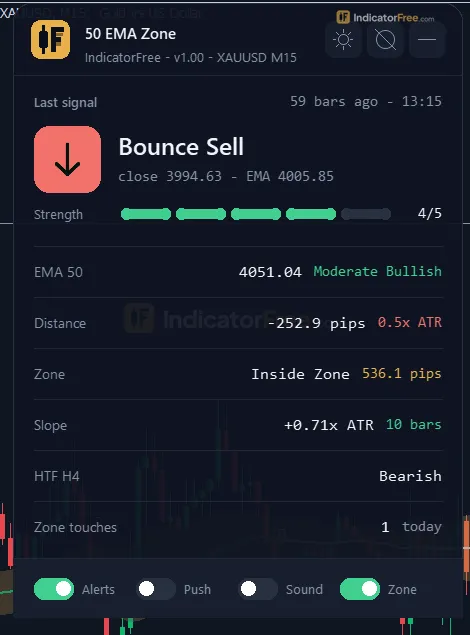
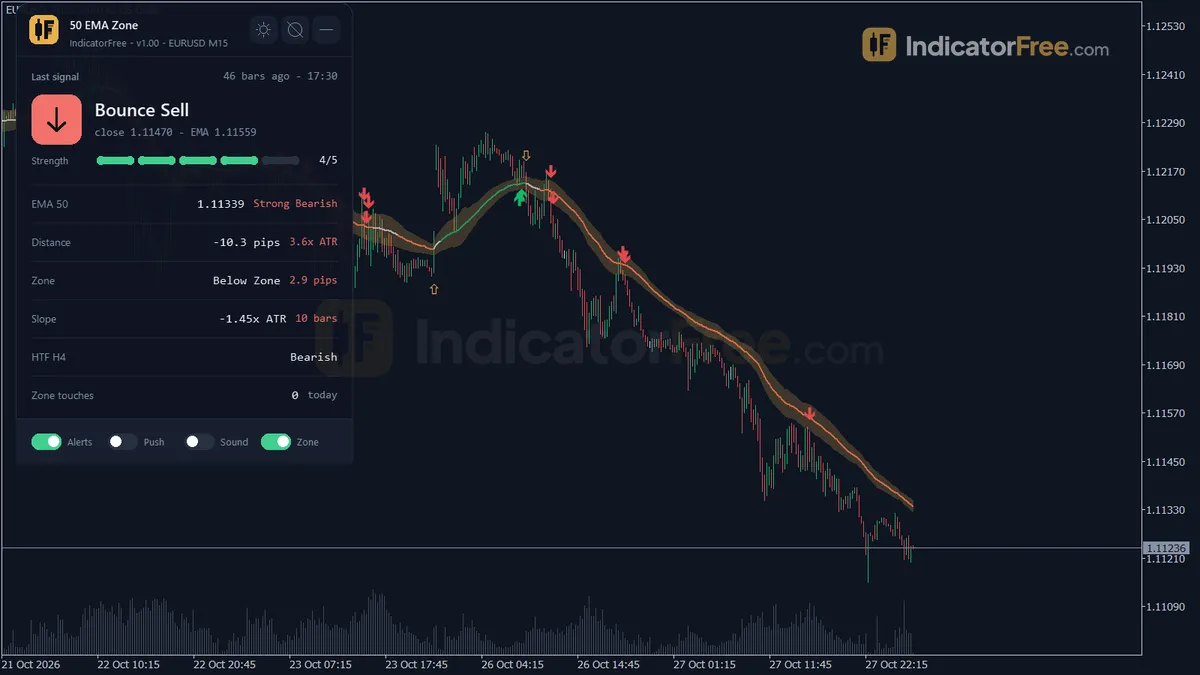
- Repainted
- 0 / 234
- Signals / week
- ≈ 17.8
- Tested on
- EURUSD M15
- Tested
- 2026-10-09
Overview
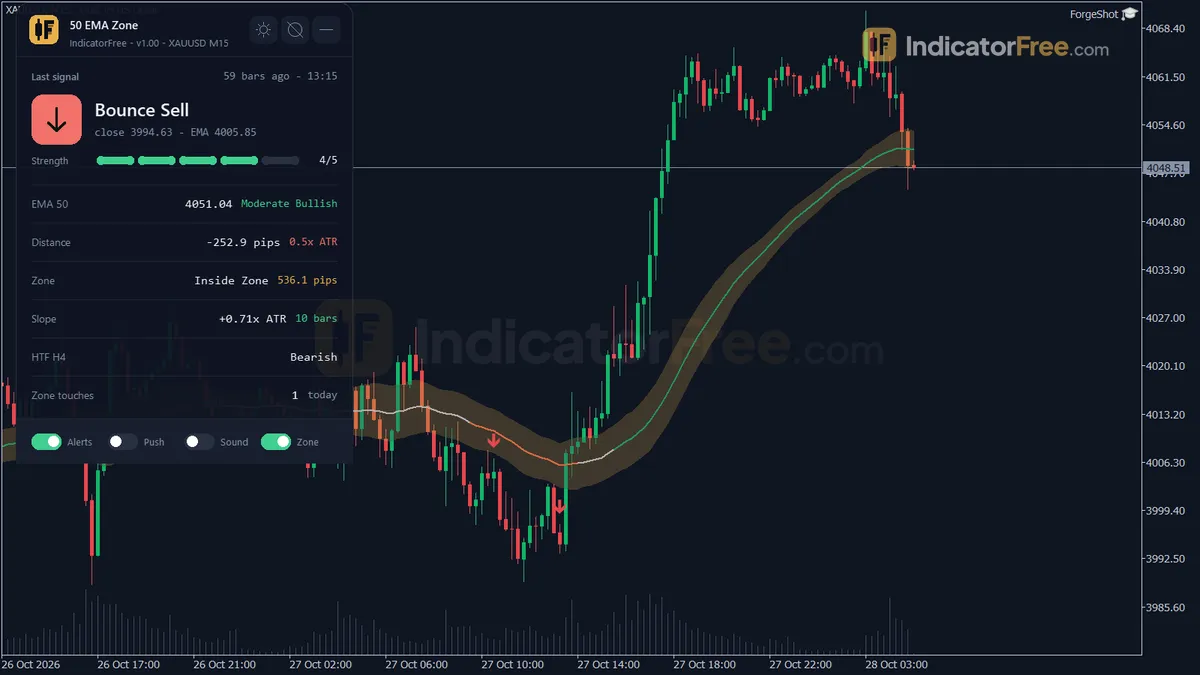
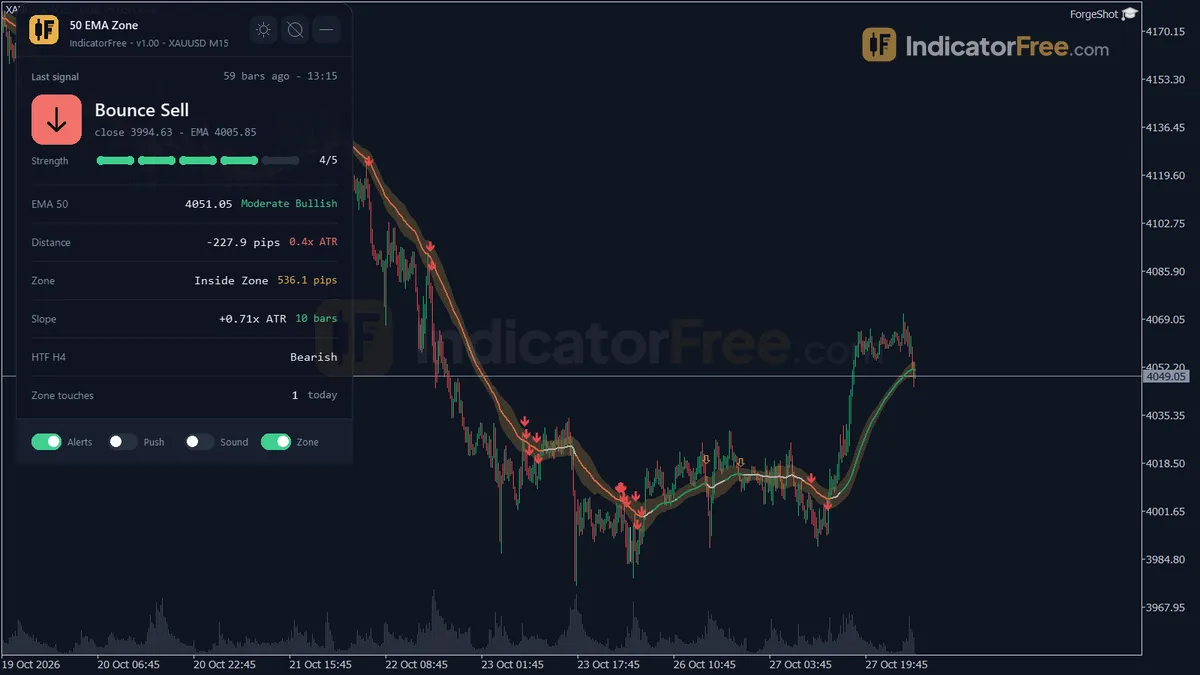
50 EMA Zone draws a 50-period EMA on your MT5 price chart and places an ATR-sized band around it. The line changes colour with the EMA's slope, and the indicator marks four closed-bar arrows: Bounce Buy, Bounce Sell, Break Up and Break Down. In the Lab's repaint test on EURUSD M15, 0 of 234 signals changed after their bar closed.
It suits trend traders who buy pullbacks to the 50 EMA and want a fixed rule for what counts as touching the line.
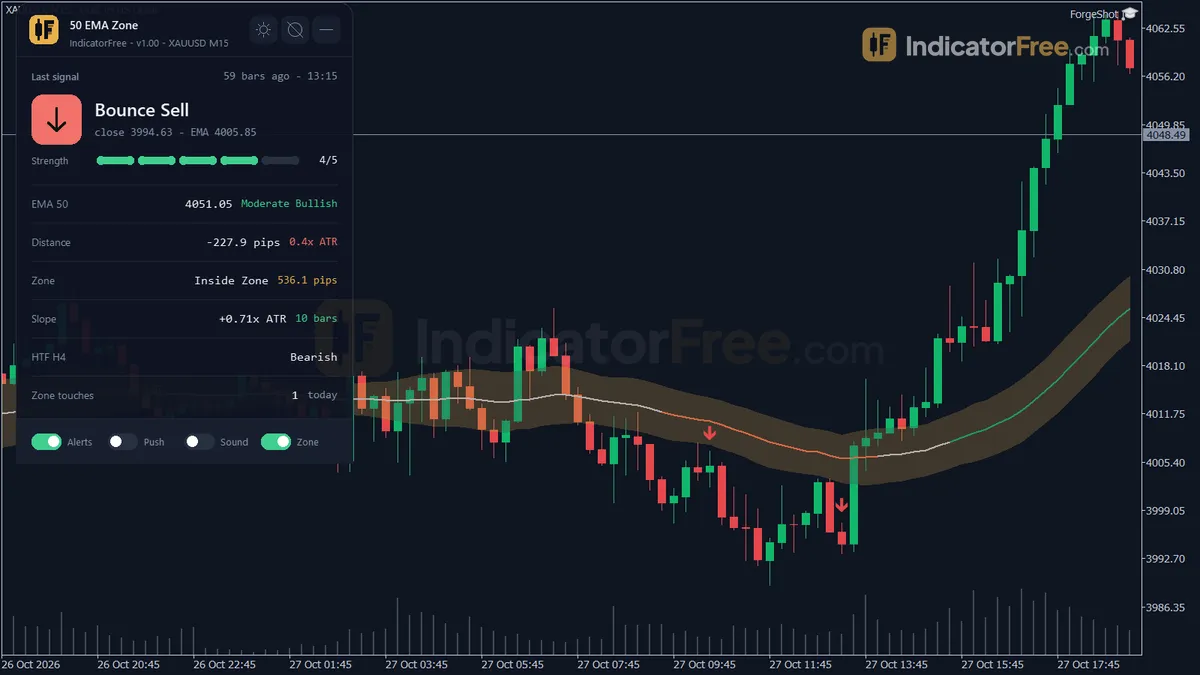
What it draws on your chart
An EMA (exponential moving average) is an average of price that gives more weight to recent bars. The 50-period EMA is a common trend reference. The indicator adds four things around it:
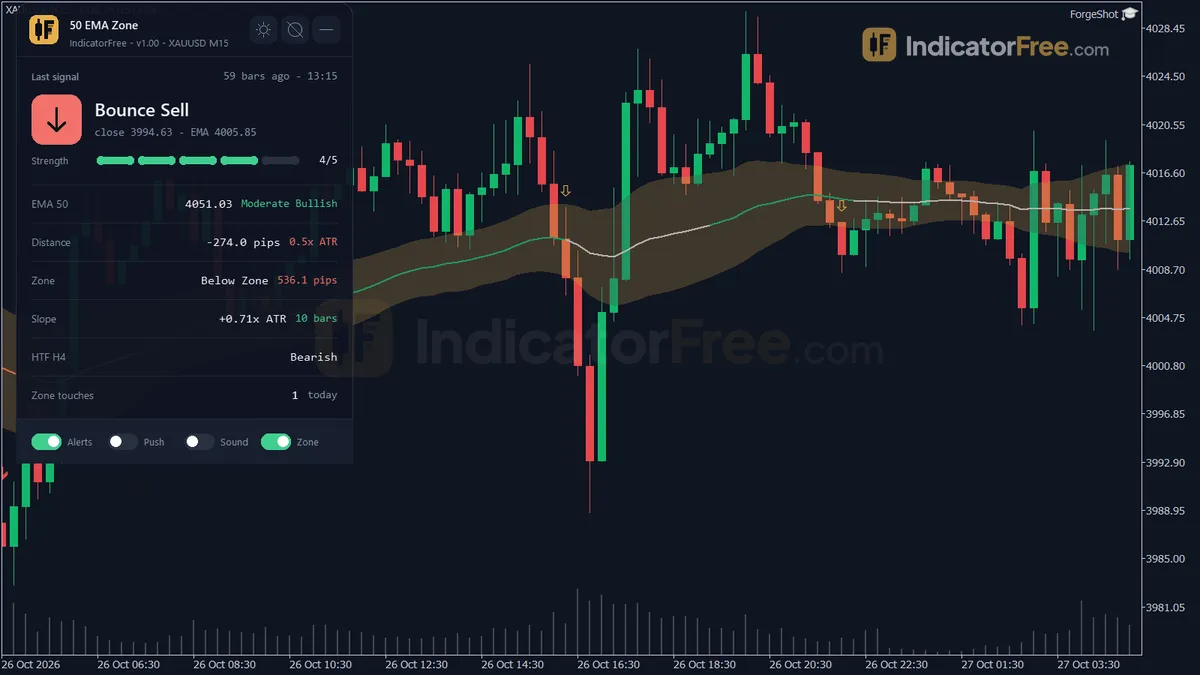
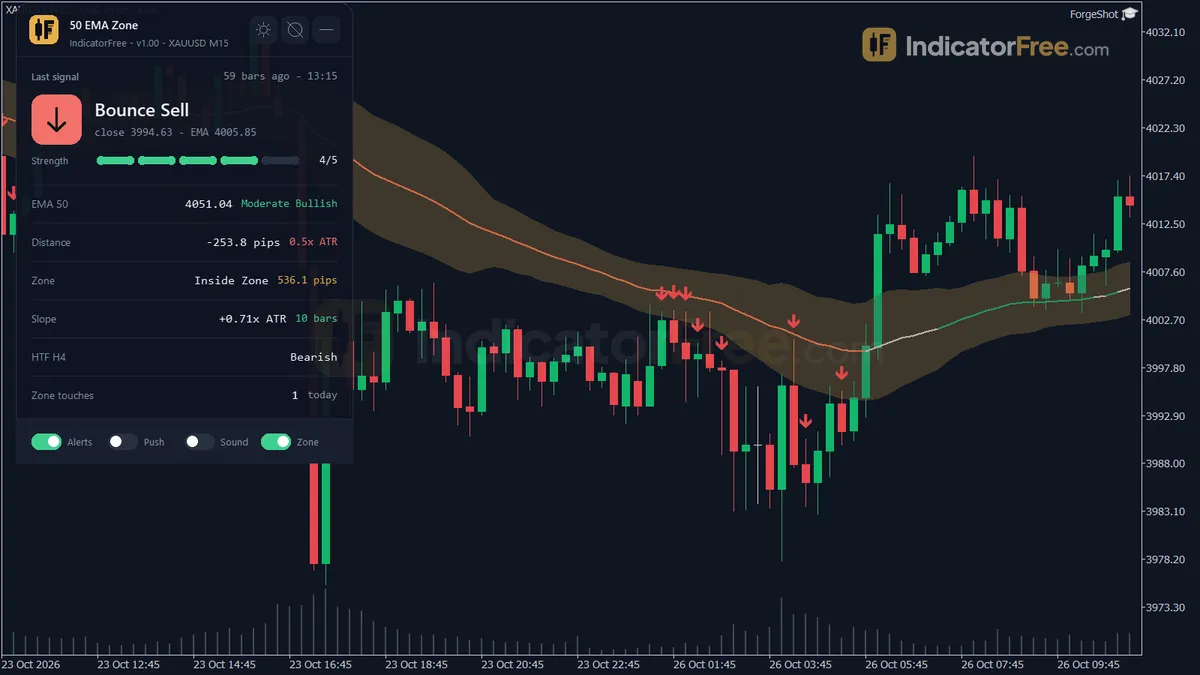
- EMA 50 line: coloured Flat, Moderate or Strong, Bullish or Bearish, based on how steep the slope is.
- The zone: a Zone Upper and a Zone Lower edge, with a fill between them that you can switch off. The zone's width follows ATR, so it widens when the market is volatile and narrows when it is quiet.
- Four arrows: Bounce Buy, Bounce Sell, Break Up and Break Down. Each one is drawn only after its bar closes.
- Status panel: shows the last signal and its strength, the EMA value and trend bias, the distance from price to the EMA in pips and in ATR, the zone position and width, the EMA slope, the higher-timeframe bias and how many times price touched the zone today.
The indicator draws in the main chart window, not in a subwindow. Version 1.00, 142.7 KB.
How the Lab tested it
The Lab ran it on MT5 build 6230 on 2026-10-09. The test used EURUSD M15 from 2026-07-09 to 2026-10-08, with real ticks from Raw Trading Ltd. The Lab logged every arrow as it appeared, then checked it again later.
- 234 signals logged, 0 changed. No arrow moved or disappeared after its bar closed.
- Maximum arrow delay: 0 bars. Each arrow appeared on the bar that triggered it, not on a later bar.
In this test (EURUSD M15, real ticks), the arrows on past bars matched the ones shown live.
What the signal numbers mean
For each arrow, the Lab checked which came first: a move of 1 ATR in the signal's direction, or 1 ATR against it. The chart below shows the results by signal type.
Taken together, the arrows are a coin flip. The two Bounce signals did slightly better than a coin flip. Break Down came out exactly even. Break Up did clearly worse: about two of every three Break Up arrows moved 1 ATR the wrong way first.
In practice, treat the Bounce arrows as a structured way to time trend pullbacks, used together with your own filter. Do not treat them as a stand-alone entry system. Across all four arrows, the test produced 17.8 signals per week on EURUSD M15.
How it works
- 1Calculates the EMA of the chosen price and a zone around it sized by ATR, at least 5 points wide.
Zone = EMA +/- ZoneAtrMult x ATRInputs: EmaPeriod, EmaAppliedPrice, ZoneAtrPeriod, ZoneAtrMult - 2Measures EMA slope over the lookback in ATR units and colours the line flat, up or down.
Slope = (EMA - EMA lookback bars ago) / ATRInputs: SlopeLookbackBars, SlopeFlatThreshold, SlopeStrongThreshold - 3Bounce buy: rising slope, prior bar dipped into the zone, close above it. Bounce sell mirrors with a falling slope.
Buy if slope >= flat, previous Low <= zone top, Close > zone topInputs: EnableBounceSignals - 4Break signal: a close crosses the zone against the slope direction, having been on the other side the bar before.
Break up if slope <= -flat, Close > zone top, previous Close <= zone topInputs: EnableBreakSignals - 5Bounce signals need higher timeframe EMA bias to agree. Strength is 1 to 5 from slope, distance and bias.Inputs: UseHtfFilter, HtfTimeframe
Specifications
- Platform
- MetaTrader 5
- Version
- 1.00
- Type
- Indicator
- Window
- Main chart
- Draws
- 3 lines, 4 arrows, 1 panel
- Alerts
- popup, push, sound
- Repaints
- No (0 of 234 signals changed)
- Inputs
- 19
- Tested on
- MT5 build 6230 · 2026-10-09
Repaint test
No repaint detected. In a 9 Jul 2026 – 8 Oct 2026 test on EURUSD M15 (Raw Trading Ltd real ticks), 234 signals were logged at bar close and re-read at the end of the test: 0 changed. Arrows print on the bar that closes the signal, with no delay.
IndicatorFree — tested 2026-10-09 · MT5 build 6230 · Raw Trading Ltd real ticks. Results come from historical data, not live trading, and do not guarantee future results.
Signal statistics
Over 9 Jul 2026 – 8 Oct 2026 on EURUSD M15, the indicator printed 234 arrows. After 49.6% of them, price moved 1×ATR(14) in the arrow's direction before moving 1×ATR against it (median 2 bars). 0% reached neither level within 20 bars.
This measures price movement after the arrow, not a trading result. It includes no spread, commission, stop loss or position sizing.
What it draws
- A line (EMA 50) from buffer 0.
- A line (Zone Upper) from buffer 2.
- A line (Zone Lower) from buffer 3.
- Arrows (Bounce Buy) from buffer 4, drawn on the closed bar.
- Arrows (Bounce Sell) from buffer 5, drawn on the closed bar.
- Arrows (Break Up) from buffer 6, drawn on the closed bar.
- Arrows (Break Down) from buffer 7, drawn on the closed bar.
- An on-chart panel (Status); values shown in the panel are not exposed as buffers.
Inputs
| Input | Default | What it does |
|---|---|---|
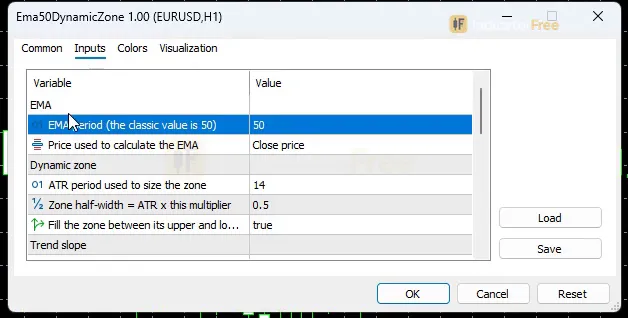
| EmaPeriod | 50 | EMA period (the classic value is 50) |
| EmaAppliedPrice | Close | Price used to calculate the EMA |
| ZoneAtrPeriod | 14 | ATR period used to size the zone |
| ZoneAtrMult | 0.5 | Zone half-width = ATR x this multiplier |
| ShowZone | true | Fill the zone between its upper and lower edges |
| SlopeLookbackBars | 10 | Bars back used to measure the EMA slope |
| SlopeFlatThreshold | 0.3 | Slope below this (in ATR units) = Flat, no bias |
| SlopeStrongThreshold | 1 | Slope at or above this (in ATR units) = Strong trend |
| EnableBounceSignals | true | Show Bounce signals (close back out of the zone with the trend) |
| EnableBreakSignals | true | Show Break signals (close through the zone against the trend) |
| UseHtfFilter | true | Require higher-timeframe bias to agree before a Bounce signal |
| HtfTimeframe | H4 | Higher timeframe for the bias filter (ignored if not above the chart timeframe) |
| AlertPopup | true | Popup alert on a new closed-bar signal |
| AlertPush | false | Push notification on a new closed-bar signal |
| AlertSound | false | Play a sound on a new closed-bar signal |
| Theme | Dark | Chart color theme |
| RestoreTheme | true | Restore the original chart colors when removed |
| PanelCorner | Left Upper | Chart corner for the panel |
| PanelScale | 1 | Panel size multiplier (DPI is applied automatically) |
How to read it
Install: copy the .ex5 file into MQL5\Indicators (File > Open Data Folder), refresh the Navigator and drag 50 EMA Zone onto a chart.
Reading the line and the zone
The zone is calculated as Zone = EMA ± ZoneAtrMult × ATR, and it is never narrower than 5 points. With the defaults, each edge sits half an ATR(14) away from the EMA.
The panel's zone position tells you where the last bar closed relative to the two edges:
- Above Zone: the bar closed above the Zone Upper edge. This is the trigger side for Bounce Buy and Break Up.
- Below Zone: the bar closed below the Zone Lower edge. This is the trigger side for Bounce Sell and Break Down.
- Inside the zone: the bar closed between the two edges. This is not a signal. It only means price is testing the EMA area.
The line's colour comes from the EMA slope: Slope = (EMA − EMA SlopeLookbackBars ago) / ATR.
- A slope smaller than SlopeFlatThreshold (0.3) in either direction counts as Flat.
- A slope of SlopeStrongThreshold (1) or more counts as Strong.
- Anything between the two counts as Moderate.
Because the slope is measured in ATR units, the colours mean the same thing on a quiet pair and on a volatile one.
Bounce Buy and Bounce Sell: pullbacks with the trend
The illustration below shows the shape of a Bounce Buy.
Illustration of a typical signal. On a real chart the EMA and the zone slope with the trend; they are drawn flat here so the shape is easy to see.
- Bounce Buy fires when all of these are true:
- The EMA slope over the lookback is at least SlopeFlatThreshold × ATR.
- The previous bar's low touched the Zone Upper edge.
- The current bar closes back above the Zone Upper edge.
- Bounce Sell is the mirror image. The slope must be at most −SlopeFlatThreshold × ATR, the previous bar's high must touch Zone Lower, and the bar must close back below Zone Lower.
With UseHtfFilter on, a Bounce also needs the higher-timeframe bias to agree. For a buy, that bias must be bullish or neutral; for a sell, bearish or neutral. Each signal gets a strength score from 1 to 5, based on slope, distance and bias. The score is shown in the panel. In the Lab test, Bounce Buy fired about 6.1 times per week and Bounce Sell about 6 times.
Break Up and Break Down: closes against the slope
- Break Up: the slope is bearish (at most −SlopeFlatThreshold × ATR), but the bar closes above Zone Upper after the previous bar closed at or below it.
- Break Down: the slope is bullish, but the bar closes below Zone Lower after the previous bar closed at or above it.
The higher-timeframe filter applies only to Bounce signals, not to Break signals. In the Lab test, Break Up fired about 3.4 times per week and Break Down about 2.3 times.
A common misread: a Break arrow does not confirm that the trend has reversed. When the arrow appears, the EMA is still sloping the other way. The arrow only records one close through the zone against that slope.
Inputs to change first
- ZoneAtrMult (default 0.5) is the main input behind all four arrows. A higher value moves the edges further from the EMA, so a shallower pullback already counts as a touch. A lower value requires price to come closer to the EMA before a touch counts.
- SlopeFlatThreshold (default 0.3) sets the trend-or-not test. Bounce and Break signals both need the slope beyond this value. Raising it treats more bars as Flat, which means fewer arrows.
- HtfTimeframe (default H4) is ignored unless it is higher than your chart's timeframe. On H4 or D1 charts the default H4 filter is switched off; set HtfTimeframe to D1 or W1. The Lab has not tested this, so compare it with the default.
- EnableBounceSignals and EnableBreakSignals turn each pair of arrows on or off.
- EmaPeriod and EmaAppliedPrice change the line itself. The default is a 50-period EMA of the close.
- Theme recolours the chart, and RestoreTheme puts your original colours back when you remove the indicator. PanelCorner and PanelScale control where the panel sits and how large it is.
Alerts
Alerts fire once per new closed-bar signal:
- AlertPopup (on by default) opens the MT5 alert window.
- AlertPush (off by default) sends a notification to the MT5 mobile app linked in your terminal's notification settings.
- AlertSound (off by default) plays a sound in the terminal.
A decision rule for each arrow
Starting rules the Lab has not tested:
- Bounce Buy or Bounce Sell: take it only if the panel shows the higher-timeframe bias on the same side, not just neutral. Skip it if the EMA colour has been switching between Flat and Moderate over recent bars.
- Break Down: treat it as a warning to close or tighten existing longs, not as a new short. In the Lab test, Break Down moved 1 ATR in its direction first in 50.0% of signals.
- Break Up: do not trade it unless another tool confirms the move. In the Lab test, Break Up moved 1 ATR in its direction first in only 35.6% of signals.
Installation
- 1Download Ema50DynamicZone.ex5 from the button above (Google Drive).
- 2In MetaTrader 5: File → Open Data Folder → MQL5 → Indicators. Copy Ema50DynamicZone.ex5 there.
- 3Restart MT5 or right-click Indicators in Navigator → Refresh.
- 4Drag 50 EMA Zone onto a chart. For push alerts, enable "Allow push notifications" under Tools → Options → Notifications.
- Tested on MT5 build 6230.
Key terms and guides
- 50 EMA
- The 50 EMA is an exponential moving average of the last 50 candle closes, with more weight on recent prices. Traders use the line to judge trend direction and as a moving level where pullbacks often stall.
- Average True Range
- Average True Range (ATR) is a volatility indicator that shows how far price typically moves per candle, gaps included, averaged over a set number of candles. It measures the size of moves, not their direction.
- Order Fill
- An order fill is the moment your buy or sell order is actually executed: it is matched at a real price and opens (or closes) a position, for the full size or only part of it.
- Every tick based on real ticks
- Every tick based on real ticks is the MT5 Strategy Tester mode that replays the actual bid and ask ticks your broker recorded, with the real changing spread, instead of ticks the tester invents from 1-minute bars.
- Pullback
- A pullback is a short, temporary move against the main trend: price dips during an uptrend or rallies during a downtrend, then turns back the trend's way. Traders use it to enter a trend at a better price.
- Exponential moving average
- The exponential moving average (EMA) is a moving average that gives the newest closes the most weight, so it turns sooner than a simple moving average. Traders use it to read trend direction and to time entries on pullbacks.
More on this subject: Supply, demand & key levels guide, terms and tools
User reviews
No reviews yet. Members who download the tool can review it here.
Sign in and download the tool to review it.
Build a checklist with it
50 EMA Zone does one job on the chart: zone / level. Put it on the same chart as the tools below and the IndicatorFree panels merge into one checklist card, ordered trend, zone, signal, risk.
- Trend / contextKijun Sen LineAdds the trend side: which way the market leans before you act on 50 EMA Zone.
- Entry signalBreakout ConfirmationAdds the entry signal: the moment to act once 50 EMA Zone has set the scene.
The Lab has not tested these combinations. Each tool is tested on its own; the card only lines up what each one says. Free members get 2 new tools a day. If one has to wait until tomorrow, install BlackBox to raise the limit to 5 a day (20 on a live account).
FAQ
Does 50 EMA Zone repaint?
No repaint detected. In a 9 Jul 2026 – 8 Oct 2026 test on EURUSD M15 (Raw Trading Ltd real ticks), 234 signals were logged at bar close and re-read at the end of the test: 0 changed. Arrows print on the bar that closes the signal, with no delay.
Can I use 50 EMA Zone in an EA?
Yes. Read buffer 4 (Bounce Buy) with iCustom() on bar 1 — the last closed bar.
Why can’t my EA read the zones?
Zones and the panel are chart objects, not indicator buffers, so iCustom() does not return them.
How do I get alerts on my phone?
Enter your MetaQuotes ID under Tools → Options → Notifications, tick "Enable push notifications", and keep the push alert input on.
Does it work on other pairs?
Tested on EURUSD only; other symbols not tested.
Which timeframe should I use 50 EMA Zone on?
The Lab measured it on M15 only, so that is the only timeframe with test numbers. It runs on any timeframe; on H4 or D1, adjust HtfTimeframe first.
Does it work on XAUUSD, indices or crypto?
It runs on any MT5 symbol, and because the zone and slope are measured in ATR, it adjusts to each instrument's volatility. The Lab has only tested it on EURUSD, so check the arrows on your own symbol's history before you rely on them.
Why am I not getting any Bounce arrows?
There are three common reasons. The EMA slope may be Flat (below SlopeFlatThreshold), the higher-timeframe bias may disagree while UseHtfFilter is on, or EnableBounceSignals may be off. The panel shows the slope and the higher-timeframe bias, so check those first.
Can I use it with a 20 or 200 EMA instead of 50?
Yes. Change EmaPeriod and the line, zone and signals all recalculate. The Lab numbers apply only to the default 50-period setting.
Can I get alerts on my phone?
Yes. Set AlertPush to true and link the MT5 mobile app in your terminal's notification settings. Popup alerts are on by default, sound is off, and every alert fires only once the signal's bar has closed.
Changelog
- 1.00Initial release: 50-period EMA (adjustable) with an ATR-sized dynamic zone, ATR-normalized slope coloring (Flat/Moderate/Strong Bullish/Bearish), closed-bar Bounce and Break signals with popup/push/sound alerts,. · 2026-10-09
Final verdict
Where it earns its place
The tool turns the vague idea of "buying a pullback to the 50 EMA" into a fixed, closed-bar rule, and it adjusts that rule to volatility through ATR.
You find out fast: the median signal reached 1 ATR, for or against, in 2 bars (3 for Bounce Buy), and none were still undecided after 20 bars. On M15, that is about 30–45 minutes.
Where it falls short
- It does not give you an edge on its own. Even the best signal type was only slightly better than a coin flip, so you still need your own filter and your own exit.
- It does not draw stops or targets and does not tell you how much to risk.
- It goes quiet in sideways markets. Bounce and Break signals both need a non-flat slope, so in ranges you will see the zone but few arrows. A 50-period EMA also reacts late to fast reversals.
- It has been tested on one setup only. The Lab tested EURUSD M15. Gold, indices, other pairs and other timeframes have not been measured.
Settings to start with
Keep the defaults on M15. If you only trade with the trend, set EnableBreakSignals to false. Break Up was the weakest arrow in the Lab test, and Break signals are not checked against the higher-timeframe filter. On H4 or D1 charts, raise HtfTimeframe as described under the inputs.
- –You trade pullbacks in an established trend
- –You want a closed-bar rule for what touching the EMA means
- –You will add your own filter and your own stop/target
- –You can wait for higher-timeframe bias to agree
- –You want an arrow you can trade with no other check
- –You mainly trade ranges and consolidation
- –You want early reversal entries from Break Up arrows
- –You need test results on a symbol other than EURUSD
An idea to pair it with
A Bounce arrow that forms where a scored support or resistance level from Key Level Map also sits gives you two separate reasons for the same pullback. This is an idea to try, not a Lab result: the Lab has not tested the pair.