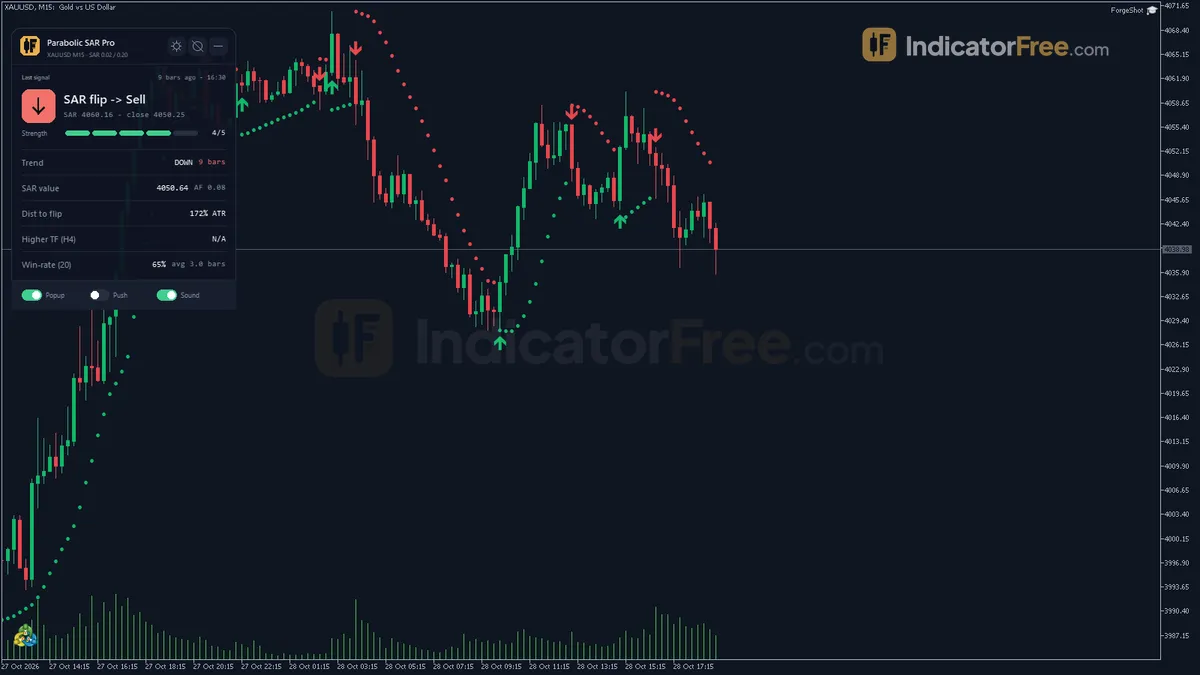
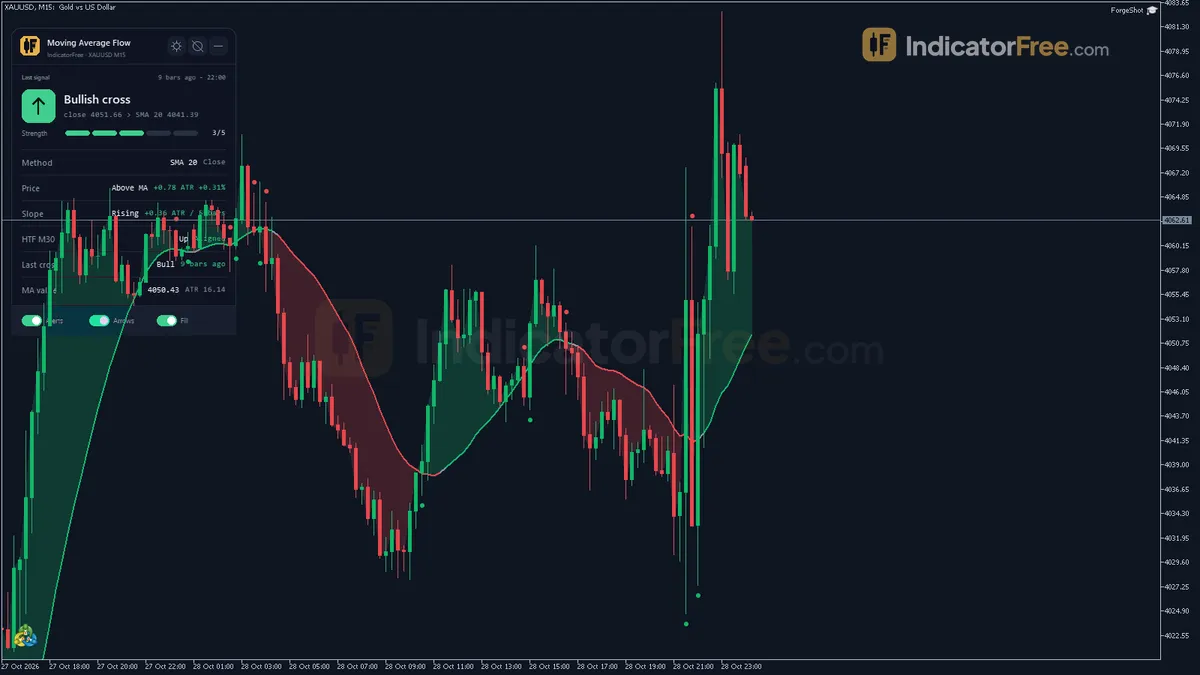
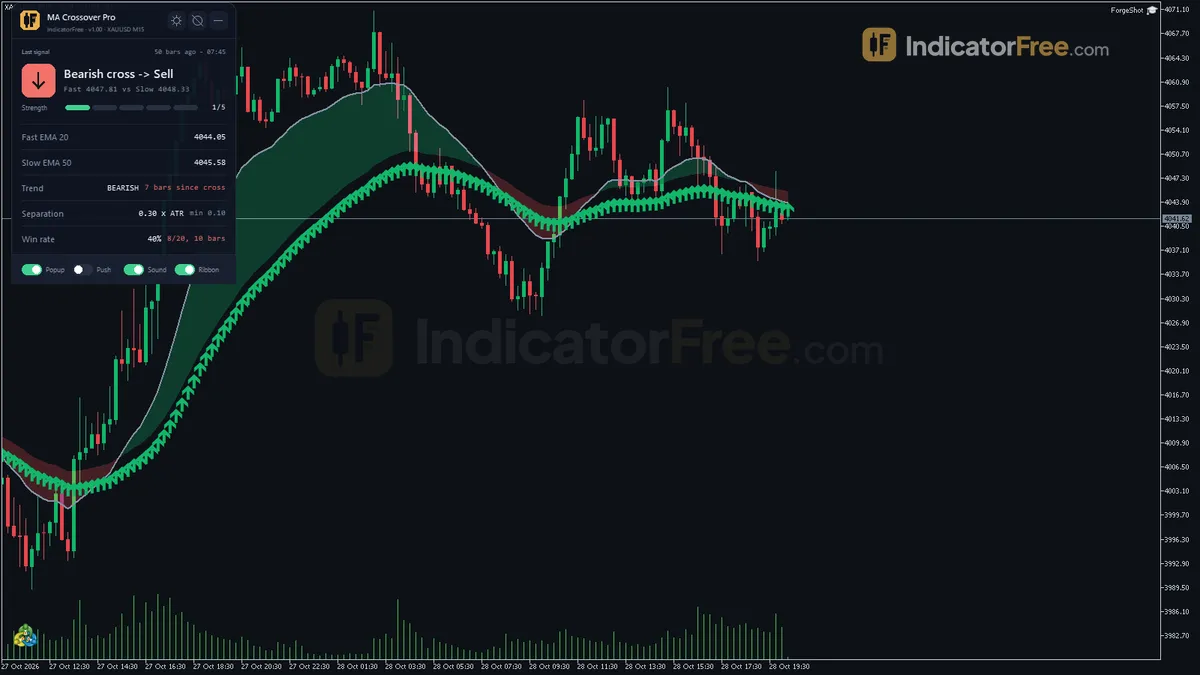
Kijun Sen Line
Free Kijun Sen Line indicator for MT5: slope-colored Kijun-sen, pullback, trend-break and TK cross arrows. Lab repaint test: 0 of 855 signals changed.
- Repainted
- 0 / 855
- Signals / week
- ≈ 65
- Tested on
- EURUSD M15
- Tested
- 2026-10-09
Overview
Kijun Sen Line draws the Ichimoku Kijun-sen on your MT5 price chart and colors it by slope. It adds pullback, trend-break and Tenkan/Kijun cross arrows, plus a status panel. In the Lab's repaint test on EURUSD M15, 0 of 855 signals changed after their bar closed. It is for trend traders who want one clear bias line and a set moment to join a trend that is already running, but it is not a stand-alone entry system.
The Kijun-sen in two sentences
The Kijun-sen is the baseline of Ichimoku Kinko Hyo: the midpoint between the highest high and the lowest low of the last 26 bars (Line = (Highest high + Lowest low) / 2). Because it is built from a price range and not from an average, it stays flat while price moves inside that range and steps when a new high or low enters it.
What it draws on your chart
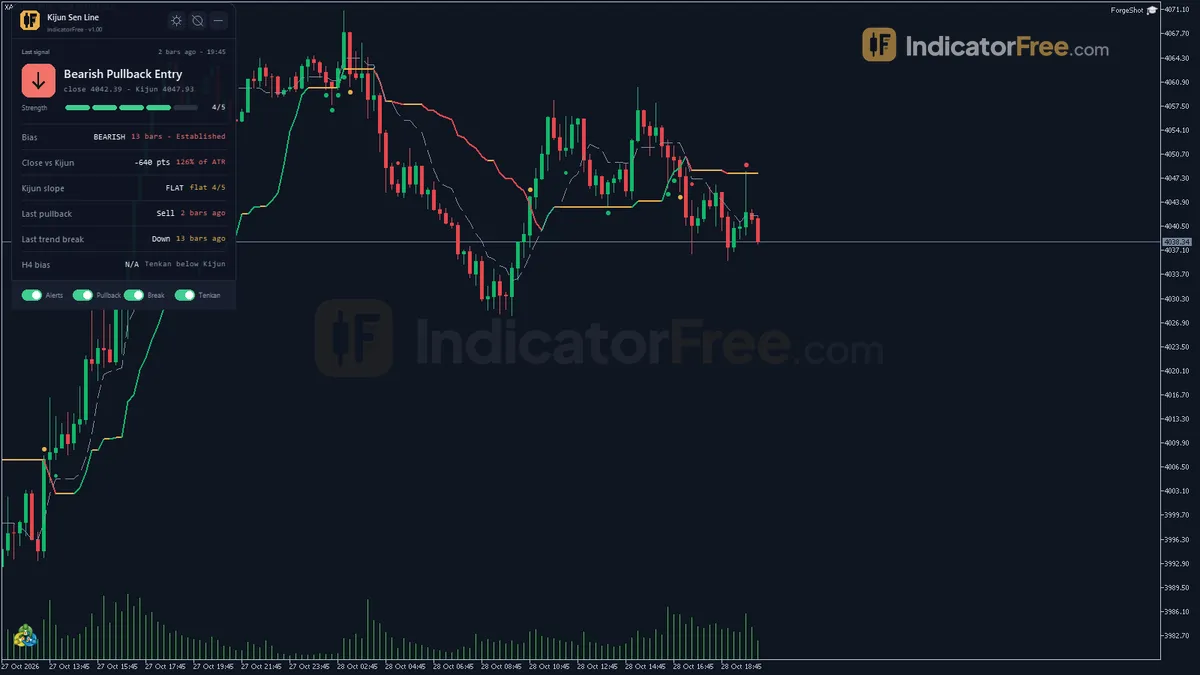
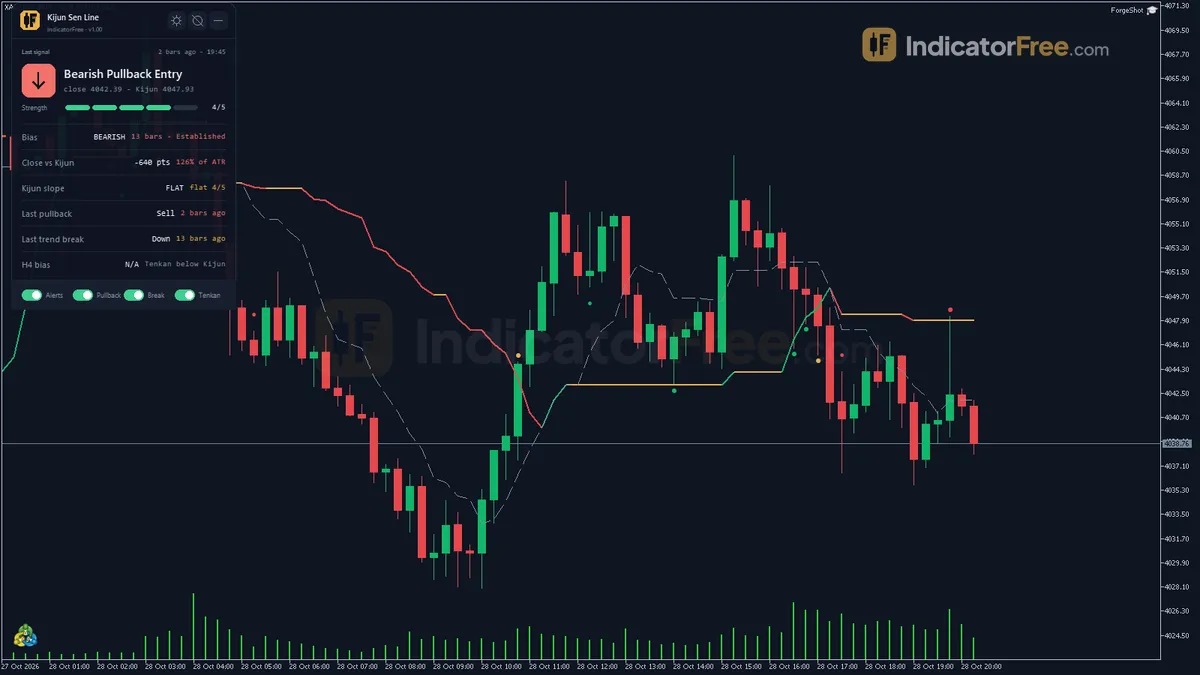
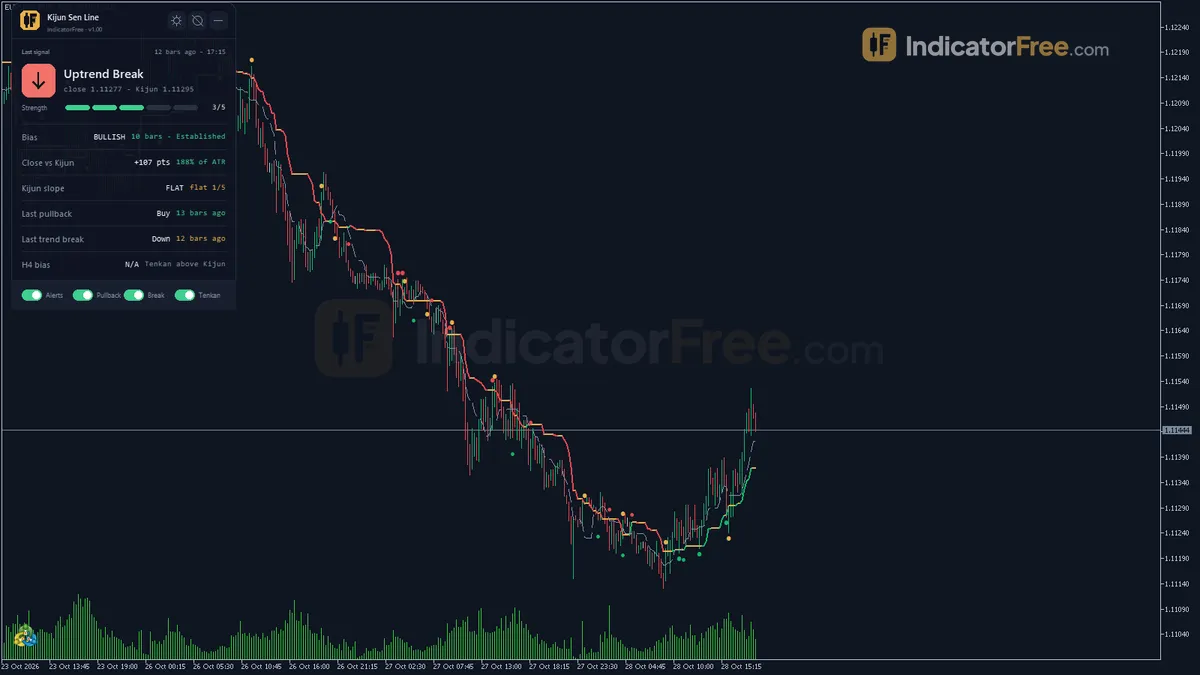
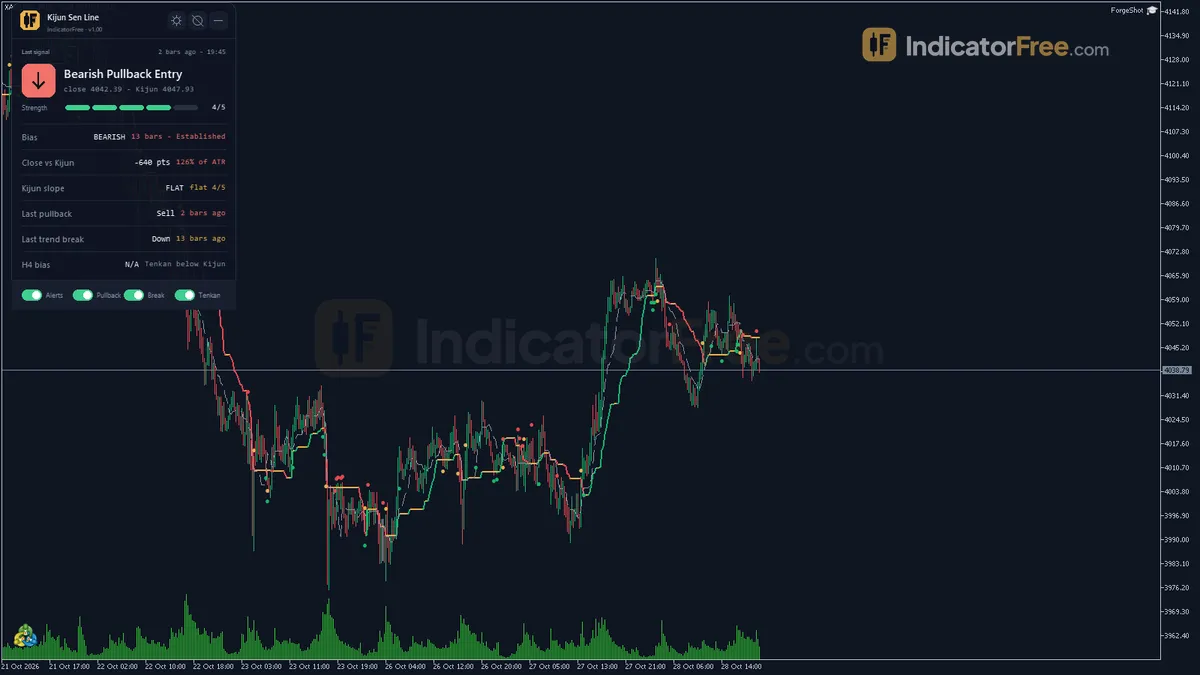
- Kijun-sen line (main window, no subwindow). It changes color with its slope in green, red or gold. The color follows the slope; the panel names the slope state and counts flat bars.
- Tenkan-sen line, the faster 9-bar midpoint. It is optional and used for cross signals.
- Six signal marks: Bullish Pullback, Bearish Pullback, Bullish TK Cross, Bearish TK Cross, Downtrend Break and Uptrend Break. Trend Breaks are drawn as X marks.
- Status panel, a text summary of the line, the trend and the latest event.
The chart below shows a pullback mark and a break mark against a Kijun-sen drawn flat for clarity. It is a drawing, not real data.
What the Lab measured and what it means for you
The Lab ran version 1.00 on EURUSD M15 from 2026-07-09 to 2026-10-08, using Raw Trading Ltd real ticks.
- Repaint test: 0 of 855 logged signals changed, and the maximum arrow delay was 0 bars. An arrow you see on history is the arrow you would have had live, on the bar it marks.
- 1 ATR first: across all 855 signals, 48.9% reached 1 ATR in the arrow's direction before 1 ATR against it. That is a coin flip. On their own, the arrows give you no edge. Their value is in the context they add to your own decisions.
- Speed: the median signal reached one side in 2 bars, which is about 30 minutes on M15. Only 2.1% hit neither side within 20 bars. Each signal resolves quickly, so manage the trade on the next few bars, not hours later.
- Frequency: 65 signals a week across all six types with every signal switched on. Expect a busy chart unless you turn some off.
How it works
- 1Kijun is the midpoint of the highest high and lowest low over its period. Tenkan uses its own period.
Line = (Highest high + Lowest low) / 2Inputs: KijunPeriod, ShowTenkan, TenkanPeriod - 2Slope is up, down or flat by change from the previous bar, and flat bars in a row are counted.Inputs: FlatBarsThreshold
- 3Bias is bullish when the close is above Kijun and bearish below. On the line keeps the previous bias.
- 4After enough trend bars: pullback arrows when price touches Kijun and closes on trend side, break arrows when bias flips.Inputs: TrendConfirmBars, ShowPullbackSignals, ShowTrendBreakSignals
- 5Adds Tenkan-Kijun cross arrows and a higher timeframe bias from the same Kijun test.Inputs: HigherTFContext
Specifications
- Platform
- MetaTrader 5
- Version
- 1.00
- Type
- Indicator
- Window
- Main chart
- Draws
- 2 lines, 6 arrows, 1 panel
- Alerts
- popup, push, sound
- Repaints
- No (0 of 855 signals changed)
- Inputs
- 16
- Tested on
- MT5 build 6230 · 2026-10-09
Repaint test
No repaint detected. In a 9 Jul 2026 – 8 Oct 2026 test on EURUSD M15 (Raw Trading Ltd real ticks), 855 signals were logged at bar close and re-read at the end of the test: 0 changed. Arrows print on the bar that closes the signal, with no delay.
IndicatorFree — tested 2026-10-09 · MT5 build 6230 · Raw Trading Ltd real ticks. Results come from historical data, not live trading, and do not guarantee future results.
Signal statistics
Over 9 Jul 2026 – 8 Oct 2026 on EURUSD M15, the indicator printed 855 arrows. After 48.9% of them, price moved 1×ATR(14) in the arrow's direction before moving 1×ATR against it (median 2 bars). 2.1% reached neither level within 20 bars.
This measures price movement after the arrow, not a trading result. It includes no spread, commission, stop loss or position sizing.
What it draws
- A line (Kijun-sen) from buffer 0.
- A line (Tenkan-sen) from buffer 2.
- Arrows (Bullish Pullback) from buffer 3, drawn on the closed bar.
- Arrows (Bearish Pullback) from buffer 4, drawn on the closed bar.
- Arrows (Bullish TK Cross) from buffer 5, drawn on the closed bar.
- Arrows (Bearish TK Cross) from buffer 6, drawn on the closed bar.
- Arrows (Downtrend Break) from buffer 7, drawn on the closed bar.
- Arrows (Uptrend Break) from buffer 8, drawn on the closed bar.
- An on-chart panel (Status); values shown in the panel are not exposed as buffers.
Inputs
| Input | Default | What it does |
|---|---|---|
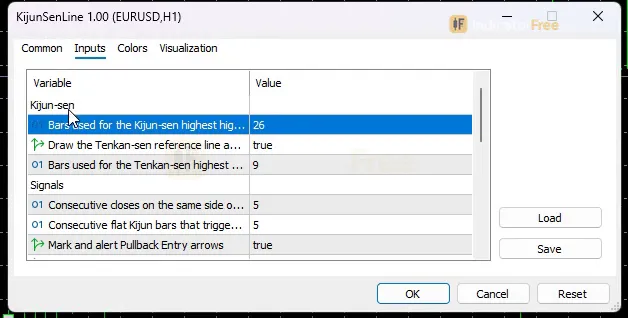
| KijunPeriod | 26 | Bars used for the Kijun-sen highest high / lowest low midpoint (2-200) |
| ShowTenkan | true | Draw the Tenkan-sen reference line and detect Tenkan / Kijun crosses |
| TenkanPeriod | 9 | Bars used for the Tenkan-sen highest high / lowest low midpoint (2-100) |
| TrendConfirmBars | 5 | Consecutive closes on the same side of the Kijun-sen that make the trend established (3-20) |
| FlatBarsThreshold | 5 | Consecutive flat Kijun bars that trigger the Flat / Kink alert, once per flat run (3-15) |
| ShowPullbackSignals | true | Mark and alert Pullback Entry arrows |
| ShowTrendBreakSignals | true | Mark and alert Trend Break X marks |
| HigherTFContext | H4 | Higher timeframe whose Kijun bias is shown on the panel (Current = off) |
| EnablePopupAlert | true | Show a popup alert on a new signal |
| EnablePushAlert | false | Send a push notification to the MT5 mobile app on a new signal |
| EnableSoundAlert | false | Play a sound on a new signal |
| SoundFileName | alert.wav | Sound file in the MT5 Sounds folder |
| ShowDashboard | true | Show the status panel |
| PanelScale | 1 | Panel size multiplier (DPI is applied automatically) |
| Theme | Dark | Chart color theme |
| RestoreTheme | true | Restore the original chart colors when the indicator is removed |
How to read it
Install in one line
Copy the 151.4 KB .ex5 file into MT5's MQL5/Indicators folder, refresh the Navigator and drag Kijun Sen Line onto a chart.
Read the line and the bias first
Every signal depends on the trend bias. A close above the Kijun-sen sets a bullish bias, and a close below sets a bearish bias. A close exactly on the line keeps the bias you already had. Only closed bars count.
The bias starts as Forming. It becomes Established after TrendConfirmBars closes in a row on the same side (default 5). Pullback and Trend Break marks only fire from an established bias. The panel shows the bias, how many bars it has lasted and whether it is Forming or Established.
The slope is up, down or flat depending on how the Kijun-sen changed from the previous bar. The panel counts flat bars in a row.
Pullback arrows: rejoining an established trend
This flow shows how a Bullish Pullback forms. The bearish version is the mirror image: a close below the line, and a Kijun-sen that is not sloping up.
- 1Bias establishedBullish bias has held for at least TrendConfirmBars bars
- 2Price returns to the lineThe closed bar's high-low range touches the Kijun-sen
- 3Close on the trend sideThat bar closes above the Kijun-sen
- 4Slope checkThe Kijun-sen is not sloping down
- 5Arrow on the closed barBullish Pullback is drawn and the alert fires
On EURUSD M15 the Lab logged 8.2 Bullish and 8.5 Bearish Pullbacks a week.
Decision rule (your own filter, not a Lab result): take a Pullback only when the panel's higher-timeframe Kijun bias points the same way. Skip it when the panel's flat count keeps rising, because a flat line still passes the slope check.
Trend Break X marks: the old trend has ended
A Downtrend Break fires when an established bearish bias ends because a closed bar closes above the Kijun-sen. An Uptrend Break is the mirror image. The Lab logged 11.2 Downtrend Breaks and 11.9 Uptrend Breaks a week.
Decision rule: treat an X mark as a reason to tighten or close a trade in the old direction. Don't treat it as a reversal entry. The new bias only starts at Forming.
TK Cross arrows and the misread to avoid
A Bullish TK Cross fires when the Tenkan-sen was at or below the Kijun-sen on the previous closed bar and is above it on the signal bar. The bearish cross is the reverse. These are the most frequent marks: 12.5 and 12.7 a week.
The common misread is to treat every TK cross as a trend change. Unlike Pullbacks and Breaks, a cross has no bias or slope condition, so it can fire against the current bias while price chops around the line. You can spot this when the cross arrow points one way and the panel's bias points the other. Decision rule: act on a TK cross only in the direction of the current established bias.
The status panel
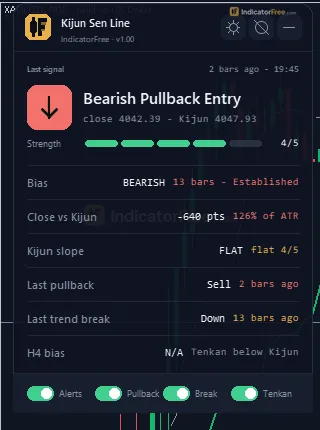
The panel shows:
- the last event (pullback, trend break, TK cross or flat)
- the current bias with its bar count and its Forming or Established state
- the close's distance from the Kijun-sen in points and as a % of ATR
- the Kijun slope with its flat count
- the higher-timeframe Kijun bias
Use the distance read-out to avoid chasing. When the close is far from the line in ATR terms, wait for a pullback instead of entering late.
Inputs to change first
TrendConfirmBars(default 5, range 3-20) decides how long a trend must last before Pullbacks and Breaks can fire. Higher values give fewer, later signals.ShowTenkan(default true) controls the Tenkan line and the TK cross arrows. Set it to false to drop the TK cross arrows (about 25 of the 65 weekly marks).ShowPullbackSignals/ShowTrendBreakSignals(default true) turn each signal family on or off, including its alerts.HigherTFContext(default H4) sets the timeframe whose Kijun bias appears on the panel. Choose Current to turn it off.KijunPeriod(default 26, range 2-200) andTenkanPeriod(default 9, range 2-100) change the lines themselves. The Lab results apply only to the defaults.ShowDashboard,PanelScale(default 1, DPI applied automatically),Theme(default Dark) andRestoreTheme(default true, which puts your chart colors back when you remove the indicator) control the display.
Alerts
A new signal triggers a popup alert in MT5 (EnablePopupAlert, on by default). You can also send a push notification to the MT5 mobile app (EnablePushAlert) or play a sound (EnableSoundAlert, with SoundFileName set to a file in the MT5 Sounds folder, default alert.wav). Push and sound are off by default.
Installation
- 1Download KijunSenLine.ex5 from the button above (Google Drive).
- 2In MetaTrader 5: File → Open Data Folder → MQL5 → Indicators. Copy KijunSenLine.ex5 there.
- 3Restart MT5 or right-click Indicators in Navigator → Refresh.
- 4Drag Kijun Sen Line onto a chart. For push alerts, enable "Allow push notifications" under Tools → Options → Notifications.
- Tested on MT5 build 6230.
Key terms and guides
- Ichimoku cloud
- The Ichimoku cloud (Ichimoku Kinko Hyo) is a trend indicator built from five lines. The shaded band between two of them, the cloud, shows trend direction and nearby support or resistance in one view.
- Uptrend
- An uptrend is a market where price keeps making higher highs and higher lows: each rally peaks above the last one, and each pullback stops above the previous low.
- Kijun-sen
- Kijun-sen is the base line of the Ichimoku Kinko Hyo indicator: the midpoint between the highest high and lowest low of the last 26 candles. Traders use it to read the medium-term trend and as a pullback level for entries and stops.
- Average True Range
- Average True Range (ATR) is a volatility indicator that shows how far price typically moves per candle, gaps included, averaged over a set number of candles. It measures the size of moves, not their direction.
- Every tick based on real ticks
- Every tick based on real ticks is the MT5 Strategy Tester mode that replays the actual bid and ask ticks your broker recorded, with the real changing spread, instead of ticks the tester invents from 1-minute bars.
- Pullback
- A pullback is a short, temporary move against the main trend: price dips during an uptrend or rallies during a downtrend, then turns back the trend's way. Traders use it to enter a trend at a better price.
More on this subject: Trend & moving averages guide, terms and tools
User reviews
No reviews yet. Members who download the tool can review it here.
Sign in and download the tool to review it.
Build a checklist with it
Kijun Sen Line does one job on the chart: trend / context. Put it on the same chart as the tools below and the IndicatorFree panels merge into one checklist card, ordered trend, zone, signal, risk.
- Zone / levelLiquidity MapAdds where price is: the zones and levels that Kijun Sen Line does not draw.
- Entry signalReversion Z-ScoreAdds the entry signal: the moment to act once Kijun Sen Line has set the scene.
The Lab has not tested these combinations. Each tool is tested on its own; the card only lines up what each one says. Free members get 2 new tools a day. If one has to wait until tomorrow, install BlackBox to raise the limit to 5 a day (20 on a live account).
FAQ
Does Kijun Sen Line repaint?
No repaint detected. In a 9 Jul 2026 – 8 Oct 2026 test on EURUSD M15 (Raw Trading Ltd real ticks), 855 signals were logged at bar close and re-read at the end of the test: 0 changed. Arrows print on the bar that closes the signal, with no delay.
Can I use Kijun Sen Line in an EA?
Yes. Read buffer 3 (Bullish Pullback) with iCustom() on bar 1 — the last closed bar.
Why can’t my EA read the zones?
Zones and the panel are chart objects, not indicator buffers, so iCustom() does not return them.
How do I get alerts on my phone?
Enter your MetaQuotes ID under Tools → Options → Notifications, tick "Enable push notifications", and keep the push alert input on.
Does it work on other pairs?
Tested on EURUSD only; other symbols not tested.
Which timeframes and pairs did the Lab test?
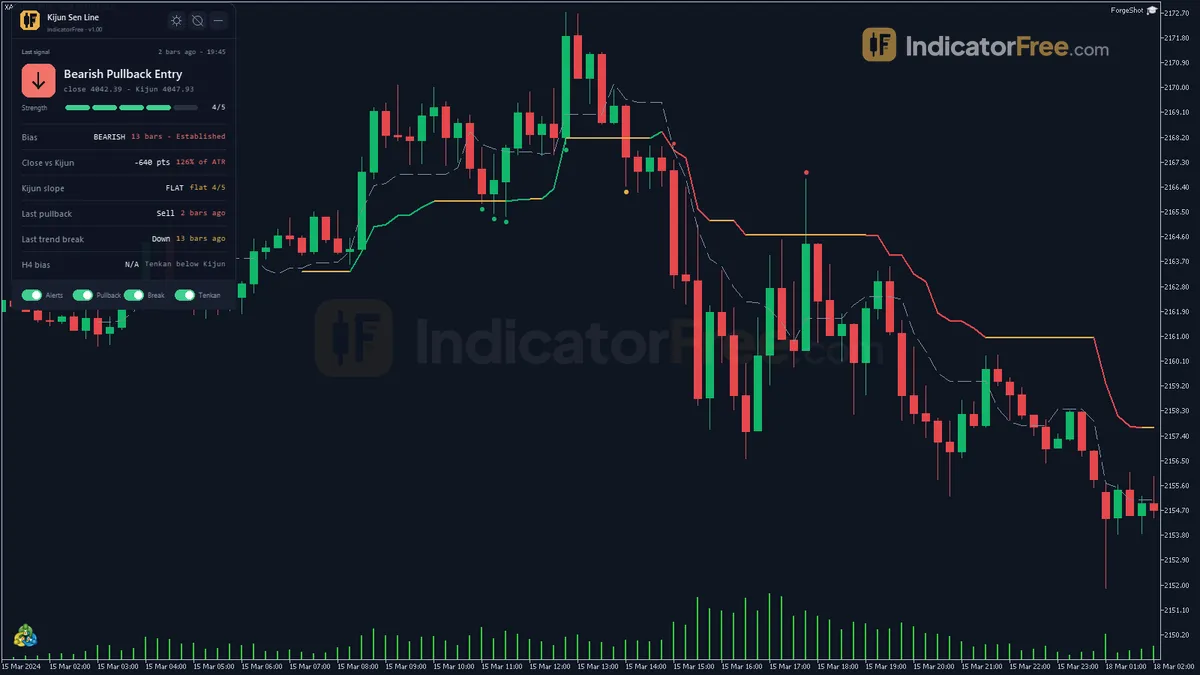
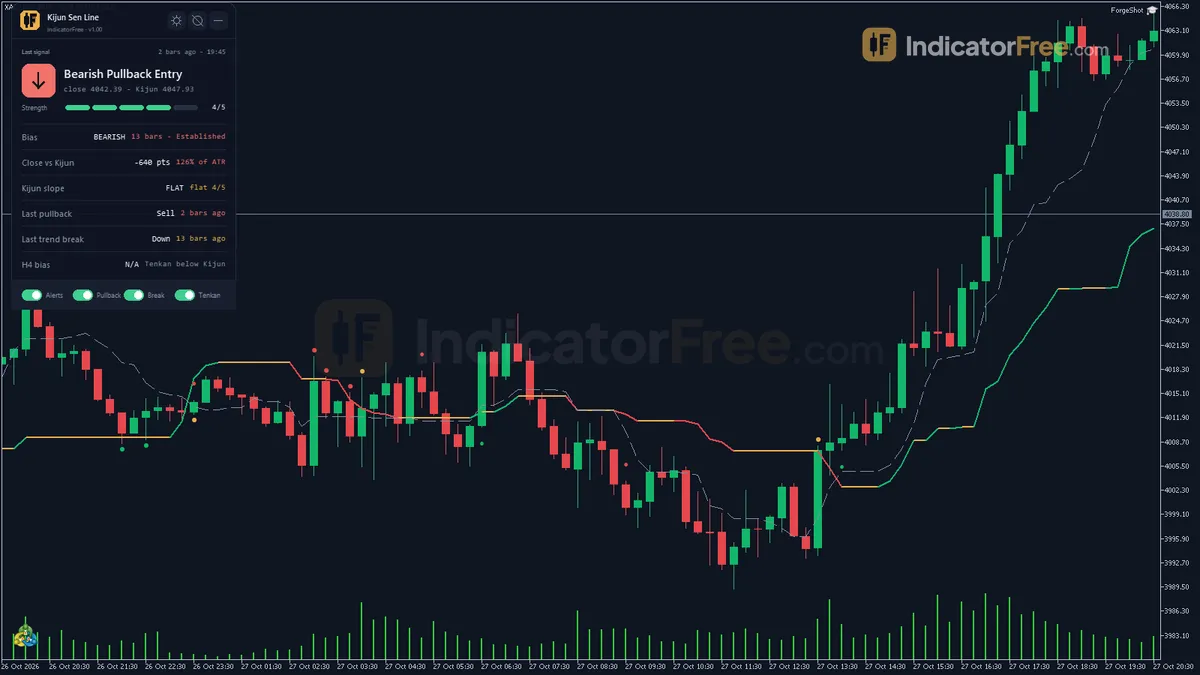
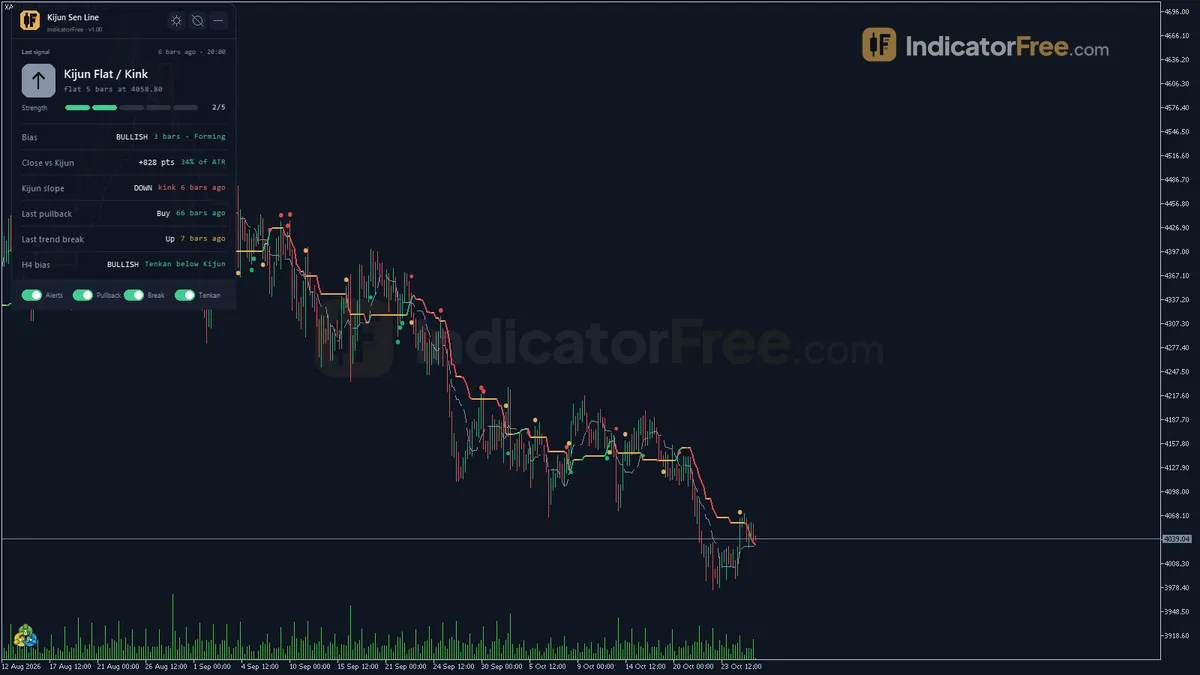
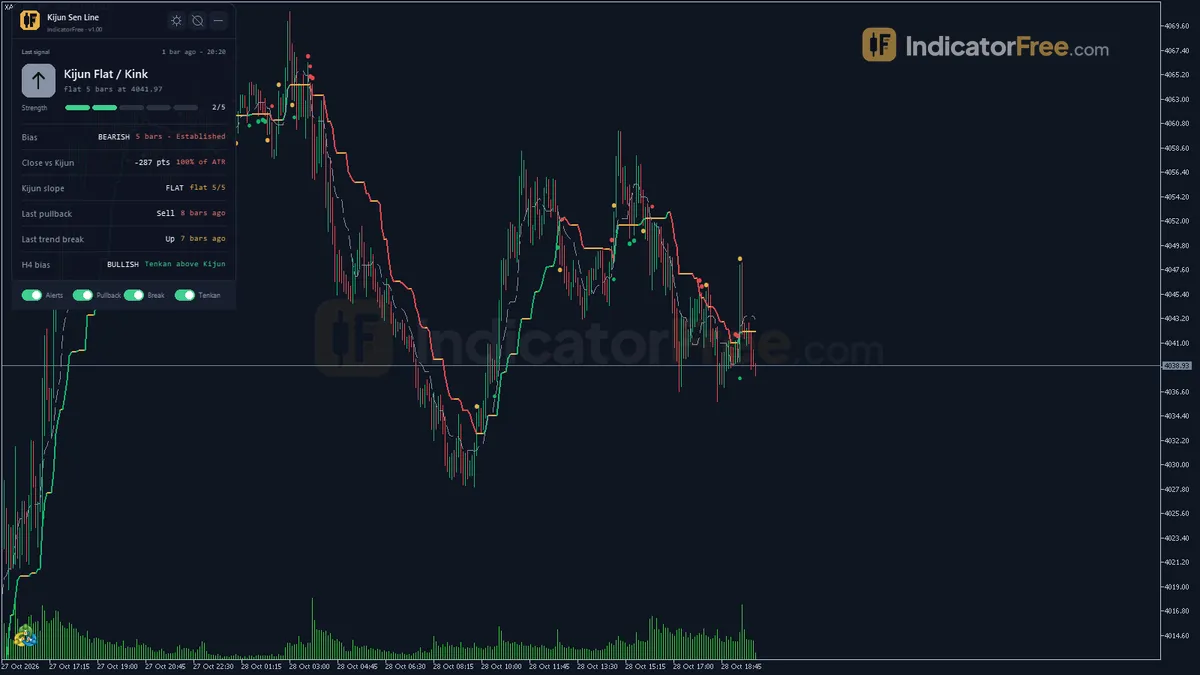
The repaint test and the signal statistics cover EURUSD on M15 only, from 2026-07-09 to 2026-10-08. The H4 and M5 screenshots show how the indicator looks on those charts. They are not test results.
Why didn't an arrow appear when price crossed the Kijun mid-bar?
Every signal is checked on the closed bar, so a cross during the bar counts for nothing until the bar closes on the other side.
What is the Flat / Kink alert?
It fires when the Kijun-sen stays flat for FlatBarsThreshold bars in a row (default 5, range 3-15). It fires only once per flat run. Treat it as a warning that price is inside a range, not as a trade signal.
Which MT5 build and version were tested?
The Lab tested version 1.00 on MT5 build 6230 on 2026-10-09. The file is 151.4 KB.
Changelog
- 1.00Initial release: slope-colored Ichimoku Kijun-sen line (green/red/gold), optional Tenkan-sen reference line, trend-bias tracking with "Forming"/"Established" state, established-trend Pullback Entry arrows, Trend Break. · 2026-10-09
Final verdict
Where it earns its place
The repaint result and the closed-bar logic make this a tool you can trust on history: the arrows you study are the arrows you would have seen live. Its real strength is structure. It turns a well-known baseline into a clear bias, an Established state and a defined pullback moment.
The chart below compares the six signal types on the Lab's EURUSD M15 sample.
Scale zoomed in to show the difference (bars do not start at zero).
The Pullbacks and the Uptrend Break did a little better than the rest, but the spread between types is small. The weakest were the Bullish TK Cross and the Downtrend Break. Read the arrows as context for your own plan, not as trade calls.
Limits you should know
- The test covers one symbol, one timeframe and three months. Other markets and timeframes are untested.
- "1 ATR first" measures direction, not profit. It includes no stops, targets, spread or costs.
- The Kijun-sen lags by design. In a tight range, price closes on both sides of it again and again, and the biases flip back and forth.
- It does not tell you how strong a trend is or where the swing points are.
Who should skip it
Skip it if you want an arrow you can trade without a filter, or if you mainly trade ranges. Also skip it if you would rather not manage a chart that shows 65 marks a week with everything switched on.
Settings to start with
Start with the defaults, because they are what the Lab measured. Then try two untested changes, each compared against the default on your own chart:
- On M5, raise
TrendConfirmBarsto 8 to cut early Pullbacks and Breaks. This is not tested by the Lab. - If you trade M5 or M15 intraday, set
HigherTFContextto H1 for a closer higher-timeframe read. This is also not tested by the Lab.
If the chart feels noisy, turn off ShowTenkan first.
An idea to pair it with
This tool tells you the direction against the Kijun-sen but not how strong the trend is. One untested idea: add ADX as a trend-strength check before a Pullback.