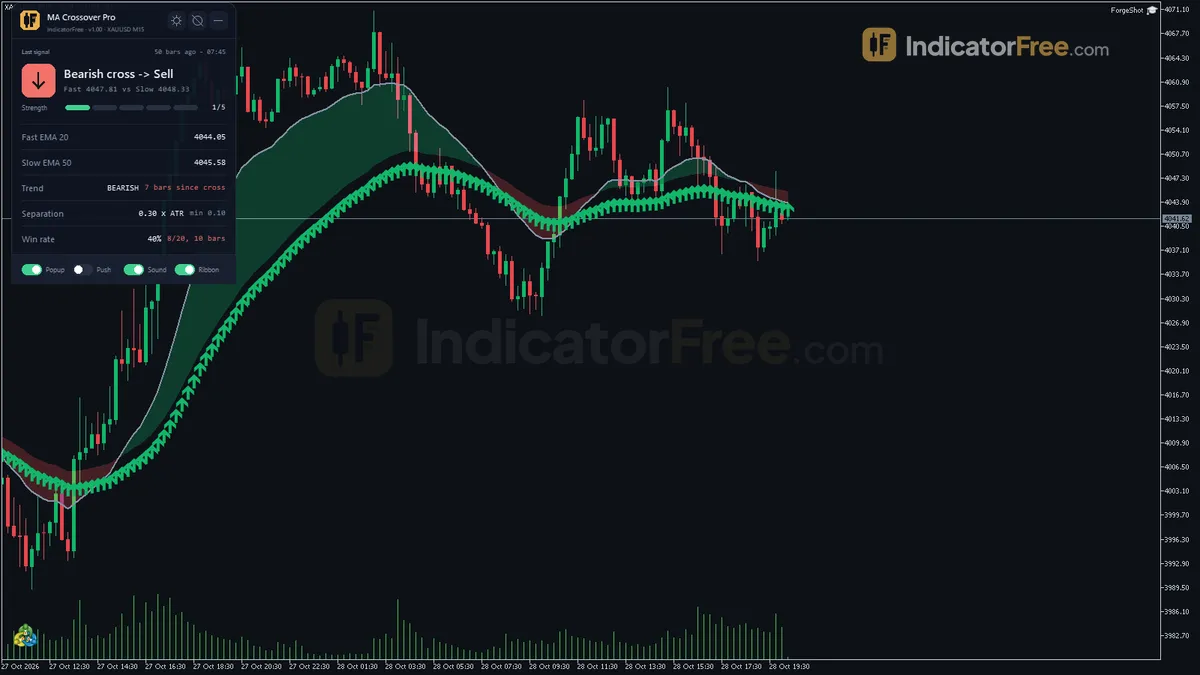
MA Crossover Pro
Free MA Crossover Pro indicator MT5: fast/slow MA ribbon, ATR-filtered cross arrows, HTF labels and alerts. Lab repaint test: 0 of 8 signals changed.
- Repainted
- 0 / 8
- Signals / week
- ≈ 0.6
- Tested on
- EURUSD M15
- Tested
- 2026-10-05
Overview
MA Crossover Pro draws a fast and a slow moving average on your MT5 price chart. It fills the gap between them with a green or red ribbon and places an arrow when a filtered cross happens on a closed bar. In the Lab's EURUSD M15 repaint test, 0 of 8 arrows changed after their bar closed. It suits trend traders who want fewer, cleaner cross alerts instead of an arrow every time the lines touch.
What it draws on your chart
A moving average crossover happens when a faster average moves above or below a slower one. Traders read it as a possible change in trend direction. MA Crossover Pro adds two filters on top of the plain cross, so it shows fewer signals than a basic crossover indicator:
- Fast MA and Slow MA lines in the main chart window, not a subwindow. The defaults are a 20 EMA and a 50 EMA on Close.
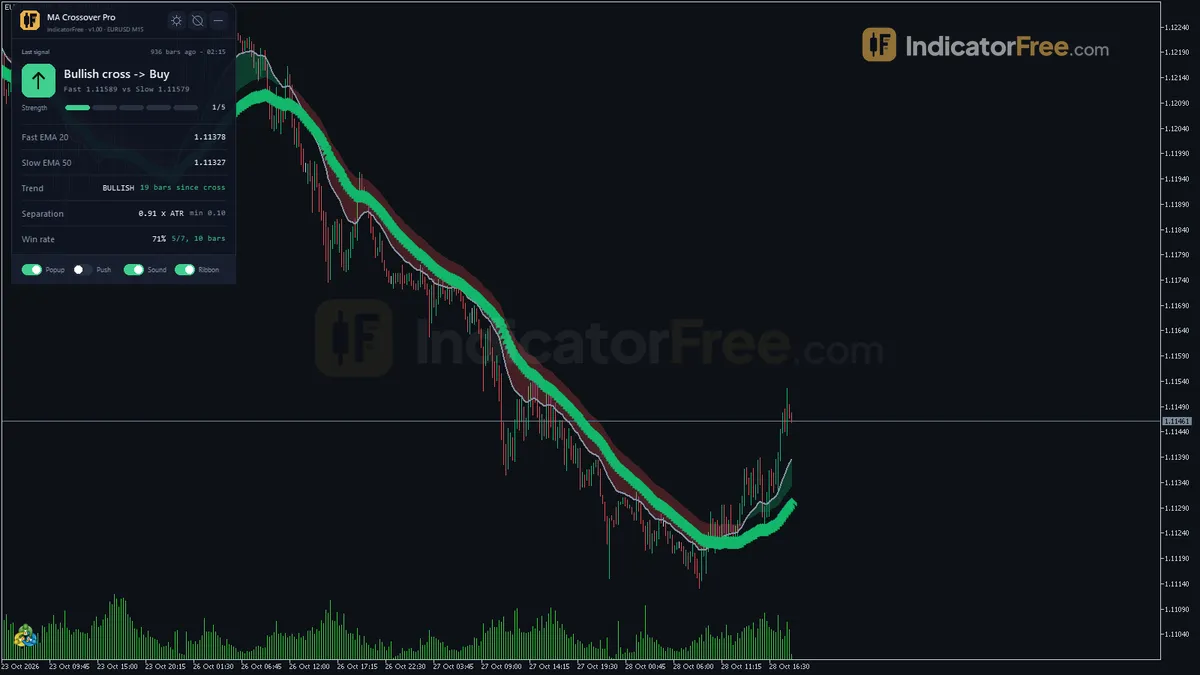
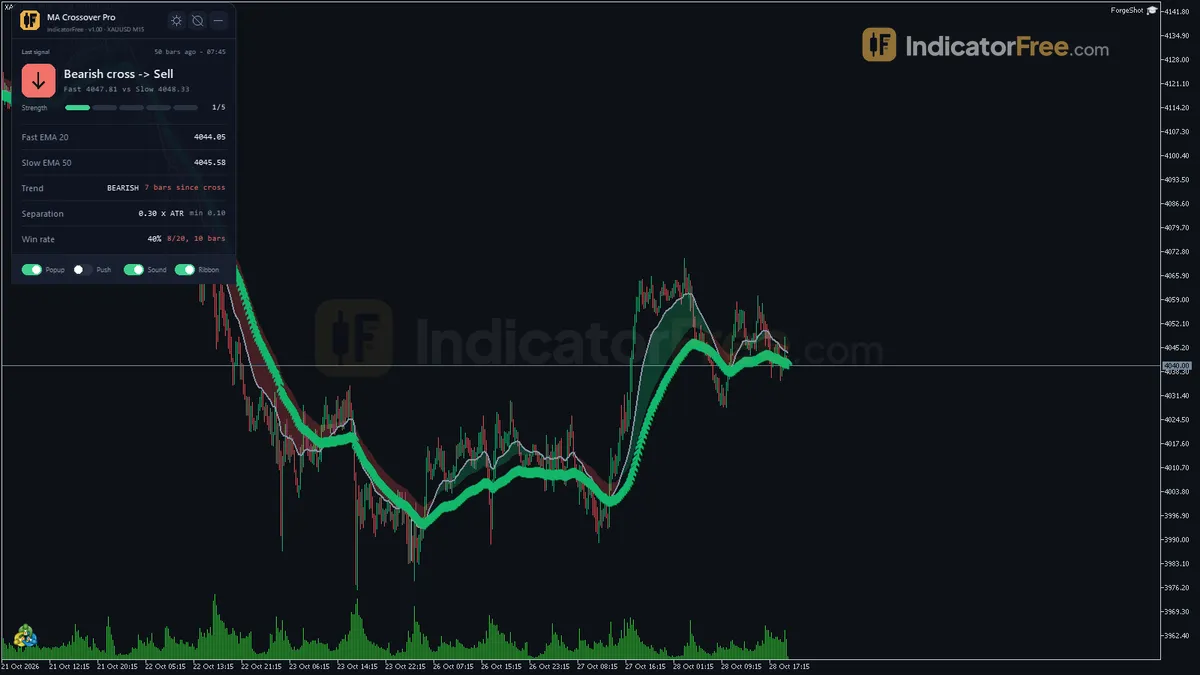
- A ribbon that fills the space between the two lines, green or red.
- Bullish Cross and Bearish Cross arrows. One appears only when the gap between the lines is wide enough in ATR terms and enough bars have passed since the last arrow.
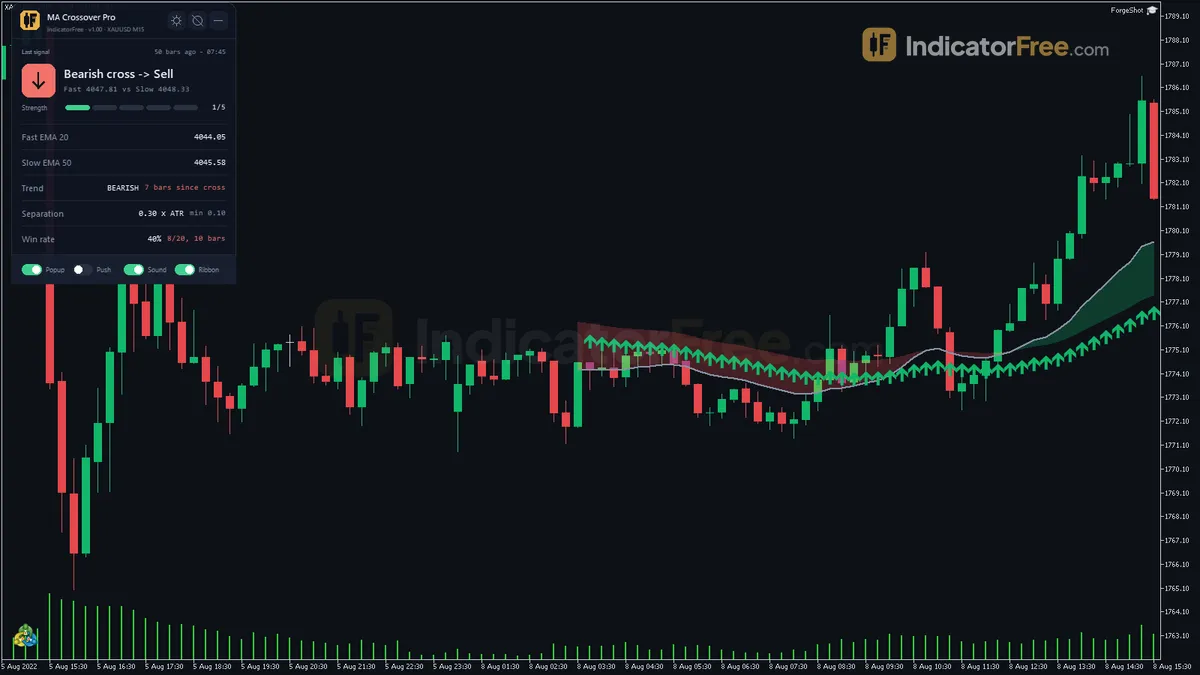
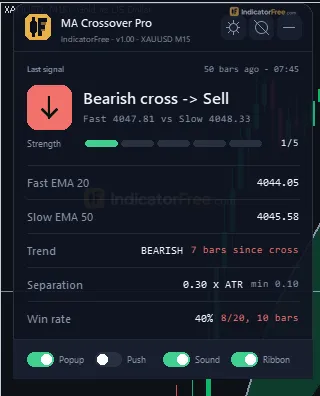
- A Signal panel that shows the last filtered cross (how many bars ago and its higher-timeframe label), both MA values, the current trend and bars since the last cross, the MA separation in ATR, the higher-timeframe trend and a win rate for recent signals.
How the Lab tested it
The Lab ran version 1.00 (143.3 KB) on MT5 build 6230. The test used EURUSD M15 from 2026-07-06 to 2026-10-02 with real ticks from Raw Trading Ltd. The Lab used two checks:
- Repaint check: each arrow was logged when it first appeared and compared with the finished chart later. Besides no arrow changing, the longest arrow delay was 0 bars. Each arrow appears on the bar where the cross closed, not a few bars later.
- Signal check: for every arrow, the Lab recorded whether price moved 1 ATR in the signal's direction before it moved 1 ATR against it.
The figure below shows the signal check results.
What these numbers mean for you
- The arrows stay where they are drawn. An arrow you see in history is the arrow you would have seen live, so you can review past signals on your own chart and trust them.
- The arrow alone was not an edge. 37.5% of the signals reached 1 ATR in their direction first. Every signal hit one side or the other within 20 bars, so the rest went 1 ATR against you first. That is worse than a coin flip, so treat the arrow as a sign that the trend may be changing, not as an entry by itself.
- Moves resolved quickly. The median was 2.0 bars to the first 1 ATR hit, about half an hour on M15. You find out fast whether a cross is working.
- Signals are rare. About 0.6 arrows per week on EURUSD M15 with default settings.
- The sample is small. 8 signals is too few for firm conclusions. The Lab's breakdown lists all 8 under the Bullish Cross buffer, so there is no separate result for Bearish Cross arrows yet. Only EURUSD M15 was tested.
Who it is for
It helps swing and intraday trend traders who already have an entry method and want a calm, non-repainting alert when the trend flips. If you want frequent signals or a ready-made system that is profitable on its own, this is not that tool.
How it works
- 1Calculates fast and slow moving averages with the chosen method and price. If slow is shorter, they swap.Inputs: FastPeriod, FastMethod, FastPrice, SlowPeriod, SlowMethod, SlowPrice
- 2A cross occurs on a closed bar when the fast minus slow difference changes sign.
Difference = Fast MA - Slow MA - 3The cross counts only if the gap is a fraction of ATR and enough bars passed since the last signal.
abs(Fast - Slow) >= MinSeparationATR x ATRInputs: ATRPeriod, MinSeparationATR, MinBarsBetweenSignals - 4Optionally compares fast and slow averages on a higher timeframe, tagging alerts as confirmed or counter-trend.Inputs: HigherTF
- 5Stats show the share of recent signals where the close some bars later moved in the signal direction.Inputs: StatsLookback, StatsForwardBars
Specifications
- Platform
- MetaTrader 5
- Version
- 1.00
- Type
- Indicator
- Window
- Main chart
- Draws
- 2 lines, 2 arrows, 1 panel
- Alerts
- popup, push, sound
- Repaints
- No (0 of 8 signals changed)
- Inputs
- 22
- Tested on
- MT5 build 6230 · 2026-10-05
Repaint test
No repaint detected. In a 6 Jul 2026 – 2 Oct 2026 test on EURUSD M15 (Raw Trading Ltd real ticks), 8 signals were logged at bar close and re-read at the end of the test: 0 changed. Arrows print on the bar that closes the signal, with no delay.
IndicatorFree — tested 2026-10-05 · MT5 build 6230 · Raw Trading Ltd real ticks. Results come from historical data, not live trading, and do not guarantee future results.
Signal statistics
Over 6 Jul 2026 – 2 Oct 2026 on EURUSD M15, the indicator printed 8 arrows. After 37.5% of them, price moved 1×ATR(14) in the arrow's direction before moving 1×ATR against it (median 2 bars). 0% reached neither level within 20 bars.
This measures price movement after the arrow, not a trading result. It includes no spread, commission, stop loss or position sizing.
Small sample — not enough to draw a conclusion.
What it draws
- A line (Fast MA) from buffer 4.
- A line (Slow MA) from buffer 5.
- Arrows (Bullish Cross) from buffer 6, drawn on the closed bar.
- Arrows (Bearish Cross) from buffer 7, drawn on the closed bar.
- An on-chart panel (Signal); values shown in the panel are not exposed as buffers.
Inputs
| Input | Default | What it does |
|---|---|---|
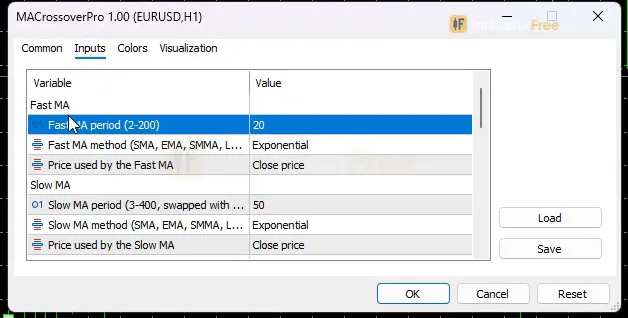
| FastPeriod | 20 | Fast MA period (2-200) |
| FastMethod | Ema | Fast MA method (SMA, EMA, SMMA, LWMA) |
| FastPrice | Close | Price used by the Fast MA |
| SlowPeriod | 50 | Slow MA period (3-400, swapped with Fast if smaller) |
| SlowMethod | Ema | Slow MA method (SMA, EMA, SMMA, LWMA) |
| SlowPrice | Close | Price used by the Slow MA |
| ATRPeriod | 14 | ATR period used by the separation filter (5-50) |
| MinSeparationATR | 0.1 | Min gap between the MAs at the cross, in ATR, to draw an arrow (0 = filter off) |
| MinBarsBetweenSignals | 3 | Min bars since the previous arrow before a new arrow is drawn (0 = off) |
| HigherTF | Off | Higher timeframe whose MA trend labels signals Confirmed / Counter-trend |
| AlertOnlyConfirmed | false | Alert only when the signal matches the higher-timeframe trend (needs HigherTF) |
| StatsLookback | 20 | Number of recent arrows used for the win rate (5-100) |
| StatsForwardBars | 10 | Bars after an arrow used to score it win / loss (3-50) |
| ShowRibbon | true | Fill the area between the two MAs (green / red) |
| ShowDashboard | true | Show the on-chart status panel |
| PanelScale | 1 | Panel size multiplier (DPI is applied automatically) |
| Theme | Dark | Chart color theme |
| RestoreTheme | true | Restore the original chart colors when removed |
| AlertPopup | true | Popup alert when a new arrow appears |
| PushNotification | false | Push notification when a new arrow appears |
| AlertSound | true | Play a sound when a new arrow appears |
| AlertSoundFile | alert.wav | Sound file played on alert |
How to read it
Install: copy the file into MQL5/Indicators in your data folder (File > Open Data Folder), refresh the Navigator and drag MA Crossover Pro onto a chart.
Reading the lines, ribbon and arrows
- Green ribbon: the fast MA is above the slow MA, so the short-term trend is up. Red ribbon: the fast MA is below the slow MA.
- Bullish Cross arrow: on the last closed bar, the fast MA closed above the slow MA after being at or below it on the bar before. The gap between them was at least MinSeparationATR x ATR, and at least MinBarsBetweenSignals bars had passed since the previous arrow.
- Bearish Cross arrow: the same test in the other direction. The fast MA closes below the slow MA after being at or above it.
The illustration below shows both cases: a cross the filter ignores and a cross that gets an arrow.
Common misread: "The lines crossed, but no arrow appeared, so the indicator is broken." It is working as designed. Look at the separation value in the panel. If it is below MinSeparationATR, or the last arrow was fewer than MinBarsBetweenSignals bars ago, the cross is filtered out on purpose. The ribbon still changes colour, so a colour change without an arrow means a weak or clustered cross.
How one arrow forms
The flow below shows the checks a cross must pass before an arrow appears.
- 1Bar closesOnly closed bars are checked
- 2Sign changeFast MA minus Slow MA flips from at/below zero to above (or the reverse)
- 3Separation filterabs(Fast - Slow) >= MinSeparationATR x ATR(ATRPeriod)
- 4Spacing filterAt least MinBarsBetweenSignals bars since the previous arrow
- 5Higher-timeframe labelIf HigherTF is set: Confirmed or Counter-trend
- 6Arrow + alertPopup, sound or push; AlertOnlyConfirmed can mute Counter-trend alerts
Reading the Signal panel
The panel shows the state of the chart at a glance. Check three things before you act:
- Higher-timeframe label on the last cross: Confirmed means the higher-timeframe MAs agree with the arrow. Counter-trend means they point the other way.
- MA separation in ATR: a larger value means the lines are clearly apart. A value near your MinSeparationATR means the cross only just passed the filter.
- Win rate: this is the share of your last StatsLookback arrows where the close StatsForwardBars bars later was in the signal direction. It is calculated live on your chart and symbol. It is not the Lab's result and uses a different scoring method (close after N bars, not 1 ATR first).
Inputs to change first
- FastPeriod (2-200) / SlowPeriod (3-400): these set how fast the lines react. Shorter periods mean more crosses and earlier signals. Longer periods mean fewer, later signals. If you enter a slow period shorter than the fast one, the two are swapped.
- FastMethod / SlowMethod: SMA, EMA, SMMA or LWMA. FastPrice / SlowPrice set the price each MA uses.
- MinSeparationATR (default 0.1, 0 = off): raise it to ignore crosses where the lines barely part. This gives fewer but clearer arrows.
- MinBarsBetweenSignals (default 3, 0 = off): raise it to stop several arrows from bunching up when price chops back and forth.
- ATRPeriod (5-50): the ATR length used for the separation filter.
- HigherTF (default Off): choose a higher timeframe so every signal is labelled Confirmed or Counter-trend.
- StatsLookback (5-100) / StatsForwardBars (3-50): these control the panel win rate only. They do not change the arrows.
- ShowRibbon, ShowDashboard, PanelScale, Theme, RestoreTheme: display options only.
Alerts
When a new arrow appears, MA Crossover Pro can show a popup in the MT5 Alerts window (AlertPopup, on by default) and play a sound (AlertSound, using AlertSoundFile, default alert.wav). It can also send a push notification to the MT5 mobile app (PushNotification, off by default). Set AlertOnlyConfirmed to true to get alerts only for Confirmed signals. This works only when HigherTF is set.
A decision rule to start with
Take an arrow only if all three are true:
- It is labelled Confirmed by HigherTF.
- The panel's MA separation is clearly above your MinSeparationATR.
- Your own entry method agrees.
Skip it if it is Counter-trend, or if the previous arrow in the opposite direction came only a few bars earlier. That pattern means the market is moving sideways, not trending.
Installation
- 1Download MACrossoverPro.ex5 from the button above (Google Drive).
- 2In MetaTrader 5: File → Open Data Folder → MQL5 → Indicators. Copy MACrossoverPro.ex5 there.
- 3Restart MT5 or right-click Indicators in Navigator → Refresh.
- 4Drag MA Crossover Pro onto a chart. For push alerts, enable "Allow push notifications" under Tools → Options → Notifications.
- Tested on MT5 build 6230.
Key terms and guides
- Average True Range
- Average True Range (ATR) is a volatility indicator that shows how far price typically moves per candle, gaps included, averaged over a set number of candles. It measures the size of moves, not their direction.
- Moving average crossover
- A moving average crossover is the point where a faster moving average crosses a slower one on a price chart: a cross upward suggests an uptrend may be starting, and a cross downward suggests a downtrend may be starting.
- Moving average
- A moving average is a line drawn from the average closing price of a set number of recent candles, recalculated on every new candle. It smooths out price noise and shows which way the trend is pointing.
- Exponential moving average
- The exponential moving average (EMA) is a moving average that gives the newest closes the most weight, so it turns sooner than a simple moving average. Traders use it to read trend direction and to time entries on pullbacks.
- 50 EMA
- The 50 EMA is an exponential moving average of the last 50 candle closes, with more weight on recent prices. Traders use the line to judge trend direction and as a moving level where pullbacks often stall.
- Trend
- A trend is the main direction price keeps moving in over a period. In an uptrend price makes higher highs and higher lows. In a downtrend it makes lower highs and lower lows.
More on this subject: Trend & moving averages guide, terms and tools
User reviews
No reviews yet. Members who download the tool can review it here.
Sign in and download the tool to review it.
Build a checklist with it
MA Crossover Pro does one job on the chart: entry signal. Put it on the same chart as the tools below and the IndicatorFree panels merge into one checklist card, ordered trend, zone, signal, risk.
- Trend / contextMarket Structure ShiftMA Crossover Pro tells you when; this tells you which way the market leans, so you can skip signals against it.
- Zone / levelKey Level MapShows the zones and levels, so you can see whether a signal from MA Crossover Pro fires at a level worth trading.
The Lab has not tested these combinations. Each tool is tested on its own; the card only lines up what each one says. Free members get 2 new tools a day. If one has to wait until tomorrow, install BlackBox to raise the limit to 5 a day (20 on a live account).
FAQ
Does MA Crossover Pro repaint?
No repaint detected. In a 6 Jul 2026 – 2 Oct 2026 test on EURUSD M15 (Raw Trading Ltd real ticks), 8 signals were logged at bar close and re-read at the end of the test: 0 changed. Arrows print on the bar that closes the signal, with no delay.
Can I use MA Crossover Pro in an EA?
Yes. Read buffer 6 (Bullish Cross) with iCustom() on bar 1 — the last closed bar.
Why can’t my EA read the zones?
Zones and the panel are chart objects, not indicator buffers, so iCustom() does not return them.
How do I get alerts on my phone?
Enter your MetaQuotes ID under Tools → Options → Notifications, tick "Enable push notifications", and keep the push alert input on.
Does it work on other pairs?
Tested on EURUSD only; other symbols not tested.
Which timeframes and pairs can I use MA Crossover Pro on?
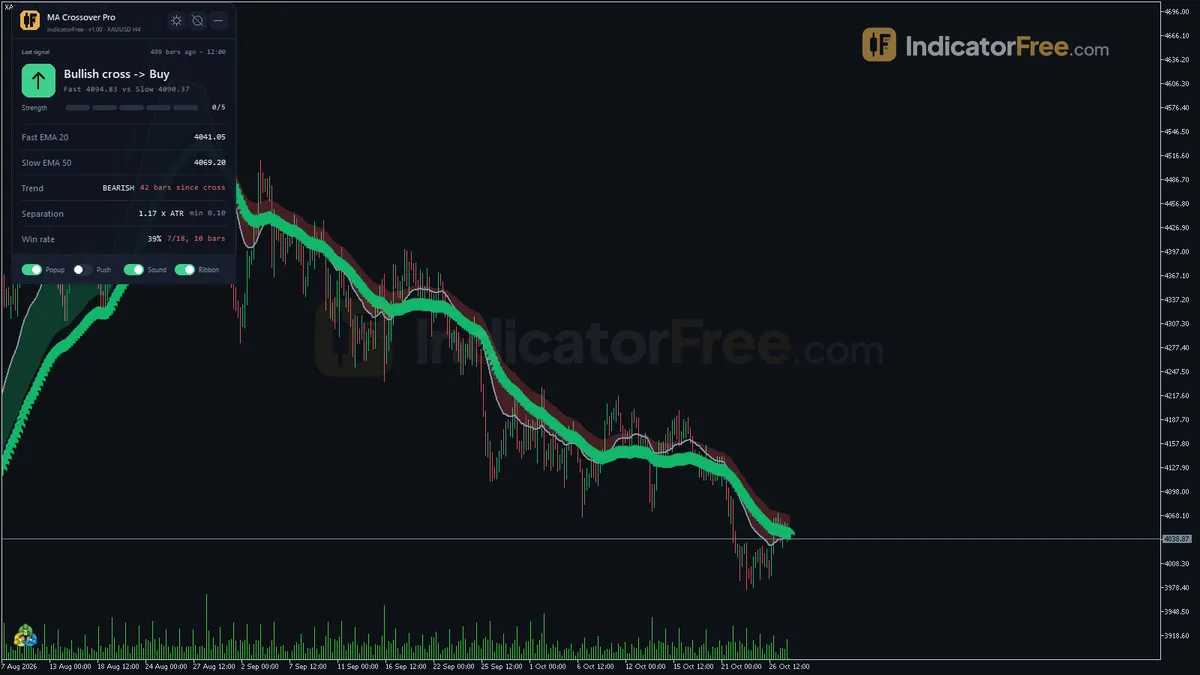
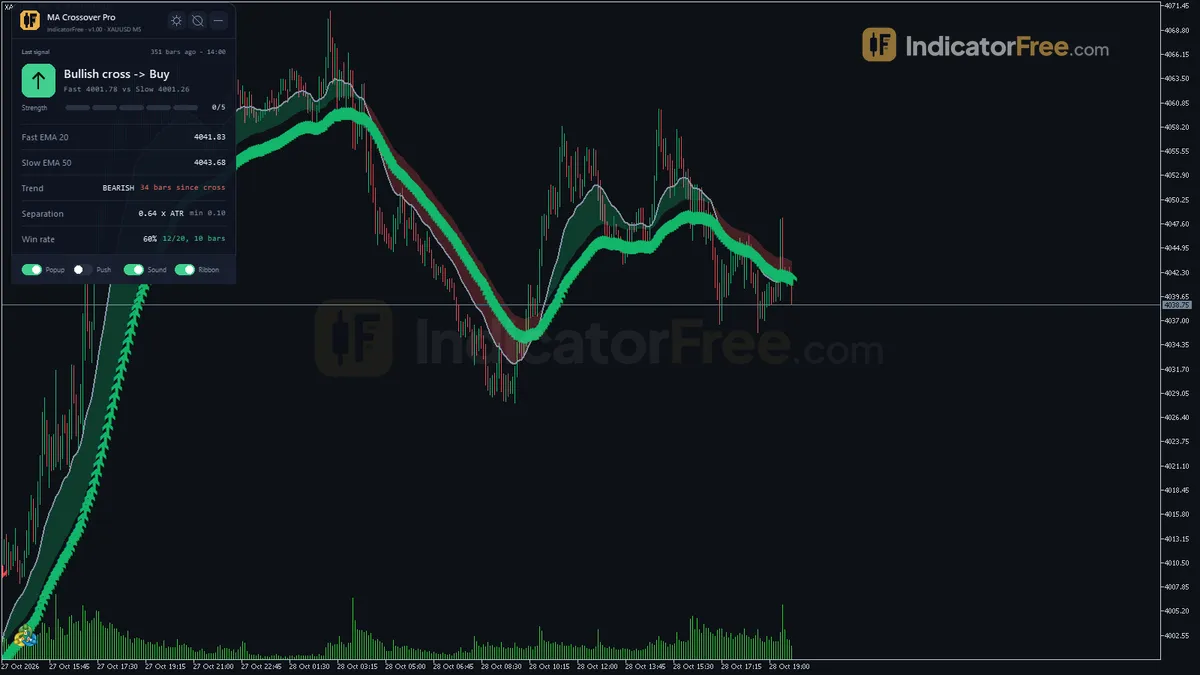
It runs on any MT5 symbol and timeframe, and the screenshots show it on M5 and H4 as well as M15. The Lab only measured EURUSD M15, so on other markets, check the panel's win rate over a few weeks before relying on it.
Can I switch from EMA to SMA or use other periods?
Yes. FastMethod and SlowMethod each accept SMA, EMA, SMMA or LWMA, and FastPrice and SlowPrice let you choose the price each average uses. FastPeriod can be 2-200 and SlowPeriod 3-400. If you set the slow period shorter than the fast one, the indicator swaps them.
How do I get the alerts on my phone?
Set PushNotification to true. Push alerts go to the MT5 mobile app linked to your terminal through its MetaQuotes ID in the terminal's notification settings. Popup and sound alerts work on the desktop without extra setup.
Will it change my chart colours?
The Theme input (default Dark) recolours the chart while the indicator is attached. With RestoreTheme left on true, your original colours come back when you remove it.
Does the panel win rate match the Lab result?
No. The panel scores your last StatsLookback arrows on whether the close StatsForwardBars bars later was in the signal direction. The Lab scored whether price reached 1 ATR in the signal direction before 1 ATR against it. They measure different things, so the numbers will differ.
Changelog
- 1.00Initial release: Fast/Slow moving average crossover with a two-color ribbon filled between the lines, an ATR-based separation filter and minimum-bar gap to suppress weak and clustered crosses, optional higher-timeframe. · 2026-10-09
Final verdict
Is MA Crossover Pro worth installing?
Yes, as a trend-change alert and filter, not as a signal to trade on its own. Its strongest point is reliability: in the Lab test, arrows appeared on the bar where the cross closed and did not move or disappear afterwards. The ATR separation filter, bar spacing and higher-timeframe label do what a plain two-line crossover cannot. They remove weak crosses and tell you whether a cross goes with the bigger trend or against it. The live win rate in the panel lets you check performance on your own symbol without exporting anything.
Where it falls short
- In the Lab test, the arrow by itself reached 1 ATR in its direction first less than half the time. If you buy or sell every arrow without a filter, you are likely to lose more often than you win.
- Results cover 8 bullish signals on one pair and one timeframe. There is no Lab result yet for bearish arrows, other pairs or other timeframes.
- It follows the trend, so it arrives after a move has started. It cannot pick tops and bottoms. When price chops sideways, even filtered crosses can come one after another in opposite directions.
- It gives no stop-loss or take-profit levels. You must plan your exits yourself.
Who should skip it
Scalpers who need several setups a day. At default settings it produces well under one arrow a week on M15. Also skip it if you want a complete system with exits, or if you trade pure price action and do not use moving averages.
Settings to start with
Keep the defaults (20/50 EMA, MinSeparationATR 0.1, MinBarsBetweenSignals 3) for your first week so you can compare against them. Then try these, which are untested starting points, not Lab results. Compare each with the default on your own chart:
- Set HigherTF to a timeframe about four times your chart, for example H1 on an M15 chart, and set AlertOnlyConfirmed to true. This mutes Counter-trend alerts.
- On noisy lower timeframes such as M5, try MinSeparationATR 0.2 and MinBarsBetweenSignals 5 to reduce clustered arrows.
- To see the panel win rate on a longer horizon, try StatsLookback 50 and StatsForwardBars 20.
A tool to pair it with
A crossover cannot tell a trending market from a sideways one. You could add ADX and take an MA Crossover Pro arrow only when ADX shows the trend is strong. This is an idea to try. The Lab has not tested the pair.