Parabolic SAR Pro
Free Parabolic SAR Pro indicator for MT5: SAR trend lines, flip arrows, alerts and a status panel. Lab repaint test: 0 of 591 signals changed.
- Repainted
- 0 / 591
- Signals / week
- ≈ 44.9
- Tested on
- EURUSD M15
- Tested
- 2026-10-09
Overview
Parabolic SAR Pro is a free MT5 indicator that draws the Parabolic SAR on your main price chart. It adds a large Flip Buy or Flip Sell arrow each time the trend flips, and an on-chart status panel. In the Lab's repaint test on EURUSD M15, 0 of 591 signals changed after their bar closed, and no arrow arrived late (0 bars of delay). It helps trend traders who want a visible trailing stop and a clear, alertable moment when that stop is hit.
What it draws on your chart
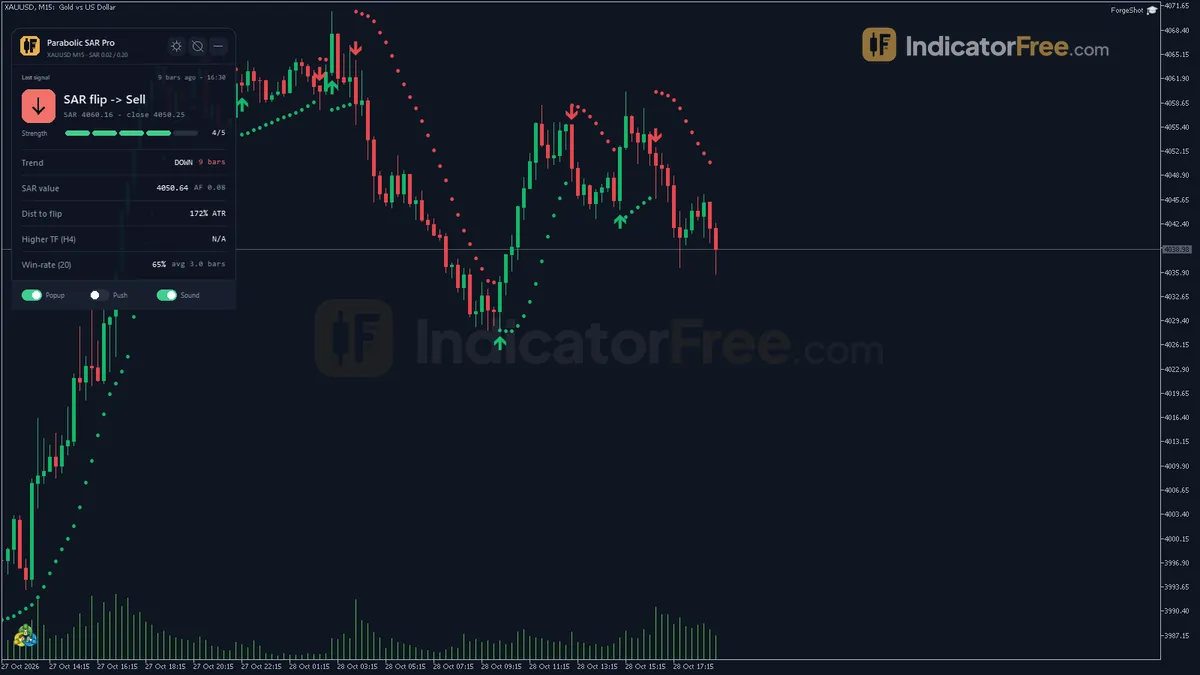
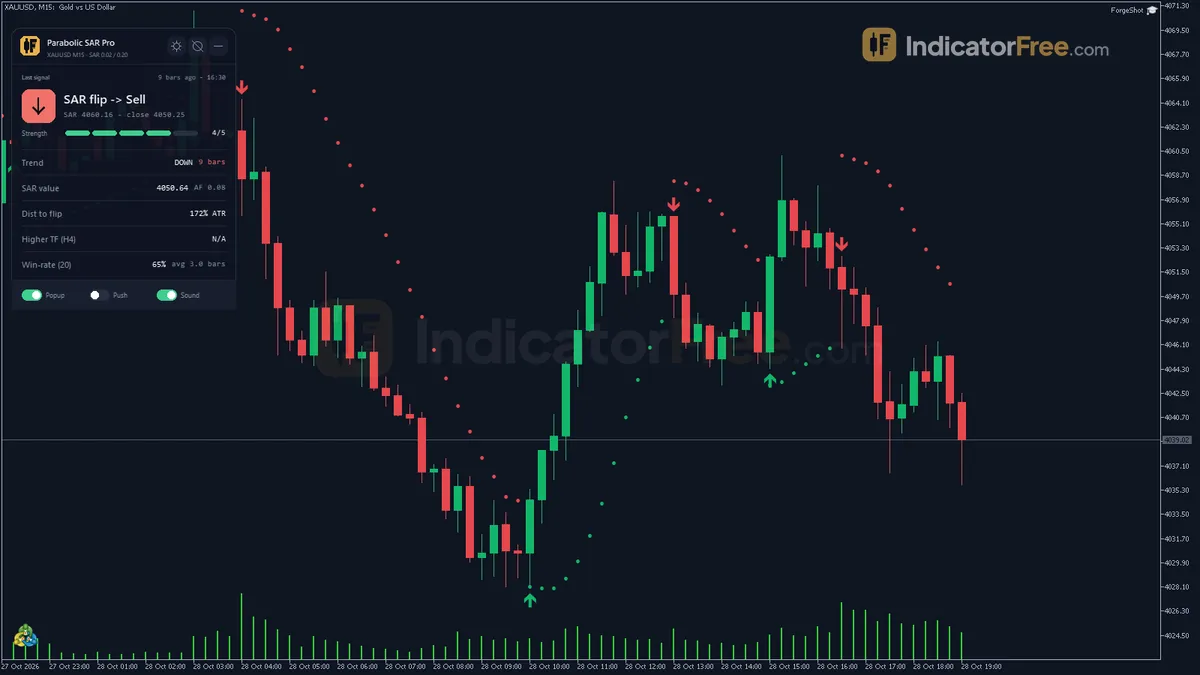
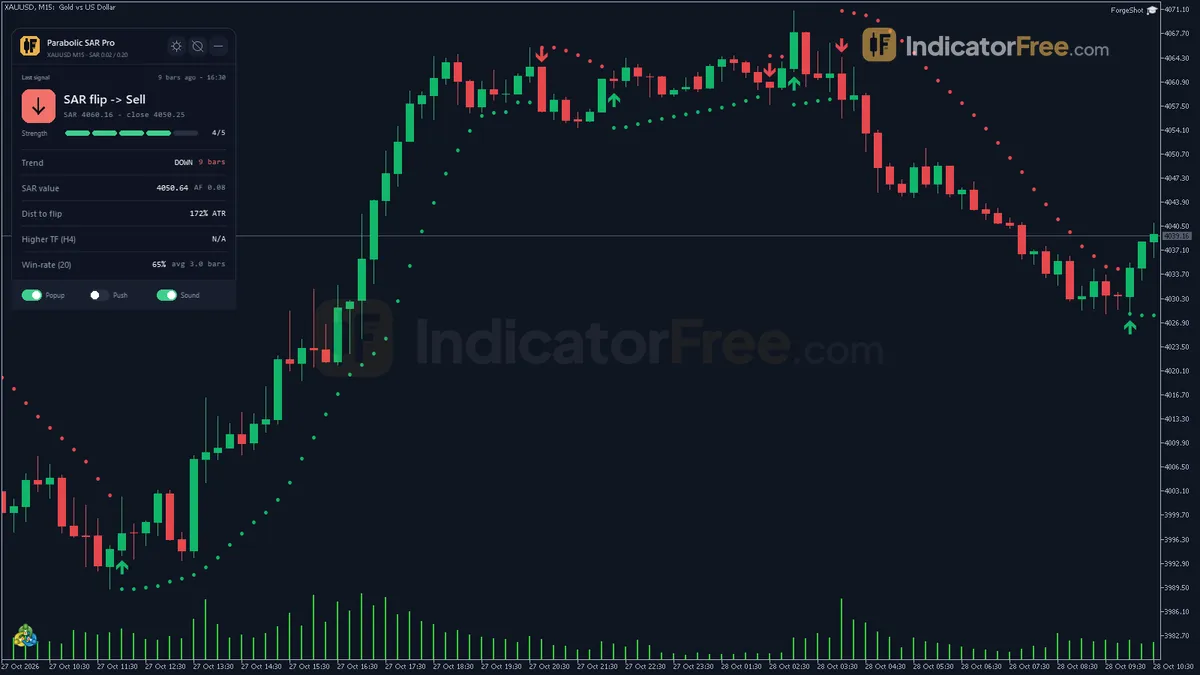
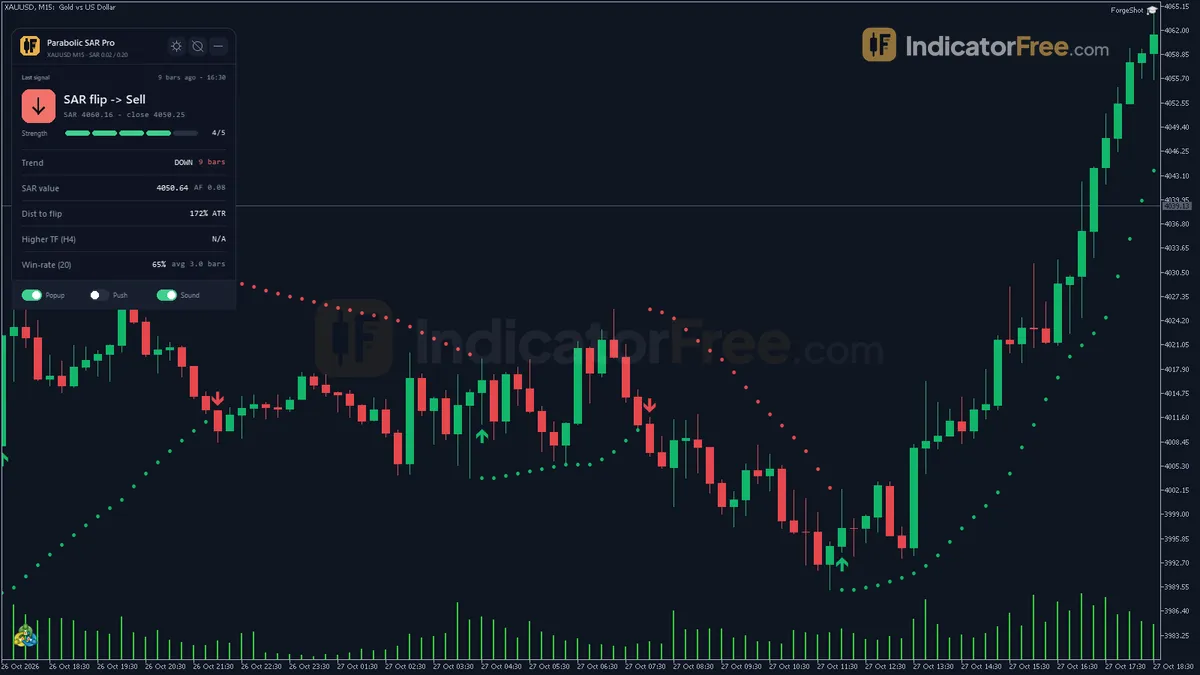
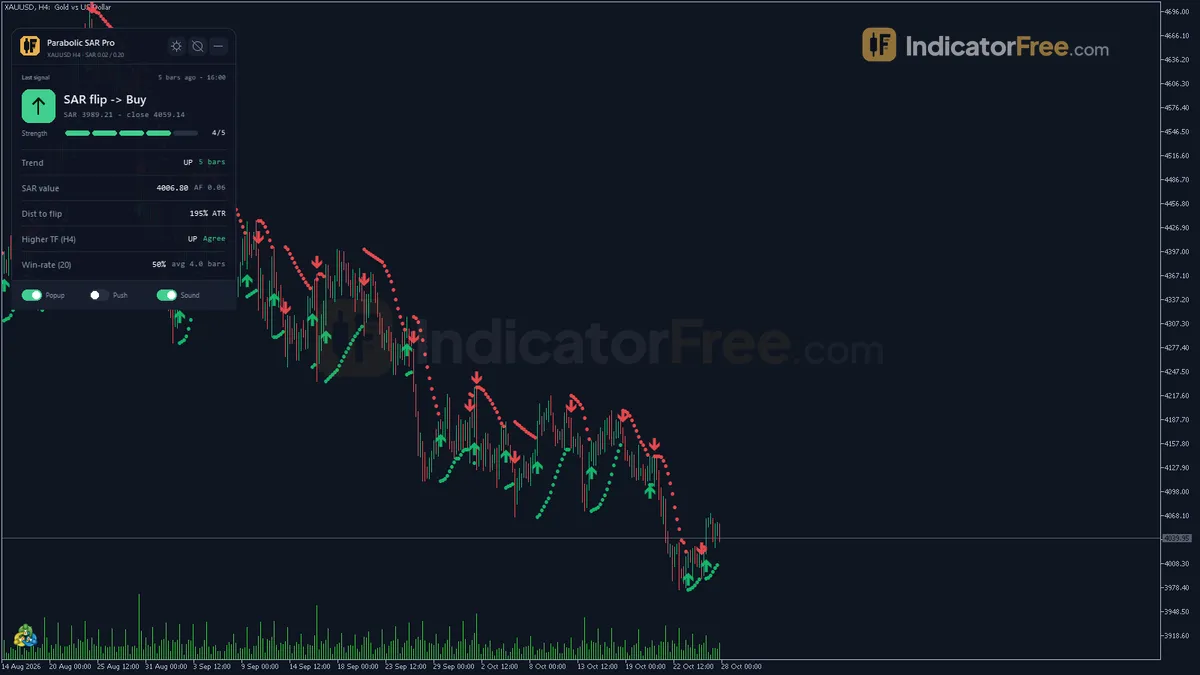
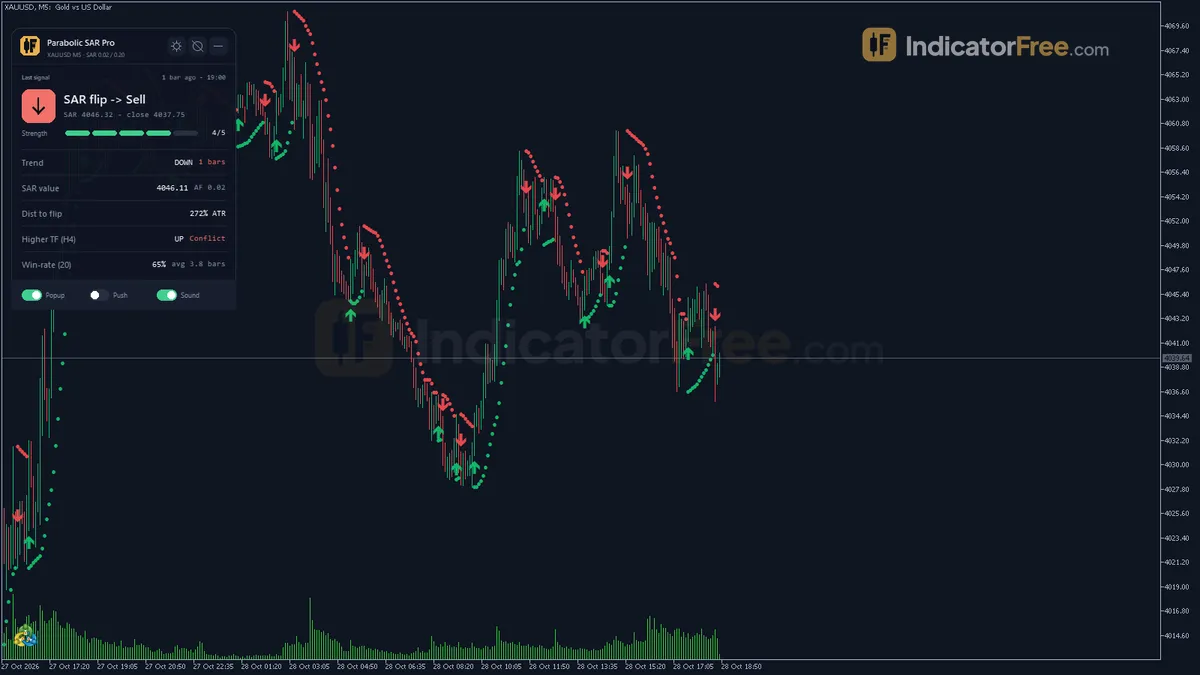
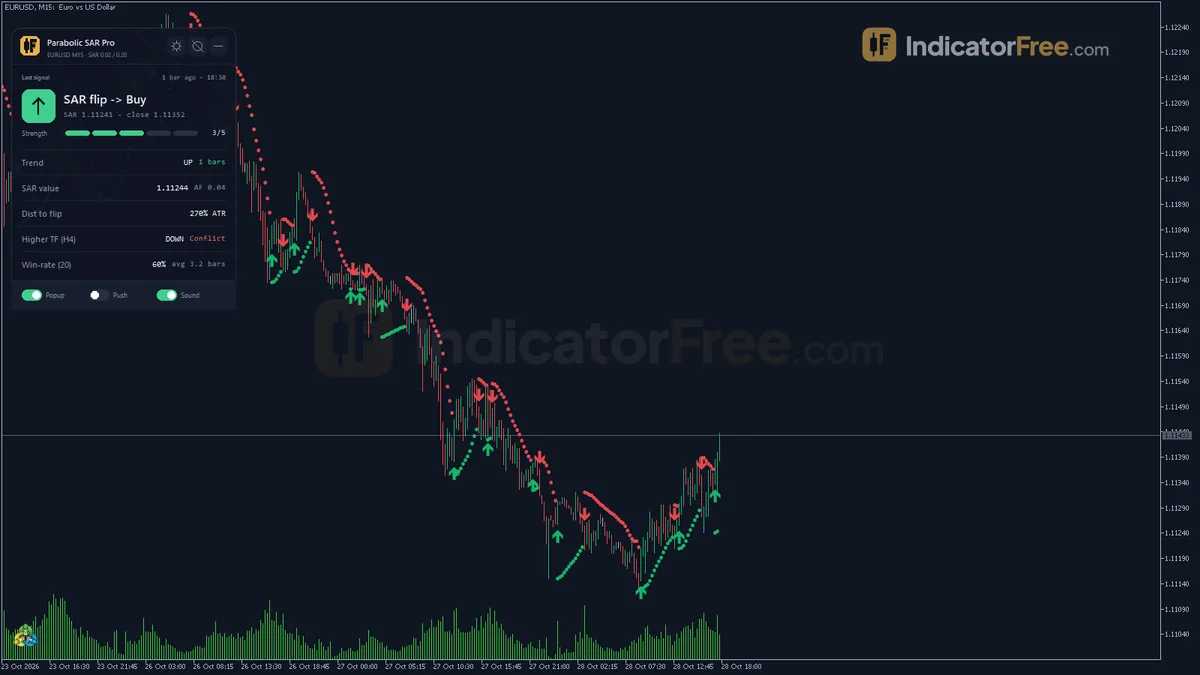
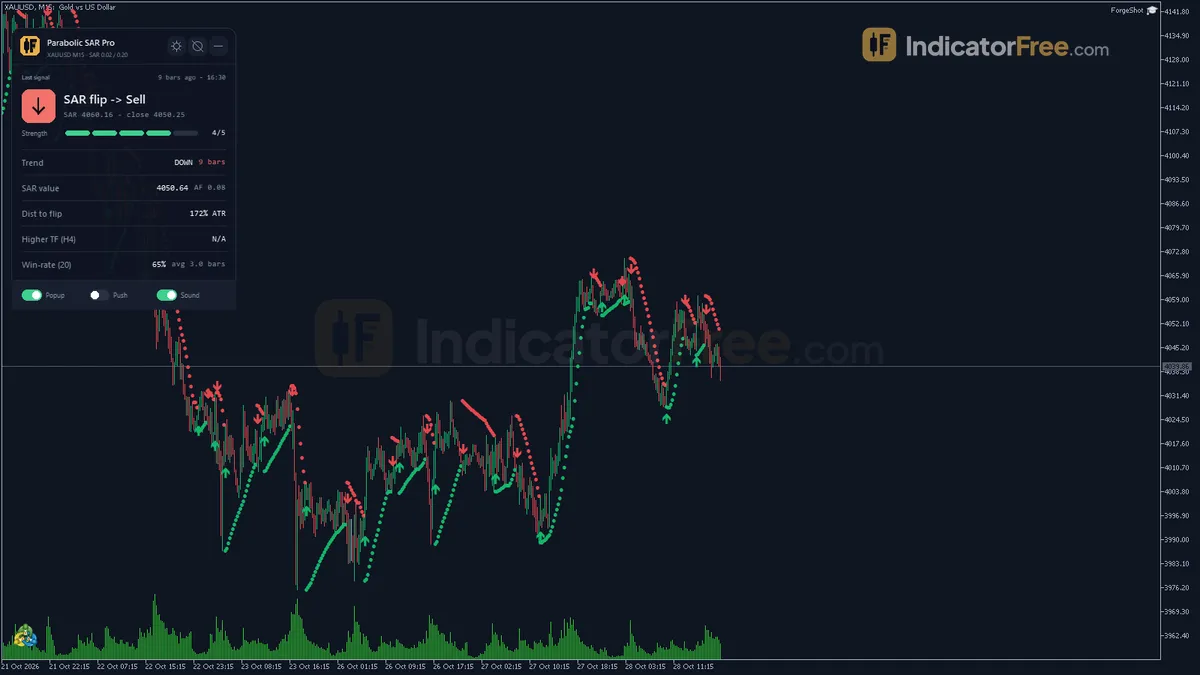
The Parabolic SAR is a stop-and-reverse level that trails price and speeds up as the trend extends. The indicator draws it as two lines plus two arrows:
- SAR Up (buffer 0): in an uptrend, the SAR trails below price as a stop.
- SAR Down (buffer 1): in a downtrend, the SAR trails above price as a stop.
- Flip Buy (buffer 2) and Flip Sell (buffer 3): large arrows that sit apart from the trend dots. They print on the closed bar that broke through the SAR.
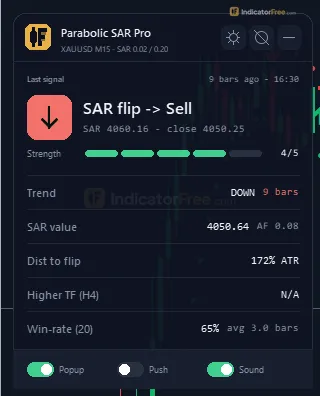
- SAR Status panel: shows the last flip, the current trend and bars since the flip, the SAR value and acceleration factor, the distance from close to the SAR in percent of ATR, the higher-timeframe SAR trend and a flip win-rate.
The Lab tested version 1.00 (140 KB) on MT5 build 6230 on 2026-10-09.
How the Lab tested it
The Lab ran the indicator on EURUSD M15 from 2026-07-09 to 2026-10-08, using real ticks from Raw Trading Ltd. It logged every flip arrow as it appeared and compared it with the finished history. That makes 591 signals, and none of them moved, vanished or appeared late. In practice, the arrow you see when a bar closes is the arrow you will find in history, so your alerts and your backtests describe the same signals.
The Lab also measured what price did after each arrow: did it move 1 ATR in the arrow's direction before it moved 1 ATR against it?
Scale zoomed in to show the difference (bars do not start at zero).
What those numbers mean for you
- 48.8% hit 1 ATR first: this is about a coin flip. A SAR flip on its own gives you no edge as an entry. Its value is as a trend and stop reference, plus a timing cue you filter with something else.
- Median 2 bars to the hit: the 1 ATR test resolves fast either way (median 2 bars, about 30 minutes on M15).
- 2.7% reached neither side within 20 bars (1.0% for Flip Buy, 4.4% for Flip Sell). Almost every flip is followed by a real 1 ATR move one way or the other.
- 44.9 signals per week (22.5 buy, 22.4 sell) on M15. That is about nine flips per trading day, and in sideways markets they tend to alternate.
Who it is for
It suits swing and intraday trend followers who already have a direction bias and want a mechanical trailing stop with an alert when it breaks. It is not for traders looking for a standalone buy/sell arrow system.
How it works
- 1Starts from the first two bars, picks direction from their closes, and sets an extreme point and step.Inputs: InpStep
- 2Each bar moves the SAR toward the extreme point, but never beyond the previous two bars' lows or highs.
SAR = SAR_prev + AF x (EP - SAR_prev)Inputs: InpStep - 3When price makes a new extreme, the acceleration factor grows by the step up to the maximum.
AF = min(AF + InpStep, InpMaxStep)Inputs: InpStep, InpMaxStep - 4If price touches the SAR the trend flips: SAR jumps to the old extreme, an arrow appears and acceleration resets.
- 5Panel reads higher-timeframe trend and counts recent flips followed by a move of an ATR multiple soon after.
Target move = InpFlipQualityATRMult x ATRInputs: InpConfirmTF, InpATRPeriod, InpFlipLookback, InpFlipQualityBars, InpFlipQualityATRMult
Specifications
- Platform
- MetaTrader 5
- Version
- 1.00
- Type
- Indicator
- Window
- Main chart
- Draws
- 2 lines, 2 arrows, 1 panel
- Alerts
- popup, push, sound
- Repaints
- No (0 of 591 signals changed)
- Inputs
- 16
- Tested on
- MT5 build 6230 · 2026-10-09
Repaint test
No repaint detected. In a 9 Jul 2026 – 8 Oct 2026 test on EURUSD M15 (Raw Trading Ltd real ticks), 591 signals were logged at bar close and re-read at the end of the test: 0 changed. Arrows print on the bar that closes the signal, with no delay.
IndicatorFree — tested 2026-10-09 · MT5 build 6230 · Raw Trading Ltd real ticks. Results come from historical data, not live trading, and do not guarantee future results.
Signal statistics
Over 9 Jul 2026 – 8 Oct 2026 on EURUSD M15, the indicator printed 591 arrows. After 48.8% of them, price moved 1×ATR(14) in the arrow's direction before moving 1×ATR against it (median 2 bars). 2.7% reached neither level within 20 bars.
This measures price movement after the arrow, not a trading result. It includes no spread, commission, stop loss or position sizing.
What it draws
- A line (SAR Up) from buffer 0.
- A line (SAR Down) from buffer 1.
- Arrows (Flip Buy) from buffer 2, drawn on the closed bar.
- Arrows (Flip Sell) from buffer 3, drawn on the closed bar.
- An on-chart panel (SAR Status); values shown in the panel are not exposed as buffers.
Inputs
| Input | Default | What it does |
|---|---|---|
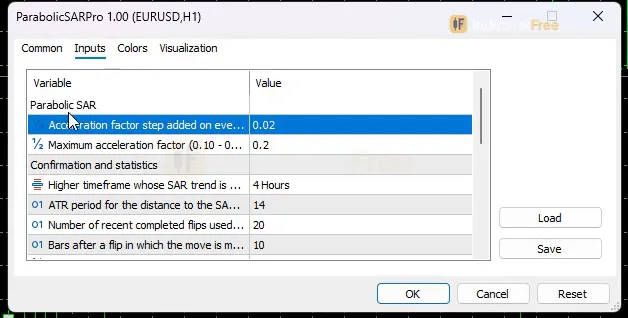
| InpStep | 0.02 | Acceleration factor step added on every new extreme point (0.01 - 0.05) |
| InpMaxStep | 0.2 | Maximum acceleration factor (0.10 - 0.50) |
| InpConfirmTF | H4 | Higher timeframe whose SAR trend is compared with the chart trend (raised to the chart timeframe if lower) |
| InpATRPeriod | 14 | ATR period for the distance to the SAR and the flip win-rate |
| InpFlipLookback | 20 | Number of recent completed flips used for the win-rate |
| InpFlipQualityBars | 10 | Bars after a flip in which the move is measured |
| InpFlipQualityATRMult | 1 | A flip wins if price moves this many ATR (ATR of the flip bar) in its direction |
| InpEnableAlerts | true | Master switch for all flip alerts |
| InpAlertPopup | true | Popup Alert() in the terminal when a flip bar closes |
| InpAlertPush | false | Push notification to the MT5 mobile app |
| InpAlertSound | true | Play a sound |
| InpAlertSoundFile | alert.wav | Sound file played when sound alerts are on |
| InpShowDashboard | true | Show the on-chart panel |
| PanelScale | 1 | Panel size multiplier (DPI is applied automatically) |
| InpTheme | Dark | Chart color theme |
| InpRestoreTheme | true | Restore the original chart colors when the indicator is removed |
How to read it
Install in one line
Copy Parabolic SAR Pro (140 KB, .ex5) into MQL5/Indicators in your MT5 data folder, refresh the Navigator (restart MT5 if it does not appear in the Navigator), and drag Parabolic SAR Pro onto a chart. It draws in the main price window, not in a subwindow.
How one flip forms
Each bar, the SAR moves toward the extreme point (EP), which is the highest high of an uptrend or the lowest low of a downtrend: SAR = SAR_prev + AF x (EP - SAR_prev). It is never placed beyond the lows (uptrend) or highs (downtrend) of the previous two bars. Every new extreme raises the acceleration factor: AF = min(AF + InpStep, InpMaxStep). So the longer a trend runs, the faster the stop closes in.
A flip happens when a closed bar breaks the projected SAR:
- Flip Sell: in a SAR uptrend, the closed bar's low falls below the projected SAR (capped at the lows of the two previous bars).
- Flip Buy: in a SAR downtrend, the closed bar's high rises above the projected SAR (capped at the highs of the two previous bars).
At the flip, the SAR jumps to the old extreme on the other side of price, the arrow prints and the acceleration factor resets.
Reading the SAR Status panel
- Bars since the flip: a young trend still has a slow SAR with room behind price. A trend that is many bars old has a fast SAR sitting close.
- Acceleration factor: when it is near InpMaxStep, the stop is moving quickly and a flip can come soon.
- Distance to SAR in % of ATR: tells you how much room your trailing stop gives, measured in volatility instead of pips.
- Higher-timeframe SAR trend: the SAR direction on InpConfirmTF (H4 by default). If you set a timeframe lower than the chart, it is raised to the chart timeframe.
- Flip win-rate: counts the last InpFlipLookback (20) completed flips that moved InpFlipQualityATRMult (1) x the ATR of the flip bar in their direction within InpFlipQualityBars (10) bars. This is a quick local check, and its value is measured differently (a 1 ATR move within 10 bars, not 1 ATR before 1 ATR against), so do not compare it with the Lab's 48.8%.
Inputs to change first
- InpStep (default 0.02, range 0.01 - 0.05): the main input behind both arrows. A smaller step makes the SAR trail more slowly and further from price, so flips should come less often. A larger step tightens the stop and flips more. If M15 feels too busy, try 0.01. This is not tested by the Lab, so compare it with the default.
- InpMaxStep (default 0.2, range 0.10 - 0.50): caps how fast the stop can close in on a long trend. Lower values keep you in extended trends longer.
- InpConfirmTF (default H4): set it about 4-16 times your chart timeframe so the panel gives you a real higher-timeframe bias.
- InpATRPeriod (default 14): affects only the panel's distance and win-rate, not the SAR or the arrows.
- PanelScale (default 1) resizes the panel; InpShowDashboard hides it.
Alerts
Flip alerts fire when the flip bar closes. InpEnableAlerts is the master switch. InpAlertPopup (on) shows an Alert() window in the terminal. InpAlertSound (on) plays InpAlertSoundFile (alert.wav). InpAlertPush (off by default) sends the alert to the MT5 mobile app.
Decision rule
Take a Flip Buy only when the panel's higher-timeframe SAR trend is also up. Take a Flip Sell only when it is down. Skip flips against the higher-timeframe trend, and skip any arrow that comes fewer than 3 bars (untested) after the previous flip, as shown by the panel's bars since the flip, because that is chop. The Lab has not tested this filter, so check it on your own chart before relying on it. If you are already in a trade, treat the opposite flip as your exit, not as an order to reverse.
A common misread
Many traders read a Flip arrow as a reversal call. It is not: it only tells you that the trailing stop was hit. Because the SAR keeps accelerating, a strong trend that just pauses can trigger a flip and then resume.
Installation
- 1Download ParabolicSARPro.ex5 from the button above (Google Drive).
- 2In MetaTrader 5: File → Open Data Folder → MQL5 → Indicators. Copy ParabolicSARPro.ex5 there.
- 3Restart MT5 or right-click Indicators in Navigator → Refresh.
- 4Drag Parabolic SAR Pro onto a chart. For push alerts, enable "Allow push notifications" under Tools → Options → Notifications.
- Tested on MT5 build 6230.
Key terms and guides
- Uptrend
- An uptrend is a market where price keeps making higher highs and higher lows: each rally peaks above the last one, and each pullback stops above the previous low.
- Average True Range
- Average True Range (ATR) is a volatility indicator that shows how far price typically moves per candle, gaps included, averaged over a set number of candles. It measures the size of moves, not their direction.
- Indicator buffer
- An indicator buffer is the list of numbers an indicator stores, one value per candle, for each line, histogram or arrow it draws. Expert Advisors and alerts read these buffers to get the indicator's values.
- Every tick based on real ticks
- Every tick based on real ticks is the MT5 Strategy Tester mode that replays the actual bid and ask ticks your broker recorded, with the real changing spread, instead of ticks the tester invents from 1-minute bars.
- Downtrend
- A downtrend is a market move where each swing high and each swing low is lower than the one before it, which shows that sellers are in control.
- Trailing stop order
- A trailing stop order is a stop loss that follows price at a set distance when the trade moves in your favour and stays still when price moves against you. If price reverses by that distance, the trade closes.
More on this subject: Trend & moving averages guide, terms and tools
User reviews
No reviews yet. Members who download the tool can review it here.
Sign in and download the tool to review it.
Build a checklist with it
Parabolic SAR Pro does one job on the chart: trend / context. Put it on the same chart as the tools below and the IndicatorFree panels merge into one checklist card, ordered trend, zone, signal, risk.
- Zone / level50 EMA ZoneAdds where price is: the zones and levels that Parabolic SAR Pro does not draw.
- Entry signalCCIAdds the entry signal: the moment to act once Parabolic SAR Pro has set the scene.
The Lab has not tested these combinations. Each tool is tested on its own; the card only lines up what each one says. Free members get 2 new tools a day. If one has to wait until tomorrow, install BlackBox to raise the limit to 5 a day (20 on a live account).
FAQ
Does Parabolic SAR Pro repaint?
No repaint detected. In a 9 Jul 2026 – 8 Oct 2026 test on EURUSD M15 (Raw Trading Ltd real ticks), 591 signals were logged at bar close and re-read at the end of the test: 0 changed. Arrows print on the bar that closes the signal, with no delay.
Can I use Parabolic SAR Pro in an EA?
Yes. Read buffer 2 (Flip Buy) with iCustom() on bar 1 — the last closed bar.
Why can’t my EA read the zones?
Zones and the panel are chart objects, not indicator buffers, so iCustom() does not return them.
How do I get alerts on my phone?
Enter your MetaQuotes ID under Tools → Options → Notifications, tick "Enable push notifications", and keep the push alert input on.
Does it work on other pairs?
Tested on EURUSD only; other symbols not tested.
Which timeframe should I use Parabolic SAR Pro on?
The Lab measured it on M15 only. It runs on any MT5 timeframe, but expect fewer and longer-lasting flips on H1 and H4. Check the flip win-rate in the panel on your own timeframe before you trust it.
How do I get flip alerts on my phone?
Set InpAlertPush to true, because it is off by default, and keep InpEnableAlerts on. Your MT5 terminal must be linked to the MT5 mobile app for push notifications. Alerts arrive when the flip bar closes.
Can I hide or shrink the SAR Status panel on a small screen?
Yes. Set InpShowDashboard to false to hide the panel, or set PanelScale below its default of 1 to make it smaller. DPI is applied automatically.
Does it work on gold, indices or crypto?
The SAR math works on any symbol, but the Lab tested only EURUSD. On faster-moving symbols the distance-in-ATR reading in the panel is a better guide to stop room than pips. Treat results on other symbols as untested.
Can I use the Flip Buy and Flip Sell arrows in an EA?
The Flip Buy arrow is buffer 2 and the Flip Sell arrow is buffer 3, so an EA can read those two buffers on closed bars. The Lab tested the indicator on a chart, not inside an EA, so check that your EA reads the same flips you see on the chart.
Changelog
- 1.00Initial release: Wilder Parabolic SAR computed on closed bars only (zero repaint, verified over 3,000 bars), large flip arrows separate from the trend dots, three-channel flip alerts (popup/push/sound), higher-timeframe. · 2026-10-09
Final verdict
Where it earns its place
The signals are stable. Every arrow appears on the bar close and stays there, which the repaint test confirmed across the full three-month sample. The buy and sell sides behave almost the same (49.7% vs 47.8%). The status panel puts the higher-timeframe trend, the stop distance in ATR and the acceleration factor in one place, which saves you opening a second chart. Alerts cover popup, sound and push, and with InpRestoreTheme on, your original chart colours come back when you remove the indicator.
Where it falls short
The flip is not an edge on its own. At slightly under 50% it is a coin flip as an entry, and at default settings on M15 it fires constantly. Sideways markets are where it fails: the SAR flips back and forth, and each flip costs you spread. The indicator has no filter of its own for trend strength. The Lab measured only EURUSD M15, so other symbols and timeframes are untested.
Skip it if
- You want arrows you can trade blind, without any other filter.
- You mostly trade ranges or mean reversion. The SAR assumes price keeps trending.
- You scalp lower timeframes and do not want dozens of alerts a day.
Settings to start with
Keep InpStep 0.02 and InpMaxStep 0.2 at first, because those are the settings the Lab measured. Set InpConfirmTF to H4 for M15 or H1 charts. If you hold swing trades, try InpStep 0.01 with InpMaxStep 0.10 for a looser trailing stop. That combination is not tested by the Lab, so compare it with the default on your own symbol before relying on it.
An idea to pair with it
An idea the Lab has not tested: ignore flips while ADX shows a weak trend.
- –You already have a trend bias and need a trailing stop
- –The panel's higher-timeframe SAR agrees with the flip
- –You want an exit alert on bar close, without watching the chart
- –Price is moving sideways and flips alternate every few bars
- –You plan to trade every arrow as an entry
- –The flip goes against the higher-timeframe SAR trend