









Ichimoku cloud
Also called Ichimoku Kinko Hyo, Ichimoku, Kumo, Ichimoku indicator
The Ichimoku cloud (Ichimoku Kinko Hyo) is a trend indicator built from five lines. The shaded band between two of them, the cloud, shows trend direction and nearby support or resistance in one view.
The cloud answers three questions before you place an order. It tells you which side of the market to trade, whether momentum agrees, and where a stop has a real reason to sit. A common mistake is taking line crosses inside a flat cloud.
The five Ichimoku lines and what each one tells you
All the lines except one are midpoints: the highest high plus the lowest low of a period, divided by two. So the lines go flat when price moves sideways and jump when a new high or low enters the window. They are not averages of closing prices.
| Line | How it is built | What it tells you |
|---|---|---|
| Tenkan-sen (conversion line) | Midpoint of the last 9 candles | Short-term balance. When price is far from it, the move is stretched |
| Kijun-sen (base line) | Midpoint of the last 26 candles | Medium-term balance. Traders use it as a trailing stop and as a pullback level |
| Senkou Span A (leading span A) | Average of Tenkan-sen and Kijun-sen, drawn 26 candles ahead | The faster edge of the cloud |
| Senkou Span B (leading span B) | Midpoint of the last 52 candles, drawn 26 candles ahead | The slower edge. Its flat stretches, like flat stretches in the Kijun-sen, mark a range that price has not broken |
| Chikou Span (lagging span) | The latest close, drawn 26 candles back | Shows whether price now is above or below where it traded 26 candles ago |
The cloud (Kumo) is the space between Span A and Span B. When Span A is above Span B, the cloud is usually shaded bullish. When it is below, the cloud is shaded bearish. Both spans are shifted forward, so the cloud is already drawn for the next 26 candles. That forward cloud comes from past prices. It shows where support or resistance sits if nothing changes. It does not show where price will go.
The sketch below shows where each piece sits on a chart. The lines end at the latest candle, the cloud runs ahead of it and the Chikou Span trails behind.
Ichimoku settings: defaults and when to change them
| Input | MT5 default | What changing it does |
|---|---|---|
| Tenkan-sen | 9 | Lower gives a faster line with more crosses, and more of them are false. Higher gives fewer, later crosses |
| Kijun-sen | 26 | Sets the medium-term midpoint. In the standard version it also sets how far ahead the cloud is drawn and how far back the Chikou Span sits |
| Senkou Span B | 52 | Higher gives a thicker, flatter cloud that price crosses less often. Lower gives a thinner cloud and more breakouts |
If you change the settings, change all three together and keep roughly the 1 : 3 : 6 ratio. Otherwise the lines stop relating to each other the way the signals assume.
| Style | Chart | Settings | What to expect |
|---|---|---|---|
| Intraday | 1-hour | 9 / 26 / 52 | Many signals. Take only strong crosses and skip thin clouds |
| Swing | 4-hour to daily | 9 / 26 / 52 | The settings most traders watch |
| Slower swing or position | Daily | 20 / 60 / 120 | Smoother lines and a thicker cloud. Fewer, later signals |
Gold usually moves many more pips per candle than major pairs like EURUSD, so its cloud is wider in price and cloud-edge stops are larger. Do not shorten the settings just to get a tighter stop.
Reading each Ichimoku cloud signal
Price above, below or inside the cloud
This is the trend filter, and you check it first. When price is above the cloud, look only for buys. When it is below, look only for sells. When price is inside the cloud, there is no trend call: the market is between the two spans and either side can win.
Tenkan-sen and Kijun-sen cross
A bullish cross is the Tenkan-sen moving above the Kijun-sen. A bearish cross is the reverse. Where the cross happens matters more than the cross itself:
- Strong: a bullish cross above the cloud, or a bearish cross below it.
- Neutral: any cross inside the cloud.
- Weak: a bullish cross below the cloud, or a bearish cross above it. It trades against the larger trend.
Cloud breakout
A breakout is a candle that closes outside the cloud after trading inside it or on the other side. Thin clouds break easily, and those breaks often fail. A close through a thick cloud means price had to do more work to get there. Wait for the candle to close. A wick through the cloud does not count.
Cloud twist
When Span A crosses Span B, the cloud ahead changes colour. A twist ahead of price warns that the balance between buyers and sellers is shifting. On its own it is an early warning, not an entry.
The sketch below puts these cases side by side: a strong bullish cross above a thick cloud, a neutral cross inside a thin flat cloud that flips straight back, and a twist in the cloud ahead of price.
Chikou Span confirmation
For a buy, you want the Chikou Span above the candles from 26 periods ago, with open space above it. If it sits just under those old candles, price still has to get through resistance from that area.
Trading a strong Tenkan/Kijun cross: EURUSD 1-hour example
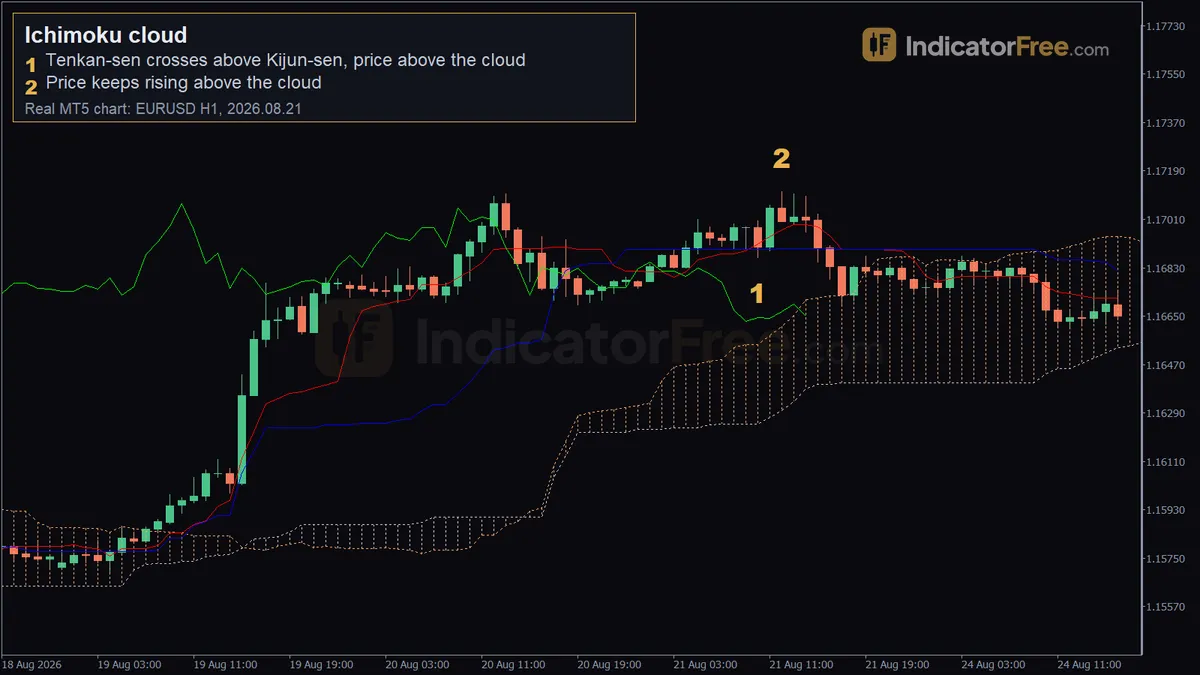
The chart at the top of this page is a past EURUSD 1-hour example, not a prediction. On 2026.08.21 at 10:00, the Tenkan-sen (1.16919) crossed above the Kijun-sen (1.16898). Price was 1.16908, above the cloud, whose top was 1.16545. By the rules above, that is a strong bullish cross because the cross agrees with the cloud.
Setup: buying the cross above the cloud
- Entry trigger: the 10:00 candle closes with the Tenkan-sen above the Kijun-sen and price above the cloud. You enter near 1.16908.
- Stop loss: the Kijun-sen was only 1 pip under price (1.16908 − 1.16898 = 0.00010). That is within normal spread noise. The next real level is the cloud top at 1.16545, which is 36.3 pips below entry. A stop a few pips under the cloud top, about 40 pips from entry, has a reason behind it.
- Exit: keep the stop under the cloud top. Once the Kijun-sen rises above entry, exit on a close below it.
From there price kept rising above the cloud (second marker on the chart). Over the next 20 candles price rose about 20 pips while the stop stayed 40 pips away under the cloud.
The lesson is that the 20-pip move was smaller than the 40-pip stop. A strong cross does not promise a move bigger than your stop. Measure the stop distance before you enter and size the trade from it.
A decision rule: if the Kijun-sen is closer to your entry than about two spreads, do not use it as a stop. Use the cloud edge with a smaller position, or skip the trade.
Sizing the trade from the cloud stop
This illustrative example turns the cloud-edge stop into an order size. It assumes a $10,000 account risking 1% per trade, with 1 standard lot (100,000 units) worth $10 per pip on EURUSD. The stop goes a few pips under the cloud top, rounded out to 40 pips.
A wider cloud, as on gold, means a smaller position with the same settings, not a tighter stop. If 1% risk gives you less than your broker's minimum lot, the trade is too wide for your account.
When the Ichimoku cloud works and when to stand aside
It works best in:
- Clean trends on the 1-hour chart and higher, where the cloud slopes and price stays on one side of it.
- Pullbacks in an established trend, where the Kijun-sen or the cloud edge gives you an area to buy or sell.
- Liquid sessions, when the highs and lows behind each midpoint reflect real trading.
Stand aside in:
- Flat, thin clouds with price weaving through them. Crosses flip back and forth.
- 1-minute and 5-minute charts. There, 9, 26 and 52 candles cover very little time, and the spread eats much of each signal.
- The minutes before major news. One spike can make the midpoints jump and redraw the cloud ahead.
- Late entries after a long run away from the Kijun-sen. The stop is wide and the move is stretched.
Ichimoku cloud strengths and weaknesses
| Strengths | Weaknesses |
|---|---|
| Trend, momentum and support or resistance on one chart | Busy chart that is easy to misread on a small screen |
| The cloud gives your stop a level with a reason behind it | Stops placed at the cloud are often wide |
| The cloud ahead shows levels before price reaches them | Lags at turning points: crosses come after the move has started |
| The same rules apply across markets on the 1-hour chart and higher | Many false signals when the market moves sideways |
| Rules are clear enough to write down and test | The default periods were chosen for a six-day trading week, not the 24-hour, five-day forex week |
Pairing the Ichimoku cloud with ADX to skip flat markets
The cloud's weak spot is sideways price. ADX (Average Directional Index) measures how strong a trend is, but not its direction, on a scale of 0 to 100. That fills the gap: Ichimoku gives you the direction and ADX tells you whether the trend is strong enough to trade.
A simple rule: take Ichimoku signals only when ADX is above 20 and rising. If ADX is below 20 and the cloud is flat, stand aside even when the lines cross. The filter is aimed at the cross-and-reverse trades that happen inside a flat cloud.
Ichimoku pre-trade checklist
- Is price on the right side of the cloud, and is the cloud not flat and thin?
- Is price on the same side of the cloud one timeframe up? Take 1-hour buys only when price is also above the 4-hour cloud.
- Has the Tenkan-sen crossed the Kijun-sen in your direction, on a closed candle?
- Is the Chikou Span clear of the candles from 26 periods ago?
- Is the stop at the Kijun-sen or the cloud edge, at least two spreads away, with the position sized from it?
FAQ
Why does an Ichimoku signal sometimes appear and then disappear?
The Tenkan-sen and Kijun-sen are recalculated while the current candle is still open. A new high or low during the candle can create a cross that is gone by the close. Old charts also flatter the signals: the Chikou Span is drawn 26 candles back, so on past charts it can look as if it saw the future, while in real time you only see its latest point.
Will the Ichimoku cloud look the same on a different charting platform?
The formula is standard, so with the same 9 / 26 / 52 settings the lines should match closely. Small differences come from each broker's price feed and from the time zone that sets where daily candles start.
What does it mean when price stays inside the cloud for days?
Price has not broken the highs and lows that the two spans are built from. Treat the cloud's edges as the top and bottom of a range: buy near the lower edge only with a stop below it, or wait for a close outside the cloud.