Tenkan-sen
Also called Conversion line, Tenkan, Turning line
The Tenkan-sen is the fast line of the Ichimoku Kinko Hyo indicator. It is the midpoint between the highest high and the lowest low of the last 9 candles, and traders use it to read short-term momentum and its crosses with the Kijun-sen.
The Tenkan-sen only looks back 9 candles, so it is usually the first Ichimoku line to turn when momentum shifts. It is also the first to mislead you when the market goes sideways. If you know how it is built, you can tell which of its moves are worth risking money on.
How the Tenkan-sen is calculated, and why it goes flat
Take the highest high and the lowest low of the last 9 candles, add them together and divide by 2. A moving average is built from closing prices. The Tenkan-sen ignores closes and uses only the two extremes of the window.
The drawing below shows one 9-candle window. Only two candles matter: the one with the highest wick and the one with the lowest wick.
This explains why the line often goes flat. If no candle sets a new 9-candle high or low, the midpoint does not move. A flat line does not mean the trend is fading. It only means price is still moving inside its recent range.
The line can also jump while the market is quiet. When an old extreme drops out of the 9-candle window, the midpoint resets, even if the newest candle barely moved. Count back 9 candles before you trade. If the highest or lowest candle is about to leave the window, expect a jump.
Decision rule: if the Tenkan-sen has been flat for 3 or more closed candles, treat the market as ranging. Stop looking for crosses until the line slopes again.
Default settings in MT5: Tenkan-sen 9, Kijun-sen 26, Senkou Span B 52. Some charting platforms call the Tenkan-sen the conversion line. The maths is the same.
Reading the Tenkan-sen on a chart, step by step
- Add Ichimoku Kinko Hyo to your chart and leave the Tenkan-sen at 9 periods.
- Find the line that hugs price and turns first. That is the Tenkan-sen. The Kijun-sen is slower and moves in longer steps.
- Read the slope. Rising means short-term buyers are in control, falling means sellers are, and flat means a range.
- Note which side of the Kijun-sen it is on. Tenkan-sen above the Kijun-sen means short-term momentum is stronger than medium-term momentum.
- Check where price closed compared with the cloud, the shaded band between Senkou Span A and Senkou Span B.
- Wait for the candle to close. Until then, the current candle's high or low can still change the value.
When a Tenkan-sen cross is valid, weak or broken
A cross is valid when the candle has already closed outside the cloud. The Tenkan-sen also has to cross the Kijun-sen at a clear angle, and the gap between the two lines should widen over the next few candles.
A cross is weak when it happens inside the cloud, where price has no bias either way. It is also weak if the Tenkan-sen goes flat right after it. A cross is broken once price closes back across the Kijun-sen within a candle or two. The left panel below shows a cross that follows through. The right panel shows the tangle you get inside the cloud.
A common misread is treating every touch between the two lines as a signal. Inside the cloud, the pattern in the right panel can repeat for many candles, and every cross costs you a spread and a small stop.
Bullish cross: the Tenkan-sen moves above the Kijun-sen after a candle has closed above the cloud. Bearish cross: the Tenkan-sen moves below the Kijun-sen after a candle has closed below the cloud. The slower line has its own glossary entry, Kijun-sen.
Planning a trade on the EURUSD 1-hour cross of 4 August 2026
This is a past example, not a prediction.
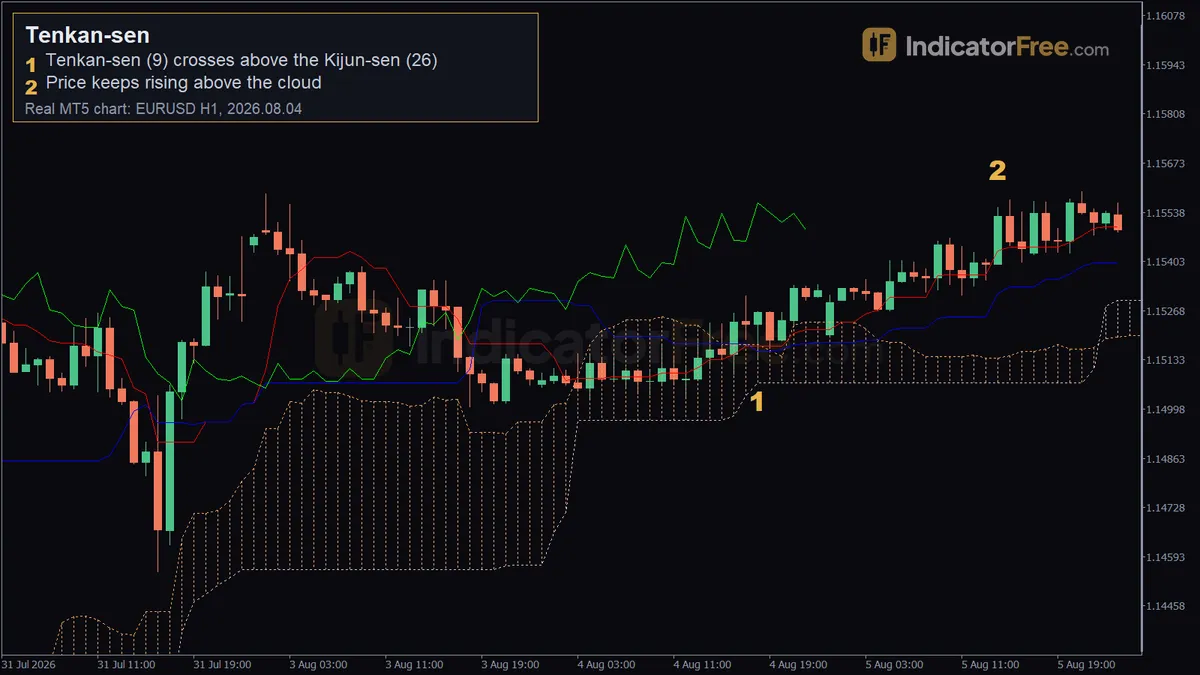
- Marker 1, 4 August 2026, 18:00: the Tenkan-sen (9) crosses above the Kijun-sen (26). The Tenkan-sen reads 1.15171 and the Kijun-sen 1.15156. The candle closes at 1.15263, above the cloud top at 1.15175, so the first test of a valid cross is met.
- Marker 2, 5 August 2026, 14:00: price keeps rising above the cloud and reaches 1.15552. That is 20 candles and 29 pips above the entry close.
The rules below are fixed at the close of the Marker 1 candle, before the result is known:
- Entry: buy at the close, 1.15263.
- Stop loss: at the Kijun-sen, 1.15156. 1.15263 − 1.15156 = 0.00107, so the risk is 10.7 pips.
- Target: twice the risk. 10.7 pips × 2 = 21.4 pips above the entry.
The levels below show the entry and stop against the high price reached by Marker 2.
Price rose 29 pips to 1.15552 by Marker 2 while holding above the cloud, and the stop sat below the cloud top. The 21.4-pip target fits inside that 29-pip rise, so it was reached by Marker 2, for a gain of 2R. The full 29-pip run, about 2.7 times the risk, only shows up with hindsight. No rule fixed at entry would have known to sell at the top.
For position size, here is an illustrative example. You risk 1% of a $10,000 account, which is $100. $100 ÷ 10.7 pips ≈ $9.35 per pip. A standard lot (100,000 units) of EURUSD is worth $10 per pip, so $9.35 ÷ $10 ≈ 0.93 lots. If the target is hit, 21.4 pips × $9.35 ≈ $200, which is twice the amount at risk. One past cross tells you nothing about the next one.
When the Tenkan-sen helps, and when to stand aside
Crosses tend to read more cleanly when the cloud ahead of price is thick and slopes the same way as the trade. That leaves room for the move to continue. They work worse near a kumo twist, where Senkou Span A and Senkou Span B cross each other. At that point the cloud itself has no clear direction.
| Pros | Cons |
|---|---|
| Turns faster than the Kijun-sen or the cloud, because it looks back only 9 candles | Whipsaws in a sideways market |
| Flat stretches show a range at a glance | Still lags, because it is built from past highs and lows |
| Gives a clear cross against the Kijun-sen | A cross without cloud context gives many false signals |
| Easy to check by hand from one high and one low | The 9/26/52 settings may not suit every market without testing |
Practical tips for trading the Tenkan-sen
- After a sharp run, compare two gaps: price to the Tenkan-sen, and the Tenkan-sen to the Kijun-sen. If the first gap is bigger, wait for a pullback toward the Tenkan-sen before you enter.
- Check the bias on the higher timeframe first, so a 15-minute cross does not fight the daily trend.
- Be careful with the first cross after a long sideways stretch. It often forms while price is still inside or next to the cloud.
- On 1-minute to 15-minute charts, crosses come often. Ask for a close outside the cloud every time.
- Fix your target or exit rule before entry, as in the EURUSD plan above. Choosing the exit after the move makes results look better than they would have been.
Quick checklist
- The candle closed outside the cloud, on the side of your trade.
- The Tenkan-sen crossed the Kijun-sen at an angle and has not been flat for 3 or more candles.
- No kumo twist just ahead of price.
- Stop at the Kijun-sen, with size calculated from that distance.
- Target or exit rule written down before you enter.
FAQ
Can I use the Tenkan-sen as a trailing stop?
Yes, in strong trends. Some traders exit when a candle closes on the wrong side of the Tenkan-sen. It keeps you close to price, but in a choppy trend it will take you out early. The Kijun-sen gives a looser trail.
Should I change the 9-period setting?
Only after testing on your own market and timeframe. A shorter period gives more crosses and more noise. A longer one gives fewer and later signals. Change one line at a time so you can see what each change does.
Why does my Tenkan-sen show a different value from another trader's chart?
The server time of the price feed decides where each candle starts and ends. If two charts use different time zones, the same 9 candles cover different hours, so the highest high and lowest low differ. The gap is usually biggest on daily candles.