









Kijun-sen
Also called Base line, Kijun line, Ichimoku base line
Kijun-sen is the base line of the Ichimoku Kinko Hyo indicator: the midpoint between the highest high and lowest low of the last 26 candles. Traders use it to read the medium-term trend and as a pullback level for entries and stops.
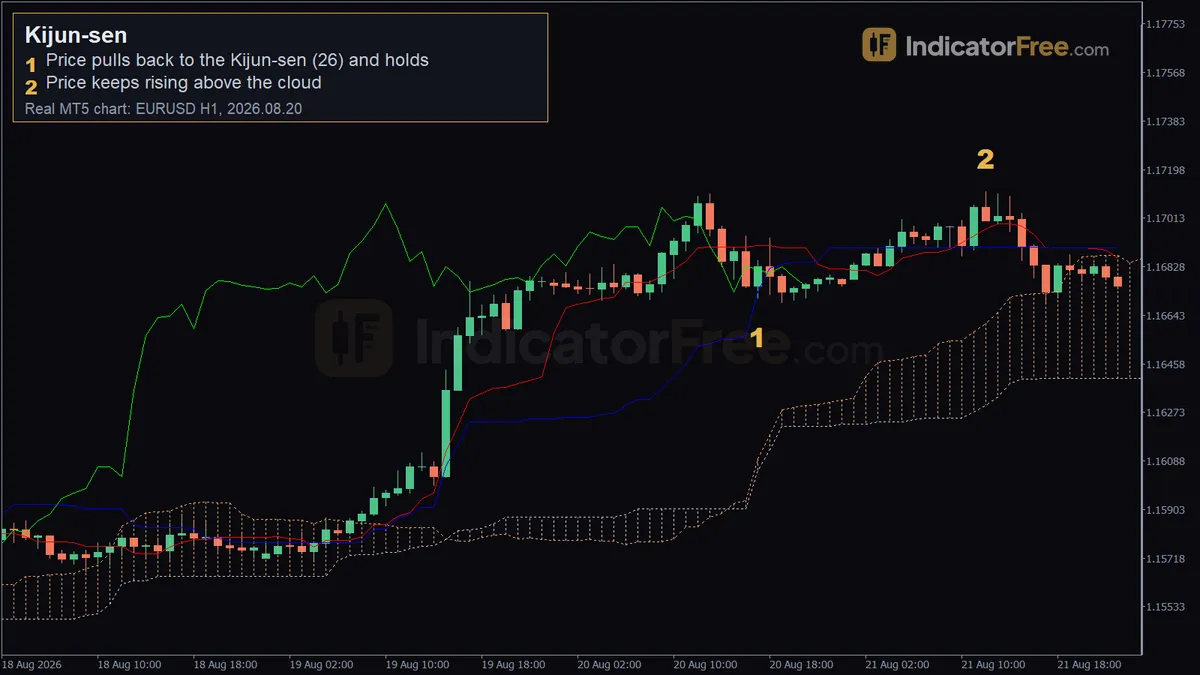
The line is built from price extremes, not from an average of closes. It moves only when a new 26-candle high or low forms, or when an old one drops out of the window. Pullbacks often probe it, so put your stop a buffer beyond the wick of the candle that touches it, not on the line itself.
How the Kijun-sen is calculated, and why it moves in steps
The formula is (highest high + lowest low) ÷ 2, measured over the last 26 candles. A candle that stays inside that range leaves the line where it is.
The line steps in two cases. Either a new extreme forms, or the candle that held the old extreme falls more than 26 candles back. The calculation below uses round, illustrative numbers and shows both kinds of step.
The second case is why the line sometimes jumps on a quiet candle. Nothing new happened on that candle. An old extreme simply expired.
Default settings: MT5 uses Tenkan-sen 9, Kijun-sen 26 and Senkou Span B 52. Most charting platforms don't offer the base line as a separate tool. It comes inside the Ichimoku indicator.
The steps are what set the Kijun-sen apart from a 26-period moving average. In the drawing below, the average curves with every candle. The Kijun-sen holds a flat shelf during the pullback, so price has one fixed level to test.
Checklist for spotting a Kijun-sen pullback
This is the pullback setup most traders mean by a "Kijun-sen trading strategy". Don't mix it up with the Tenkan-sen crossing the Kijun-sen. That is a different signal, covered under Tenkan-sen.
- Find the base line. It is the slower of the two lines near price. The faster one is the Tenkan-sen.
- Read the slope over the last 20-30 candles. If it steps up, your bias is up. If it steps down, your bias is down.
- Check the cloud. Price should be on the same side of the cloud as the trend you want to trade.
- Wait for price to come back to the line. The wick should reach it or poke slightly past it.
- Judge the close. The candle has to close back on the trend side of the Kijun-sen.
- Mark the low (or high) of the touch candle. Your stop goes a buffer beyond that wick, never on the line. Set the stop and lot size before you enter, and check that the target is bigger than the risk.
What makes a Kijun-sen touch valid, weak or broken
A valid touch has three parts. The line slopes with the trend, the cloud agrees, and the touch candle closes back on the trend side. A wick through the line doesn't count against the touch. The close is what you judge.
A touch is weak when the line has been flat for a long time and price keeps closing on both sides of it. Then the line is the middle of a range, not trend support. A simple rule: if price has closed on both sides of the line three or more times in the last 26 candles, treat the market as sideways and skip the touch.
A touch is also weak when the tools disagree. One example is a Kijun-sen sloping up while price sits below the cloud. That conflict is a reason to wait.
A touch is broken when a candle closes through the line and the next candle keeps going the same way. At that point, drop the pullback idea. Hoping price comes back is not a plan.
In the bullish version, price is above the cloud, the low dips to the Kijun-sen and the candle closes back above it. The bearish version is the mirror image: price is below the cloud, the high rallies to the line and the candle closes back below it.
Past example: EURUSD 1-hour pullback on 20 August 2026
This is a past example, not a prediction. The chart below redraws it from the recorded values. The two marked candles use the real prices, and the candles between them are simplified. The three lines show their values at 17:00 on 20 August.
At 17:00 on 20 August 2026, the Tenkan-sen read 1.16906 and the Kijun-sen read 1.16730. The cloud top was at 1.16094. Price, the Tenkan-sen and the Kijun-sen were all above the cloud, so all three agreed.
- Mark 1 (20 August 2026, 17:00): price pulls back to the Kijun-sen and holds. The low reaches 1.16708, which is 2.2 pips below the line (1.16730 − 1.16708). The candle closes back above it at 1.16829. This is the valid touch described above.
- Mark 2 (21 August 2026, 12:00, 1.17113): price is still rising above the cloud, about 28 pips above the touch candle's close.
Notice how deep the wick went. A stop sitting right on the Kijun-sen would have been hit by the very candle that confirmed the setup.
Trading a Kijun-sen pullback with real prices
Pullback bounce: EURUSD 1-hour, 20 August 2026
The entry, target and cloud level come from the chart above. The 5-pip buffer and the $100 risk are an illustrative example. They are choices for this walk-through, not rules.
- Entry: on the close back above the Kijun-sen, at 1.16829.
- Stop loss, choice A: 5 pips below the touch-candle low of 1.16708.
- Stop loss, choice B: the cloud top, 1.16094.
- Target: the next structure point, 1.17113 (mark 2).
The stop you pick changes the whole trade:
- Reward: 1.17113 − 1.16829 = 0.00284 = 28.4 pips.
- Stop A risk: entry to the wick is 1.16829 − 1.16708 = 12.1 pips. Add the 5-pip buffer: 12.1 + 5 = 17.1 pips. Reward ÷ risk = 28.4 ÷ 17.1 ≈ 1.7.
- Stop B risk: 1.16829 − 1.16094 = 0.00735 = 73.5 pips. Reward ÷ risk = 28.4 ÷ 73.5 ≈ 0.4.
The levels below show the problem at a glance. Stop B sits far below the entry, while the target sits close above it.
The stop also sets your position size. Say you risk $100, and one standard lot (100,000 units) of EURUSD is worth $10 per pip. Stop A gives $100 ÷ (17.1 × $10) ≈ 0.58 lots. Stop B gives $100 ÷ (73.5 × $10) ≈ 0.14 lots. Either way you risk the same $100. Only the lot size changes.
Decision rule: if the cloud stop is farther from your entry than the target is, use the buffered wick stop or skip the trade. Never tighten the stop onto the line itself to improve the ratio. That turns a normal probe into a loss.
When the Kijun-sen helps, and when to leave it alone
The Kijun-sen works best on trending charts, 1-hour and slower, when the cloud, the Tenkan-sen and the Kijun-sen all point the same way. Each new step in the trend direction means a fresh extreme has formed.
Leave it alone in a tight range and near the edge of the cloud. The formula is the same on every market. On very fast charts, though, it means little: on a 1-minute chart, 26 candles cover only 26 minutes.
| Pros | Cons |
|---|---|
| Flat shelves give you one fixed level to plan around | Lags by design, so it confirms after the move starts |
| Built from extremes, so one odd close doesn't drag it | Says nothing about momentum or volume |
| Steps in the trend direction confirm new highs or lows | Becomes a range midpoint in a sideways market |
| Same formula on any market | Covers too little time on very fast charts |
Practical tips for trading the Kijun-sen
- Before trusting a touch on a 1-hour chart, check the Kijun-sen slope on the 4-hour or daily chart.
- Size your stop buffer to the pair's normal wick size, not to a fixed habit. Deeper wicks need a wider buffer and a smaller lot.
- Watch the steps after the bounce. A fresh step confirms a new extreme. A long run with no step means the trend is slowing.
- If price is far from the line, wait for a pullback instead of chasing. The distance back to the line is risk you would carry.
- After a quiet-candle jump, check which old extreme expired before you read it as a new signal.
Quick pre-entry checklist
- Line slope, cloud and price all agree.
- Touch candle closed back on the trend side.
- Stop is a buffer beyond the wick, not on the line.
- Reward is bigger than risk with the stop you chose.
FAQ
Can I use the Kijun-sen as a trailing stop?
Yes. In a long trade, move your stop to a buffer below the Kijun-sen each time it steps up, or exit when a candle closes below it. This keeps you in a steady trend, but you give back part of the move when the trend ends.
Does the Kijun-sen change after a candle closes?
No. Values on closed candles stay fixed. The value on the candle that is still open can shift, because that candle can still set a new 26-candle high or low.
What happens if I shorten the Kijun-sen period?
The line hugs price more closely and steps more often. You get more touches, and more of them fail. A longer period gives fewer touches, puts the line farther from price and calls for wider stops.