Reversion Z-Score
Free MT5 Z-score oscillator with mean-reversion arrows, mean bands and a stats panel. Lab-tested on MT5 build 6230 with EURUSD M15 data.
- Repainted
- Not tested
- Signals / week
- —
- Tested on
- —
- Tested
- 2026-10-05
Overview
The Reversion Z-Score indicator for MT5 shows, in its own window, how many standard deviations each close sits from its 20-bar average. It also prints an arrow when a stretched move turns back toward that average. In the Lab's 3-month EURUSD M15 run, the strict defaults printed zero arrows, so this is a rare-signal tool. It helps patient traders who fade price extremes and want a few strict arrows rather than many loose ones.
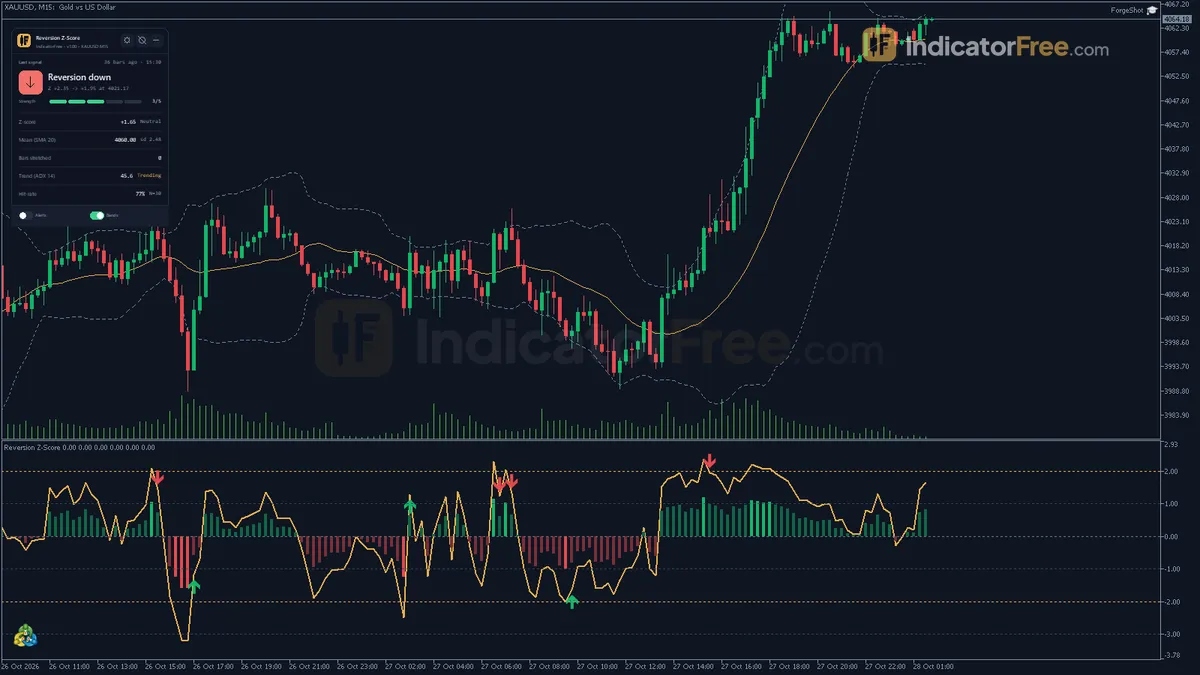
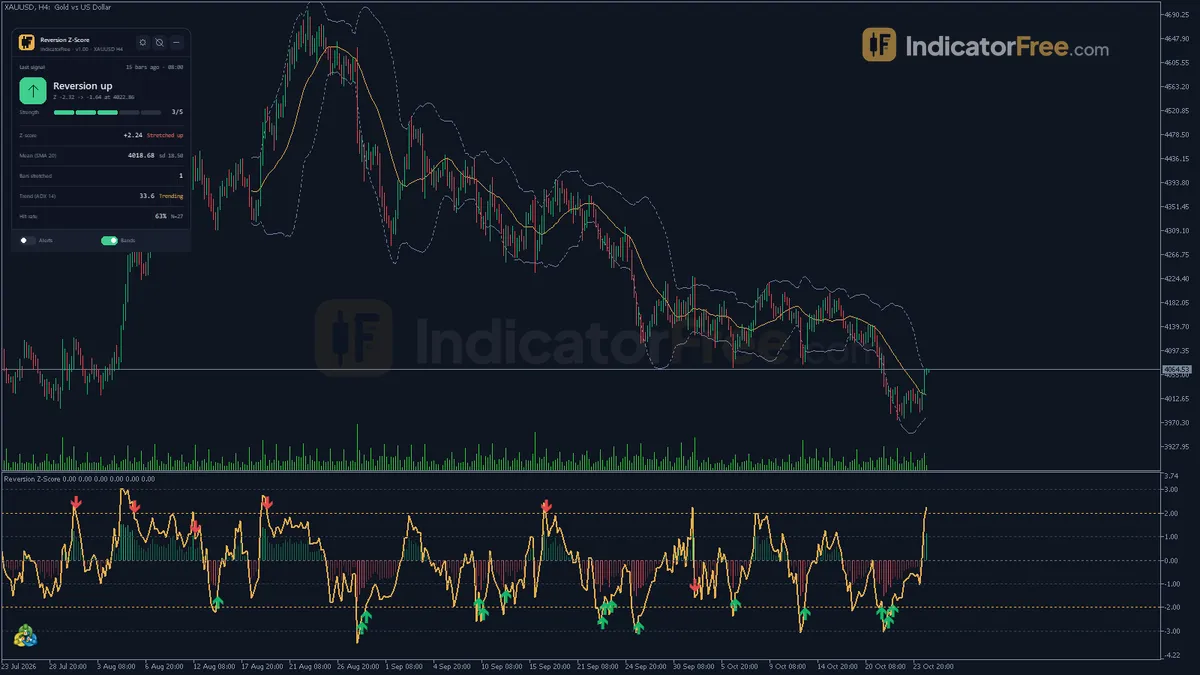
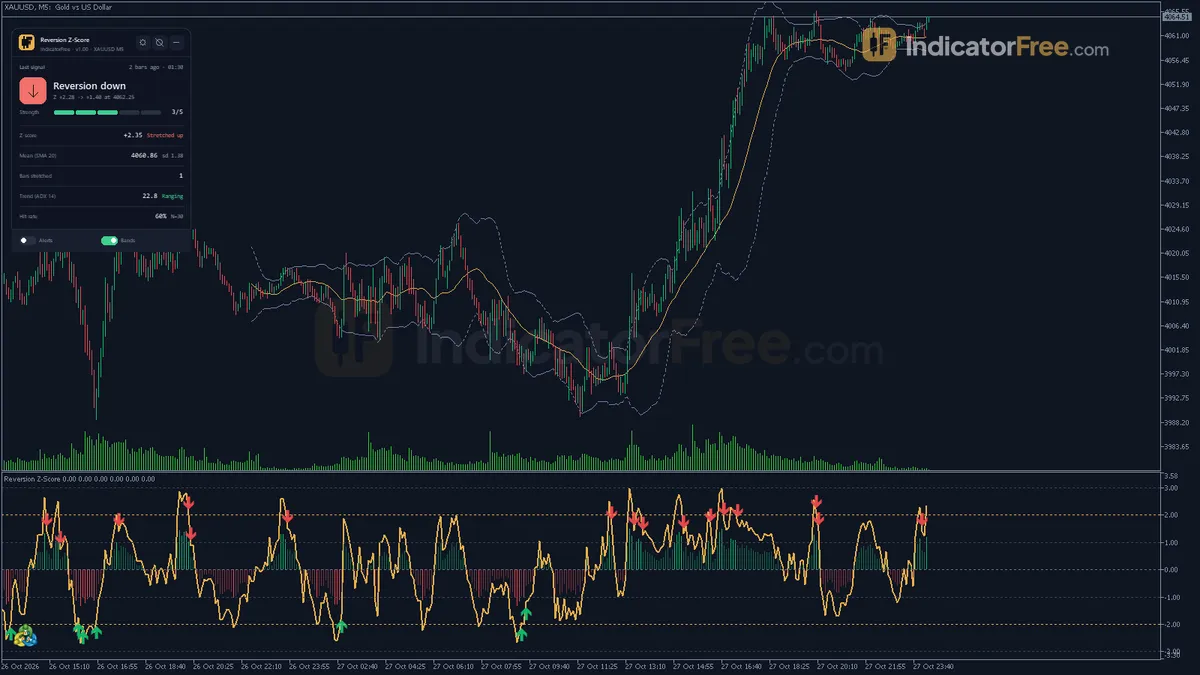
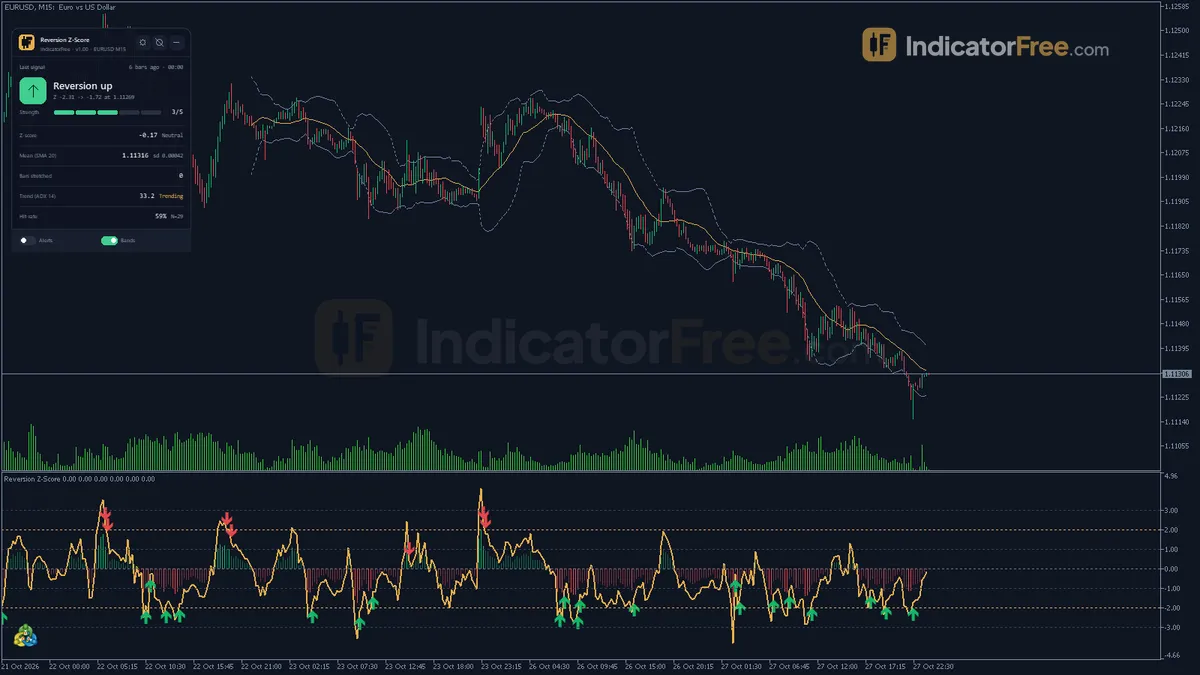
What it draws on your chart
A Z-score measures how far a value is from its average in units of standard deviation. Mean reversion is the idea that stretched prices tend to move back toward that average. The tool uses the plain formula Z = (Close − Mean) / StdDev, where the mean is an SMA over MR_Period bars.
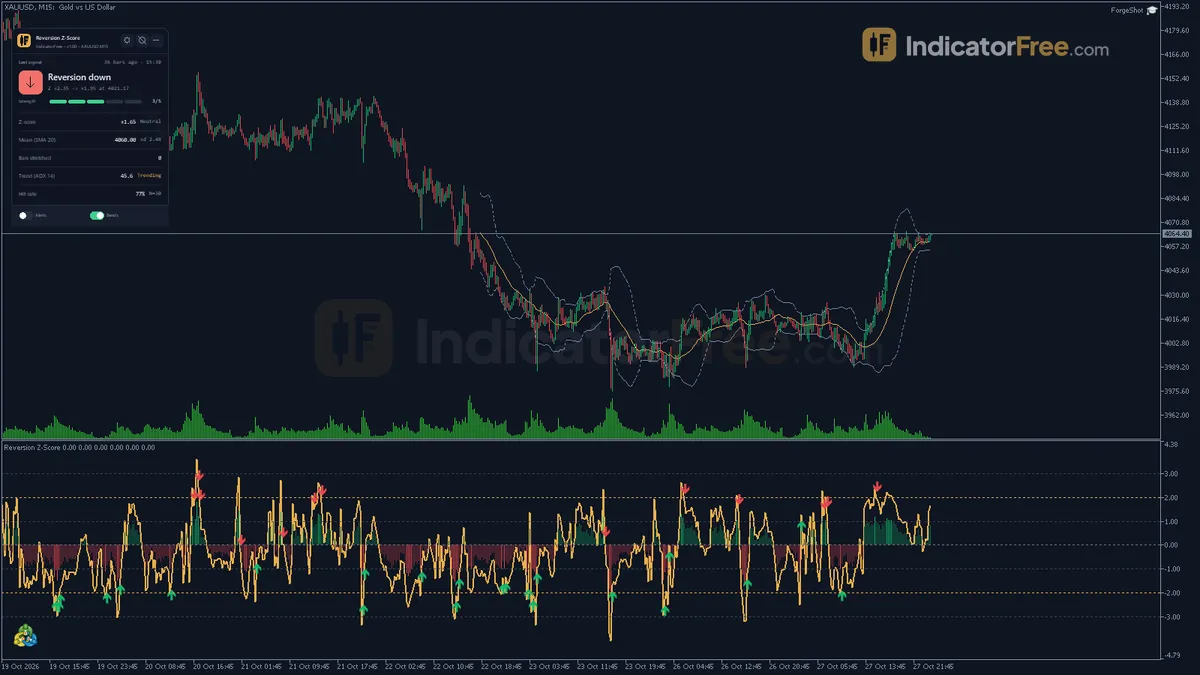
In the subwindow you get:
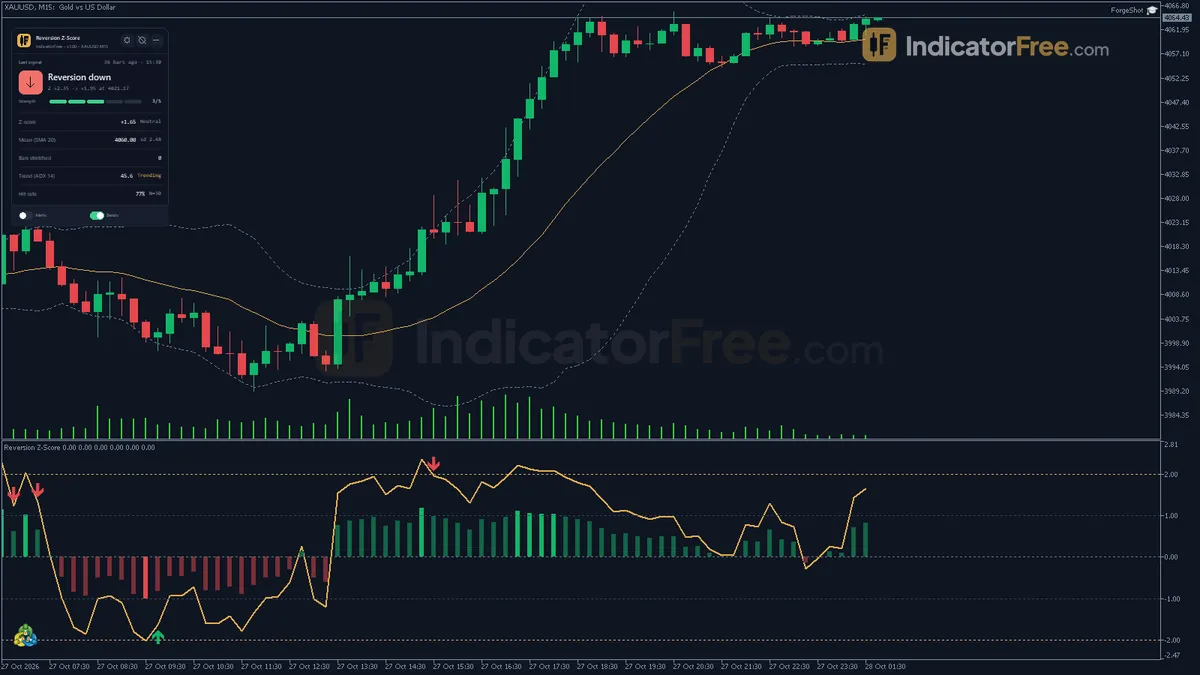
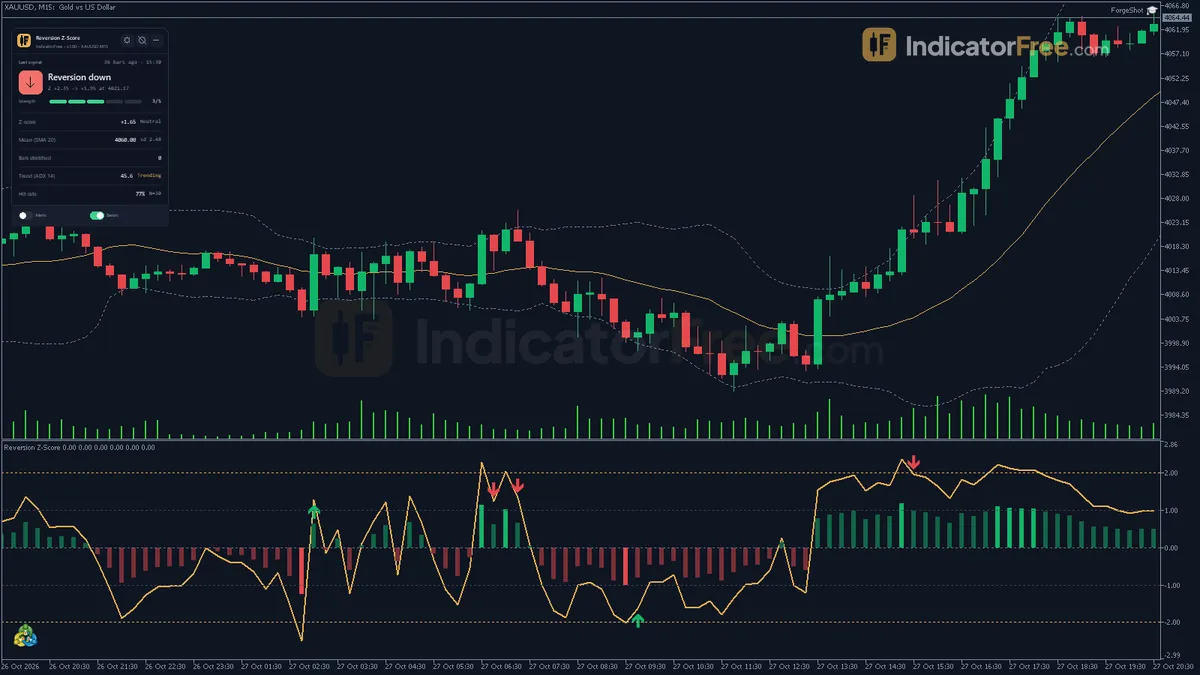
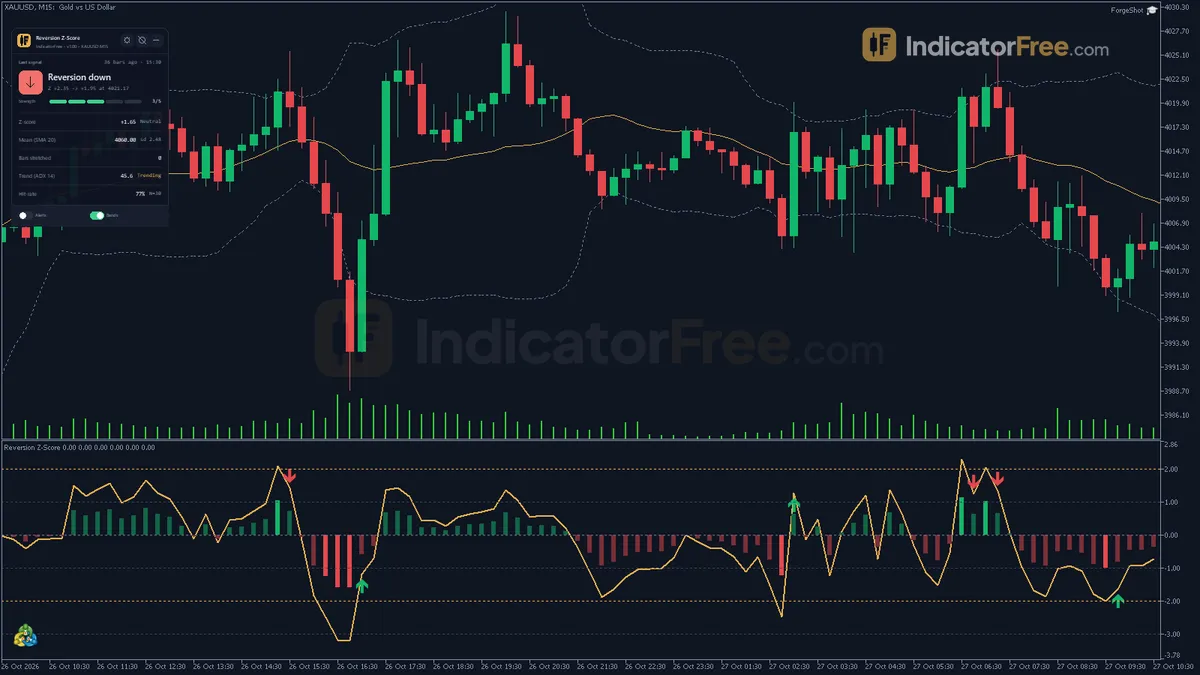
- Z-Score line: this line has no upper or lower limit. Dotted reference levels sit at 0, ±1, ±
StretchThreshold(2 by default) and ±3. - Stretch Severity histogram: positive bars mean the close is above the mean, and negative bars mean it is below.
- Four arrow types: Bullish Reversion and Bearish Reversion (confirmed mode), plus Early Stretch Down and Early Stretch Up (only when
RequireReversalConfirmis off).
On the main price chart you get:
- Mean Bands: trendline segments for the mean and for mean ± K × sigma. They cover the last
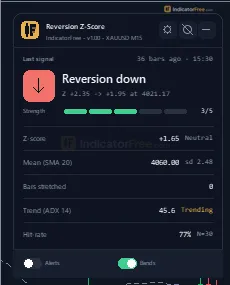
BandBarsclosed bars (300 by default). Older segments are deleted, and all segments are removed whenShowBandsis off or when you remove the indicator. - Status panel: shows the live Z-score, the stretch state and a historical hit-rate. How to read it is covered in the next tab.
What the Lab tested and what it means for you
The Lab tested version 1.00 (137.7 KB) on MT5 build 6230 on 2026-10-05. The repaint run used EURUSD M15 from 2026.07.06 to 2026.10.02 and produced no signals.
This has two practical consequences:
- No repaint count exists. No arrows appeared, so there was nothing to check for repainting. The arrow rules are written on closed bars (they compare the previous closed bar with the current closed bar), but that is how the tool is designed, not a measured result.
- Arrows can be very rare with the defaults. With both confirmations on and a threshold of 2, the repaint run recorded no signals over that period, which suggests the defaults fire rarely on this pair and timeframe. Before you rely on it, check how often it fires on your own symbol and timeframe.
Who it is for
It suits traders who already trade ranges or fade extremes and want a number instead of a guess about how stretched price is. The panel's hit-rate also helps you check whether price on your chart actually returns to the mean. It does not suit trend followers, traders who want daily signals, or anyone looking for a ready-made buy/sell system with a proven win rate.
To install, copy the Reversion Z-Score .ex5 file into your MT5 MQL5/Indicators folder (File → Open Data Folder), refresh the Navigator and drag it onto a chart. It opens in its own subwindow below the price chart.
How it works
- 1Takes the average and standard deviation of the last closes over the period.Inputs: MR_Period
- 2Z-score tells how many standard deviations the close is from the average.
Z = (Close - Mean) / StdDev - 3A bar is stretched when the absolute z-score reaches the threshold. Colour and stretch duration are tracked.Inputs: StretchThreshold
- 4With reversal confirmation, previous z must be beyond the threshold and moving toward zero, optionally with a matching candle.Inputs: RequireReversalConfirm, RequireCloseConfirm
- 5Without confirmation, the first cross beyond the threshold fires. Hit rate counts stretches returning near zero in the window.Inputs: StatsLookback, ReversionWindow, ReversionTarget
Specifications
- Platform
- MetaTrader 5
- Version
- 1.00
- Type
- Indicator
- Window
- Separate window
- Draws
- 1 line, 1 histo, 4 arrows, 1 zone, 1 panel
- Alerts
- popup, push, sound
- Repaints
- not tested
- Inputs
- 22
- Tested on
- MT5 build 6230 · 2026-10-05
Repaint test
Repaint: not tested. This indicator draws line, histo, arrow, zone, panel, which the IndicatorFree harness cannot read through iCustom().
IndicatorFree — tested 2026-10-05 · MT5 build 6230. Results come from historical data, not live trading, and do not guarantee future results.
What it draws
- A line (Z-Score) from buffer 0.
- A histogram (Stretch Severity) in a separate window.
- Arrows (Bullish Reversion) from buffer 3, drawn on the closed bar.
- Arrows (Bearish Reversion) from buffer 4, drawn on the closed bar.
- Arrows (Early Stretch Down) from buffer 5, drawn on the closed bar.
- Arrows (Early Stretch Up) from buffer 6, drawn on the closed bar.
- Rectangles (Mean Bands) drawn as chart objects, not buffers — they are not readable by iCustom() in an EA.
- An on-chart panel (Status); values shown in the panel are not exposed as buffers.
Inputs
| Input | Default | What it does |
|---|---|---|
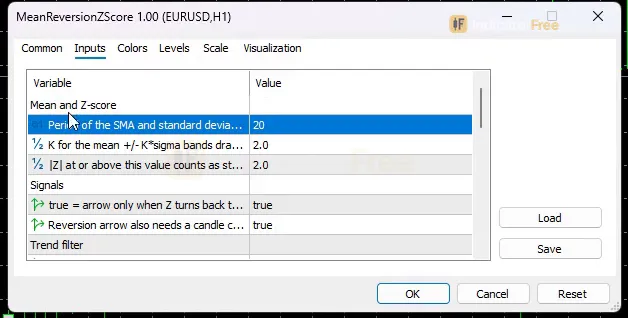
| MR_Period | 20 | Period of the SMA and standard deviation used for the mean and Z-score |
| MR_BandMultiplier | 2 | K for the mean +/- K*sigma bands drawn on the main chart |
| StretchThreshold | 2 | |Z| at or above this value counts as stretched from the mean |
| RequireReversalConfirm | true | true = arrow only when Z turns back toward 0; false = early arrow when Z first crosses the threshold |
| RequireCloseConfirm | true | Reversion arrow also needs a candle closing in the reversion direction (confirmed mode only) |
| UseADXFilter | true | Show a TRENDING warning on the panel when ADX is high (does not block arrows) |
| ADX_Period | 14 | ADX period |
| ADX_Threshold | 25 | ADX at or above this value is treated as a strong trend |
| StatsLookback | 500 | Closed bars scanned to count past stretches (clamped to available history) |
| ReversionWindow | 10 | Bars after a stretch starts in which |Z| must return to count as a hit |
| ReversionTarget | 0.5 | |Z| below this value counts as back at the mean |
| ShowBands | true | Draw mean and mean +/- K*sigma bands on the main chart |
| BandBars | 300 | Number of recent closed bars covered by the bands |
| EnableAlerts | false | Alert when a new arrow appears on a closed bar |
| AlertPopup | true | Show the MT5 popup alert |
| AlertPush | false | Send a push notification to the MT5 mobile app |
| AlertSound | false | Play a sound |
| AlertSoundFile | alert.wav | Sound file played when AlertSound is on |
| Theme | Dark | Chart color theme |
| RestoreTheme | true | Restore the original chart colors when the indicator is removed |
| PanelScale | 1 | Panel size multiplier (DPI is applied automatically) |
| PanelCorner | Left Upper | Chart corner of the panel |
How to read it
Reading the Z-Score line and the histogram
- Near 0: the close is at its average, so there is no stretch.
- Between ±1 (a dotted reference level): roughly normal noise around the mean.
- At or beyond ±
StretchThreshold: the bar counts as stretched. The panel tracks how many bars the stretch has lasted. - Beyond ±3 (a dotted reference level): roughly an extreme move. The line has no limit, so in a strong move it can keep going past 3. That is a warning sign, not a stronger buy or sell.
The histogram shows the same sign as the line in block form. Tall negative bars mean price is far below its mean, and tall positive bars mean it is far above.
The drawing below shows where each arrow type sits on the Z-Score line. It mixes both modes for comparison, which you will not see on a real chart.
The four arrows
- Bullish Reversion (buffer 3): the previous closed bar has Z at or below −
StretchThreshold, and the current closed bar's Z rises back toward zero. WhenRequireCloseConfirmis on, that bar must also close bullish. - Bearish Reversion (buffer 4): the mirror image. The previous closed bar has Z at or above +
StretchThreshold, and the current bar's Z falls back toward zero. WithRequireCloseConfirmon, that bar must close bearish. - Early Stretch Down / Up (buffers 5 and 6): these appear only when
RequireReversalConfirmis off. They fire on the first closed bar beyond the threshold. An early arrow tells you price has just become stretched, not that it has turned.
The flow below shows the steps behind one confirmed Bullish Reversion arrow.
- 1StretchA closed bar's Z is at or below -StretchThreshold (-2 by default)
- 2TurnThe next closed bar's Z rises back toward zero
- 3Candle checkWith RequireCloseConfirm on, that bar must close bullish
- 4ArrowBullish Reversion prints on the closed bar; an alert fires if EnableAlerts is on
The Status panel
The panel shows:
- the current Z-score and stretch state
- the mean and sigma
- how many bars price has been stretched
- an ADX trend warning
- a historical reversion hit-rate
The hit-rate looks back over the last StatsLookback closed bars (500, or fewer if your history is shorter). It counts how many stretches saw |Z| drop below ReversionTarget (0.5) within ReversionWindow bars (10) of the stretch starting.
Your own terminal calculates this hit-rate for the chart you are on. It is not a Lab result, and it changes with symbol, timeframe and settings.
Inputs to change first
StretchThreshold(2): this sets what counts as stretched and moves the ± dotted levels. A lower value gives more stretches and more arrows. A higher value gives fewer, more extreme ones.RequireReversalConfirm(true) andRequireCloseConfirm(true): these are your strictness switches. TurningRequireCloseConfirmoff drops the candle check. TurningRequireReversalConfirmoff switches to early arrows.MR_Period(20): sets the bars used for the mean and standard deviation. A longerMR_Periodmakes the mean and sigma react more slowly, so a sharp move shows up as a larger Z for longer.MR_BandMultiplier(2): this changes only the bands on the price chart, not the arrows. Keep it equal toStretchThreshold. Then a close outside the band is exactly the same event as a stretched Z.UseADXFilter(true),ADX_Period(14) andADX_Threshold(25): when ADX is at or above the threshold, the panel shows a TRENDING warning.StatsLookback,ReversionWindowandReversionTarget: these only change how the panel's hit-rate is counted.- Display inputs:
ShowBands,BandBars,Theme(Dark),RestoreTheme(puts your original chart colours back on removal),PanelScaleandPanelCorner.
Alerts
Alerts are off by default (EnableAlerts = false). When you turn them on, they fire when a new arrow appears on a closed bar. You can choose where they go:
AlertPopup: the MT5 alert window (on by default)AlertPush: the MT5 mobile appAlertSound: playsAlertSoundFile(alert.wav)
A decision rule for each arrow
This is our suggested filter, not a rule the Lab has tested.
Take a Bullish or Bearish Reversion arrow only if all three of these are true:
- The panel shows no TRENDING warning.
- The panel's hit-rate on this symbol and timeframe is above 50%. That cut-off is our own suggestion, not a Lab-tested value. It means most past stretches here did return to the mean.
- The bar that triggered the arrow did not push Z past ±3.
The hit-rate counts returns to within 0.5 sigma of the mean (ReversionTarget), so a target near the mean line matches what it measures.
Treat Early Stretch arrows as a heads-up only. Wait for the Reversion arrow, or for your own turn signal, before acting.
The common misread: the mean catching up
Z can return to zero in two ways: price falls back to the average, or the average rises up to meet price. In a slow trend the second case is common, and the oscillator looks like a reversion even though price never came back.
To spot it, look at the mean band on the price chart. If the mean line is sloping steadily toward price while candles hold their level, the "reversion" is the average catching up. It is not a fade you could have traded.
Installation
- 1Download MeanReversionZScore.ex5 from the button above (Google Drive).
- 2In MetaTrader 5: File → Open Data Folder → MQL5 → Indicators. Copy MeanReversionZScore.ex5 there.
- 3Restart MT5 or right-click Indicators in Navigator → Refresh.
- 4Drag Reversion Z-Score onto a chart. For push alerts, enable "Allow push notifications" under Tools → Options → Notifications.
- Tested on MT5 build 6230.
Key terms and guides
- Mean reversion
- Mean reversion is the idea that when price moves far from its average, it tends to drift back toward it. Traders buy stretches below the average (bullish) or sell stretches above it (bearish), with the average as the target.
- Simple moving average
- A simple moving average (SMA) is the average closing price of the last n candles, drawn as one line on the chart. Traders use it to read trend direction, time pullback entries and build crossover signals.
- Win rate
- Win rate is the share of your closed trades that ended in profit: winning trades divided by total trades, times 100. On its own it does not show whether a strategy makes money, because it ignores how big the wins and losses are.
- Trend line
- A trend line is a straight line drawn across rising swing lows or falling swing highs. Traders use it to read the direction of a trend, time entries when price comes back to it and spot when a trend is failing.
- Trend
- A trend is the main direction price keeps moving in over a period. In an uptrend price makes higher highs and higher lows. In a downtrend it makes lower highs and lower lows.
- Market Noise
- Market noise is the small, random back-and-forth price movement that has no lasting direction. It comes from routine buying and selling, not from a real change in what traders think an asset is worth.
More on this subject: Oscillators & momentum guide, terms and tools
User reviews
No reviews yet. Members who download the tool can review it here.
Sign in and download the tool to review it.
Build a checklist with it
Reversion Z-Score does one job on the chart: entry signal. Put it on the same chart as the tools below and the IndicatorFree panels merge into one checklist card, ordered trend, zone, signal, risk.
- Trend / contextMoving Average FlowReversion Z-Score tells you when; this tells you which way the market leans, so you can skip signals against it.
- Zone / levelKey Level MapShows the zones and levels, so you can see whether a signal from Reversion Z-Score fires at a level worth trading.
The Lab has not tested these combinations. Each tool is tested on its own; the card only lines up what each one says. Free members get 2 new tools a day. If one has to wait until tomorrow, install BlackBox to raise the limit to 5 a day (20 on a live account).
FAQ
Does Reversion Z-Score repaint?
Repaint: not tested. This indicator draws line, histo, arrow, zone, panel, which the IndicatorFree harness cannot read through iCustom().
Can I use Reversion Z-Score in an EA?
Yes. Read buffer 3 (Bullish Reversion) with iCustom() on bar 1 — the last closed bar.
Why can’t my EA read the zones?
Zones and the panel are chart objects, not indicator buffers, so iCustom() does not return them.
How do I get alerts on my phone?
Enter your MetaQuotes ID under Tools → Options → Notifications, tick "Enable push notifications", and keep the push alert input on.
Why does it open in a separate window?
It plots values on their own scale, so MT5 draws it below the price chart.
Which timeframes and pairs can I use Reversion Z-Score on?
It runs on any MT5 symbol and timeframe. The Lab's screenshots show it on M5 and H4 as well as EURUSD, but only EURUSD M15 went through the test run. Check the panel's hit-rate on each chart before you trust its arrows there.
Why did I get no arrows on my chart?
With both confirmation switches on and StretchThreshold at 2, an arrow needs Z to reach ±2 and then turn back on the next closed bar, which can take a long time on some charts. If the panel's bars-stretched count stays at zero, price has not reached the threshold yet. StretchThreshold and the two strictness switches are what control how often arrows appear.
Will it change my chart colours permanently?
The Theme input (Dark by default) recolours the chart while the indicator is attached. With RestoreTheme left on true, your original colours come back when you remove it.
Can an Expert Advisor read its values?
Yes. The Z-Score line is in buffer 0 and Stretch Severity is in buffer 1. Bullish and Bearish Reversion are in buffers 3 and 4, and Early Stretch Down and Up are in buffers 5 and 6.
Does the ADX filter stop arrows?
No. UseADXFilter only shows a TRENDING warning on the panel. Arrows still print during a trend, so you have to decide whether to skip them.
Changelog
- 1.00Initial release: unbounded Z-score oscillator (close vs. SMA in standard deviations) in its own window, with a signed stretch-severity histogram and dotted reference levels at 0, +/-1, +/-StretchThreshold and +/-3. · 2026-10-09
Final verdict
The Lab's judgement
Reversion Z-Score is a clean, transparent oscillator. Every arrow follows a written rule on closed bars. The two confirmation switches let you choose between catching a stretch early and waiting for the turn. Its most useful feature is the panel's hit-rate, because it shows whether stretches on your chart actually return to the mean before you risk anything on one.
What the Lab cannot give you is a win rate. Its only measurement is the EURUSD M15 repaint run, which produced no arrows, so there is no evidence either way on how well the arrows work. Treat it as a tool for measuring stretch and timing a fade you already planned, not as a signal generator you follow blindly.
Limits to know before you download
- With the defaults it can stay silent for long periods, so it is not a tool for frequent trading.
- The Z-score has no ceiling. In a strong move it can stay stretched for many bars, and each new extreme can look like an opportunity when it is not.
- The panel's hit-rate depends on recent history (500 bars by default). It describes the past on that chart and does not guarantee the next stretch.
- Only one symbol and timeframe (EURUSD M15) went through the Lab run. Other markets are untested.
The comparison below sums up when the tool fits and when to leave it off.
- –The panel shows no TRENDING warning
- –The panel hit-rate on your chart is above 50% (our cut-off, untested)
- –You trade back to the mean line and can wait days for a setup
- –You want a number for how stretched price is, not a guess
- –Z keeps pushing past +3 or -3 while ADX warns of a trend
- –The mean line is chasing price instead of price returning
- –You need several signals a week
- –You want a Lab-tested win rate before risking money
Settings to start with
- Week one: keep the defaults. Turn on
EnableAlertswithAlertPopupso you do not need to watch the subwindow. Check the panel's bars-stretched count and hit-rate during that week, so you can see the tool is working even before any arrow appears. - Keep
MR_BandMultiplierequal toStretchThreshold. That way the bands on the price chart and the arrows describe the same stretch. - If arrows almost never appear on your timeframe, try
RequireCloseConfirm= false. This is not tested by the Lab, so compare its arrows with the default for a few weeks. - If you want to see stretches as they start, set
RequireReversalConfirm= false and treat the early arrows as alerts to watch, not entries. This is also not tested by the Lab.