









Mean reversion
Also called Reversion to the mean, Mean reversion strategy, Fading the move, Regression to the mean
Mean reversion is the idea that when price moves far from its average, it tends to drift back toward it. Traders buy stretches below the average (bullish) or sell stretches above it (bearish), with the average as the target.
The key word is "tends". A stretched price can keep stretching, so every mean reversion trade needs a stop and a rule for what counts as "too far". If you get those two wrong, one trend that never comes back can wipe out a long run of small wins.
What "the mean" and "too far" look like on a chart
The mean is an average of recent prices. Most often it is a moving average such as the 20-period simple moving average (SMA 20). The average moves with the market, so your target moves too.
"Too far" needs a yardstick that you choose before the trade. There are three common choices. The first is an envelope: lines set a fixed percentage above and below the average. The second is a band that widens and narrows with volatility. The third is an oscillator such as RSI reaching 30 or 70.
The idea is the same in forex, stocks and futures, on any timeframe. Day traders use it on 5-minute or 1-hour stretches inside one session. Swing traders use daily charts. What changes is how far "far" is and how long the return takes.
Checklist: is this a real mean reversion setup?
- Pick the average and the stretch measure before you look for trades. For example, an SMA 20 with a 0.2% envelope, or RSI below 30.
- Price reaches or crosses the stretch line.
- The average is flat or gently sloped. It is not rising or falling steeply.
- The stretch candle shows a slowdown: a long wick, a smaller body, or a next candle that fails to push further.
- The distance back to the average is larger than your stop distance.
- No major scheduled news is due before you expect the return.
When a stretch is valid and when it is broken
A valid stretch happens inside a range or a mild trend. Price spikes to the band, then the other side steps in and the next candles stop making new extremes. The average stays roughly level, so your target does not run away from you.
A broken stretch is the start of a trend. Price closes outside the band candle after candle. The average turns sharply in the same direction, and each bounce is weaker than the last. News that changes the outlook, such as a rate decision, also breaks the setup, because the old average no longer shows fair value.
The most common misread is "oversold means it must bounce". The chart below shows the opposite: RSI drops under 30 early and stays there while price keeps sliding. Oversold describes the stretch. It does not mark the turn.
How to spot it: if RSI stays under 30 for several candles and price keeps making lower lows, you are looking at momentum, not a stretch. Wait for a close back above 30, or skip the trade.
The EURUSD example: from the lower envelope back to the SMA 20
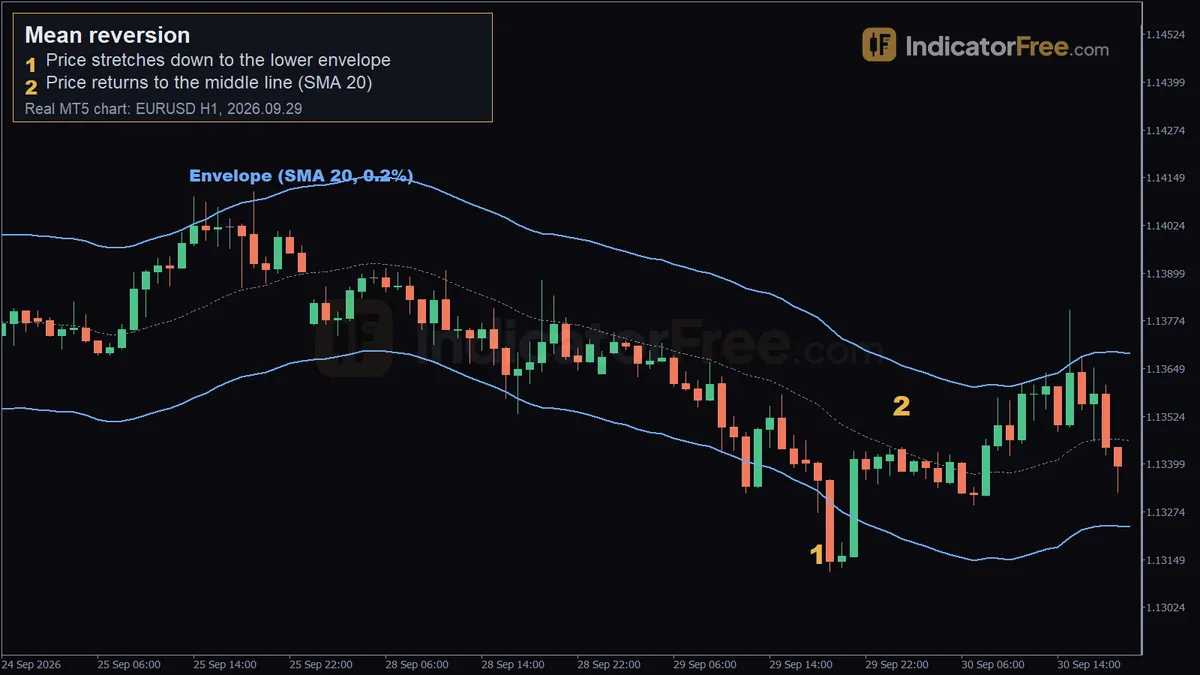
The chart at the top of the page is a past 1-hour EURUSD example, not a prediction. It shows an SMA 20 with envelopes 0.2% above and below it.
Marker 1, the stretch. On 2026.09.29 at 18:00 the low reached 1.13272. That went through the lower envelope at 1.13329, so price was more than 0.2% below its 20-hour average.
Marker 2, the return. By 2026.09.30 at 01:00 price touched and closed just above the SMA 20 at 1.13431; the marker sits at 1.13443, about 17 pips above the low. The return took seven 1-hour candles.
Applied to the setup rules below, the entry comes after the 18:00 stretch candle closes and the next candle fails to make a new low. The stop goes a few pips under 1.13272, and the target is the SMA 20 at 1.13431.
Notice that the average itself was the natural target. A trader who aimed far beyond it was betting on a new trend, not a reversion.
How rare is "stretched"? What the Lab counted on RSI
The IndicatorFree Lab counted RSI extremes on 12 months of broker demo data: EURUSD 1-hour, 2025-10-02 to 2026-10-02, 6222 candles. This is past data, not a forecast.
With RSI(7), price moved below 30 about 25 times per month and spent 12.6% of candles there. That is roughly one candle in eight. With RSI(14), the count was 7.2 times per month and 4.6% of candles. With RSI(21), it was 3.6 times and 2.4%.
Decision rule: a reading that shows up on one candle in eight is not an extreme. If you want fewer, deeper stretches, use the longer period, and treat a short-period RSI reading as a warning only. For reference, the MT5 default RSI is period 14, applied to Close.
Setting entry, stop and target on a mean reversion trade
- Entry: wait until the stretch candle closes and the next candle fails to make a new extreme. Buying into a falling candle is guessing.
- Stop loss: a few pips beyond the stretch extreme. If price gets there, the stretch has turned into a trend.
- Target: the average itself. Check it again on each candle, because it moves toward price while price moves toward it.
Here is an illustrative example with round numbers. You have a $10,000 account and you risk 1%. EURUSD stretches below its lower band and you buy after the stretch candle. Your stop sits 20 pips below your entry, beyond the low. The SMA 20 sits 30 pips above your entry. On a USD-quoted pair, one standard lot (100,000 units) is worth $10 per pip.
Here the reward is 1.5 times the risk. If the average had been only 15 pips away, the reward would be smaller than the risk, and checklist step 5 says skip the trade.
When to trade mean reversion and when to stand aside
It works best in ranges, in quiet sessions, and on pairs that have moved sideways for days. It works badly around major news, right after a breakout from a long range, and in markets that trend hard.
| Aspect | Pros | Cons |
|---|---|---|
| Target | Clear: the average | Moves while you wait |
| Stop | Natural place: beyond the extreme | Hit hard when a trend starts |
| Frequency | Many setups in ranges | Few clean setups in trends |
| Psychology | Buys low, sells high | Feels like catching a falling price |
Tips before you fade a stretched move
- Never add to a losing reversion trade to get a better average price. Your stop is the plan.
- Check the slope of the average on a higher timeframe. If the daily trend runs in the same direction as the stretch, skip the trade.
FAQ
How long should I wait for price to return to the average?
Set a time limit in candles before you enter. If price has not come halfway back by then, close the trade or tighten the stop. A practical limit is about twice the typical return time you have seen on that chart.
Can I use mean reversion on gold?
You can, but first check whether the market has been stretching more in one direction. In the Lab count for XAUUSD 1-hour (2025-10-02 to 2026-10-02, 5917 candles; past data, not a forecast), RSI(14) spent 8.3% of candles above 70 but only 5.2% below 30. A lopsided split like this is a warning that price may be trending; check the slope of the average before you sell an upside stretch.