









Bearish divergence
Also called Negative divergence, Regular bearish divergence, Bearish RSI divergence, Bearish MACD divergence
Bearish divergence is when price makes a higher high but a momentum oscillator such as RSI or MACD makes a lower high. It warns that buying pressure is fading before price turns down.
You usually see it right after a breakout to a new high, when buying feels safest. Spotting it can stop you from adding to a long trade that is losing strength. It also gives a short trade a clear place for its stop: just above the second high.
How to spot bearish divergence, step by step
- Put a momentum oscillator under your price chart. RSI, MACD and Stochastic RSI all work.
- Find an up-move with two clear swing highs. A swing high is a candle whose high is above the highs of the candles on both sides of it.
- Check that the second price high is above the first. A small margin is enough.
- Read the oscillator on the same two candles as the price highs. Do not use the oscillator's own nearest peak.
- Confirm that the oscillator's second reading is clearly lower than its first.
- Mark the lowest point of the pullback between the two highs. Treat the pattern as a trade signal only after a candle closes below that level.
The drawing below is an illustrative example, not market data. Price makes a first high with RSI at 76, dips, then pushes a little higher. On that higher high, RSI only reaches 69. The signal comes two candles later, when a candle closes just below the pullback low.
What makes a bearish divergence valid or weak
A usable divergence comes after a real rally, so there is momentum to lose. The two highs are separate swings with a visible pullback between them, and anyone looking at the chart would pick the same two candles. The price gap between the highs can be tiny. The oscillator gap cannot. You should see it at a glance.
A weak divergence has highs that sit side by side inside normal noise, or oscillator readings only a point or two apart. It is also suspect inside a fast trend, where the oscillator can stay high and wobble while price keeps climbing. And until a candle closes below the pullback low, the divergence is unconfirmed, however clear it looks.
The most common misread comes from skipping step 4. Oscillators often peak a candle or two before or after price does. If you compare the oscillator's own peaks instead of its readings on the price-high candles, you can find a divergence that is not there. Measure both price highs the same way, too: wick to wick or close to close, never one of each.
Selling a confirmed bearish divergence
Entry, stop and target on the drawing above
This trade uses the illustrative drawing. Sell at the close of the candle that breaks below the pullback low. Do not sell on the second high itself; at that point the pattern is only a warning. In the drawing, that entry close sits 20 pips below the second high. Put the stop loss two pips above the second high. If price trades there, the market has made a new high and the idea has failed. The 0.10 lot size and the 1.5-to-1 target are a teaching choice.
In the drawing, the last candle trades through the target, four candles after entry. The arithmetic matters more than the outcome. Confirmation costs you part of the move, because the entry sits below the pullback low and the stop sits above the high.
Use this decision rule before every entry. Measure the distance from your entry to your stop, then from your entry to the next clear support below. If that support is less than 1.5 times the stop distance away, skip the trade. Or look for a tighter swing high on a shorter timeframe to place the stop.
Protecting a long trade you already hold
If you are already long when the divergence appears, you do not have to close the trade. Move your stop to just below the pullback low, or take partial profit. If price then closes below that level, you exit with most of your gain. If the rally carries on, you are still in it.
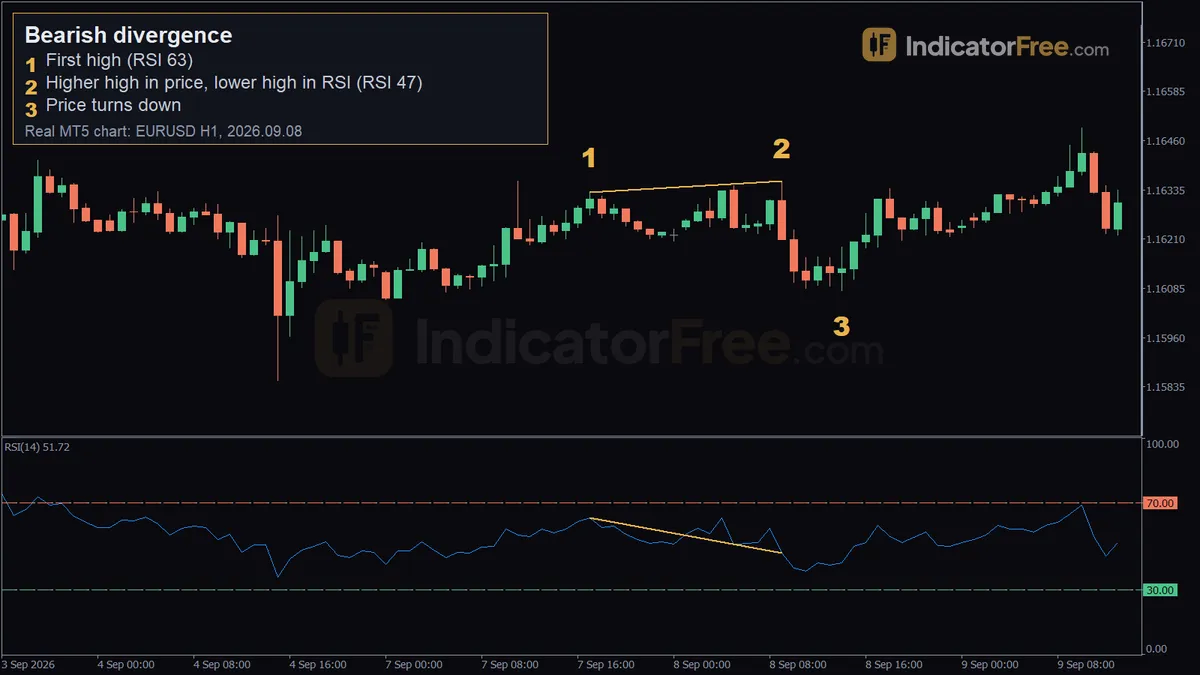
A past EURUSD 1-hour bearish divergence, point by point
This is a past EURUSD 1-hour case, not a prediction.
- Point 1, first high. On 2026.09.07 at 17:00, price topped at 1.16329 with RSI at 63.2.
- Point 2, higher high in price, lower high in RSI. Sixteen 1-hour candles later, at 09:00 on 2026.09.08, price reached 1.16358. That is 2.9 pips above the first high (1.16358 − 1.16329 = 0.00029). RSI read 47.0, which is 16.2 points lower (63.2 − 47.0).
- Point 3, price turns down. At 14:00 on 2026.09.08, five candles after the second high, price was at 1.1608.
This case teaches two things. First, RSI never reached 70 at either high. Divergence compares two oscillator readings with each other, so it does not need an overbought reading first. A 2.9-pip higher high against a 16.2-point drop in RSI is the shape you want: a tiny price gap, a large oscillator gap.
Second, the speed. Price fell about 28 pips over the 20 candles after the second high. By point 3 it was already 27.8 pips below that high (1.16358 − 1.1608). When the drop is this fast, a trader waiting for confirmation may find most of the move gone. That is exactly when the decision rule above applies. Measure the room left to the next support, and skip the trade if it is too small.
When bearish divergence works, and when to skip it
It reads best after a long, steady rally that has stretched far from its recent range. It also helps when the second high runs into a level that has capped price before. On 4-hour and daily charts the swing highs are cleaner and easier to agree on.
Skip it in strong trends driven by news or a central bank theme, where momentum can fade for days while price keeps rising. Skip it in tight ranges, where every high looks the same. And skip it just before high-impact data, when price can jump past your stop no matter what the oscillator shows.
| Pros | Cons |
|---|---|
| Warns of fading momentum before price turns | Can appear early and be ignored for many candles |
| The second high gives a clear stop level | Confirmation entries can leave little room to a target |
| Works with RSI, MACD or Stochastic RSI, in any market | Swing highs are open to debate on noisy charts |
Bullish divergence vs bearish divergence, and the hidden version
Bullish divergence is the mirror pattern: price makes a lower low while the oscillator makes a higher low, warning that selling is fading. Hidden bearish divergence is a separate pattern traders use to join an existing downtrend: price makes a lower high while the oscillator makes a higher high. Both have their own glossary entries, and RSI divergence covers the pattern on RSI alone.
Practical tips for trading bearish divergence
- Draw a line across the two price highs and another across the two oscillator readings. If the lines don't point in opposite directions, there is no divergence.
- Check a second oscillator. A lower MACD high together with a lower RSI high is a stronger warning than either one alone.
- Look at the next timeframe up. If that chart is still trending up, expect a pullback rather than a reversal, and take profit sooner.
- Size the trade from the stop distance, not from a fixed lot. A wide stop above the second high means a smaller position.
Quick checklist
- Second price high above the first, both measured the same way.
- Oscillator lower on the second high's candle, by a clear margin.
- Candle close below the pullback low before you sell.
- Stop above the second high, and room to support of at least 1.5 times the stop distance.
FAQ
Does bearish divergence work on crypto charts?
Yes. The pattern compares price with an oscillator, so the same steps apply to Bitcoin or any crypto pair. Crypto trades around the clock and can spike, so compare closing highs and wait for a candle close below the pullback low.
How do I read bearish divergence on MACD?
Compare the MACD line, or the histogram bars, on the two price-high candles. Pick one and stick to it, because the line and the histogram can peak at different times and give different answers.
What should I do when a bearish divergence fails?
If price trades above the second high, take the loss at your stop. Don't widen the stop or add another short. The first idea is finished. If the new high comes with a still-lower oscillator reading, treat it as a new setup that needs its own close below a new pullback low.