









RSI divergence
Also called RSI divergence trading, bullish RSI divergence, momentum divergence, RSI price divergence
RSI divergence is when price makes a new high or low but the RSI oscillator moves the opposite way instead of confirming it. It warns that the momentum behind the move is fading.
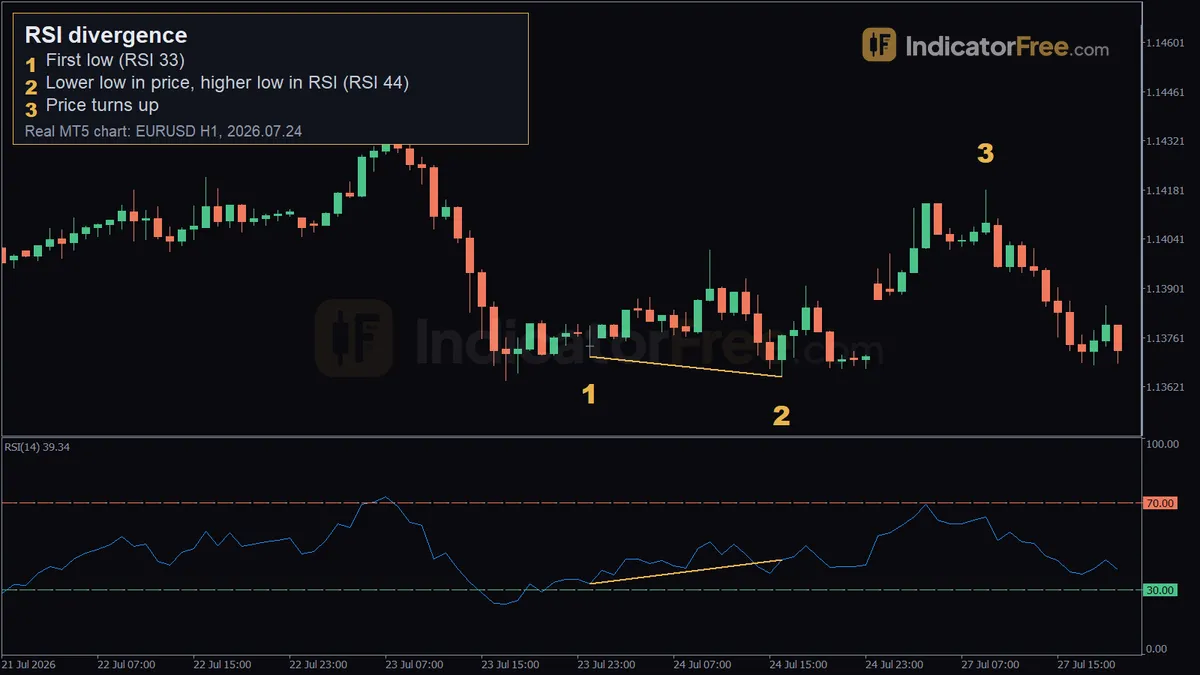
Divergence shows up while price still looks strong. If you spot it, you are less likely to buy the last leg of a tired rally or sell into a stretched drop. It also gives you a nearby swing to put your stop behind. On its own, though, it is only a warning, not an entry.
How to spot RSI divergence: a 6-step checklist
The MT5 default for RSI is period 14, applied to Close. Whatever setting you choose, keep it the same so your readings can be compared.
- Mark two price swings in the same direction. Use two lows for a bullish case or two highs for a bearish one, with several candles between them.
- Read the RSI value on the same candle as each price swing. Do not use RSI's own lowest or highest point a few candles away.
- Compare the two pairs. A lower low in price with a higher low in RSI is bullish divergence. A higher high in price with a lower high in RSI is bearish divergence.
- Check that at least one RSI reading sits near an extreme: below 30 or above 70.
- Wait for a price trigger. This can be a close back beyond the first swing, a broken short-term trendline, or RSI crossing back through 50.
- Check the next higher timeframe. A bullish divergence on a 1-hour chart inside a steep 4-hour downtrend is a weaker case.
What makes an RSI divergence valid, weak or broken
A divergence is valid when the two swings are clearly separated and the two RSI readings differ by a visible margin. At least one reading should be near 30 or 70. You can only trade it once price confirms it with a close beyond a recent swing.
It is weak when the swings are only a candle or two apart, because that is noise rather than structure. It is also weak when both RSI readings sit in the 40–60 midrange. A single news candle that throws RSI to an extreme and snaps back is not a real swing.
It is broken when price takes out the second swing before your trigger appears. Strong trends often print a third and a fourth low while RSI keeps rising. Cancel the setup and wait for a fresh pair of swings.
The most common misread is getting step 2 wrong. Traders match RSI's lowest point with a price low that formed several candles later. Always read RSI on the candle that made the price swing.
Your RSI period changes how many candidates you see. On EURUSD 1-hour data from 2025-10-02 to 2026-10-02 (6,222 candles, broker demo data), RSI(7) dropped below 30 about 25 times per month. RSI(14) did so 7.2 times and RSI(21) 3.6 times. This is past data, not a forecast. A shorter period gives you more divergences and more noise. Pick one period and keep it, because switching periods to find a divergence is curve fitting.
Reading the EURUSD 1-hour divergence marker by marker
The real 1-hour chart at the top of this page is a past EURUSD example, not a prediction. The chart below is an illustrative redraw of it. The three marked candles carry the real prices and RSI readings. The candles in between are simplified, and there are fewer of them than on the real chart.
- First low: 2026.07.24 00:00, price 1.13707, RSI 32.8. RSI is close to oversold, so the checklist's extreme rule is met.
- Lower low in price, higher low in RSI: 2026.07.24 16:00, price 1.13649, RSI 43.7. Price went 5.8 pips lower, but RSI rose almost 11 points. Sellers pushed price lower with less force, and that opposite movement is the divergence.
- Price turns up: 2026.07.27 09:00, price 1.14181. That is 53 pips above the second low, reached over the next 20 candles.
On the real chart, the two lows are 16 one-hour candles apart, which is plenty of separation. The redraw squeezes that gap to fit. Until a candle closed back above 1.13707, this was only a warning. One past chart says nothing about the next divergence on EURUSD.
Entry and exit on the EURUSD bullish divergence
Setup: buying the close back above the first low
The order levels below are an illustrative example built on the real prices above. The real chart gives the two lows and the turn, but not the close of the candle that reclaimed 1.13707. So the example works in pips from those real levels and assumes the trigger candle closes 5 pips above the first low.
- Entry: buy at the close of the first candle that closes back above 1.13707. A rule based on a close always fills above the first low, never exactly on it. In this example, that close is 5 pips above it.
- Stop loss: 3 pips under the second low at 1.13649. If price trades there, a third lower low has formed and the divergence has failed.
- Target: 1.14181, where price turned next. You can also take part of the profit there and trail the rest.
The calculation below turns those levels into pips and money. A 0.10 lot (10,000 units) on EURUSD is worth $1 per pip.
Here the room to the target is about three times the risk. A large trigger candle closes further from the low, which raises the risk and shrinks the room. Redo these steps with your actual fill. If the stop distance is larger than the room left to the next level, skip the trade, however clean the divergence looks.
When RSI divergence works and when to skip it
You read divergence at RSI extremes, so it matters how often a market reaches them. From 2025-10-02 to 2026-10-02, on 1-hour charts of broker demo data:
- EURUSD (6,222 candles): RSI(14) spent 4.6% of candles below 30 and 4.7% above 70.
- XAUUSD (5,917 candles): RSI(14) spent 5.2% below 30 and 8.3% above 70.
This is past data, not a forecast. Gold visited the overbought zone more often, so it offered more bearish candidates to check. That says nothing about whether any of them worked.
Divergence reads best after an extended move, in slowing or ranging markets, and on 4-hour or daily charts where swings are cleaner. It misleads inside fast trends, on 1-minute and 5-minute charts, and around news releases.
| Pros | Cons |
|---|---|
| Warns of fading momentum before price structure breaks | Can repeat several times before price turns |
| Gives a nearby swing to place a stop behind | Needs a separate price trigger to act on |
| Works on any market; cleaner on 4-hour and daily | Weaker against the higher-timeframe trend |
| Quick to check once swings are marked | Two traders may pick different swings |
Bullish and bearish RSI divergence
Bullish RSI divergence is the version traded above: a lower low in price with a higher low in RSI near the end of a fall. Bearish divergence is the mirror at the top of a rally, with a higher high in price and a lower high in RSI. It has its own glossary entry. Hidden divergence, which points to trend continuation rather than a reversal, is a separate concept.
Practical tips for trading RSI divergence
- Mark the price swings with horizontal lines before you look at RSI, so the oscillator does not bias which swings you choose.
- Write down the cancel level (the second swing) before you enter. Once price trades through it, the idea is gone.
- Expect fewer setups on higher timeframes. On EURUSD 4-hour, RSI(14) dropped below 30 only 2.4 times per month from 2025-10-02 to 2026-10-02 (1,556 candles, broker demo data; past data, not a forecast).
- Skip divergences that form in the hour before a scheduled news release. The swing may not survive the release.
- Log every divergence you mark, including the ones that never triggered. Over time, your log shows how often your own swing choices pay off.
Quick checklist before you click buy or sell:
- Two clear swings, RSI read on the swing candles, one reading near 30 or 70.
- A trigger close has printed beyond the first swing.
- Your stop sits behind the second swing plus a buffer.
- The room to the next level is larger than your stop distance.
FAQ
Should I close a winning trade when RSI diverges against it?
Not automatically. Treat it as a cue to tighten your stop or take partial profit. Close the trade when price breaks a swing against you.
Can a divergence indicator find these setups for me?
Yes. Divergence tools draw lines between swings for you. They need a few candles after a swing to confirm it, so a line can appear late or change while the swing is still forming. Check the swings yourself and still wait for the price trigger.
How long should I wait for the trigger before giving up on a divergence?
Set the limit before you start watching. A practical rule: if no trigger appears within about as many candles as separated the two swings, drop the idea. Drop it at once if RSI falls below its second low, because the divergence no longer exists.