









Asian session range
Also called Asian range, Asia range, Asian session box, Tokyo range, Asian session high and low
The Asian session range is the high and the low that price sets during the quiet Asian trading hours, before London opens. Traders mark it as a box and watch how price breaks, or fails to break, its two edges.
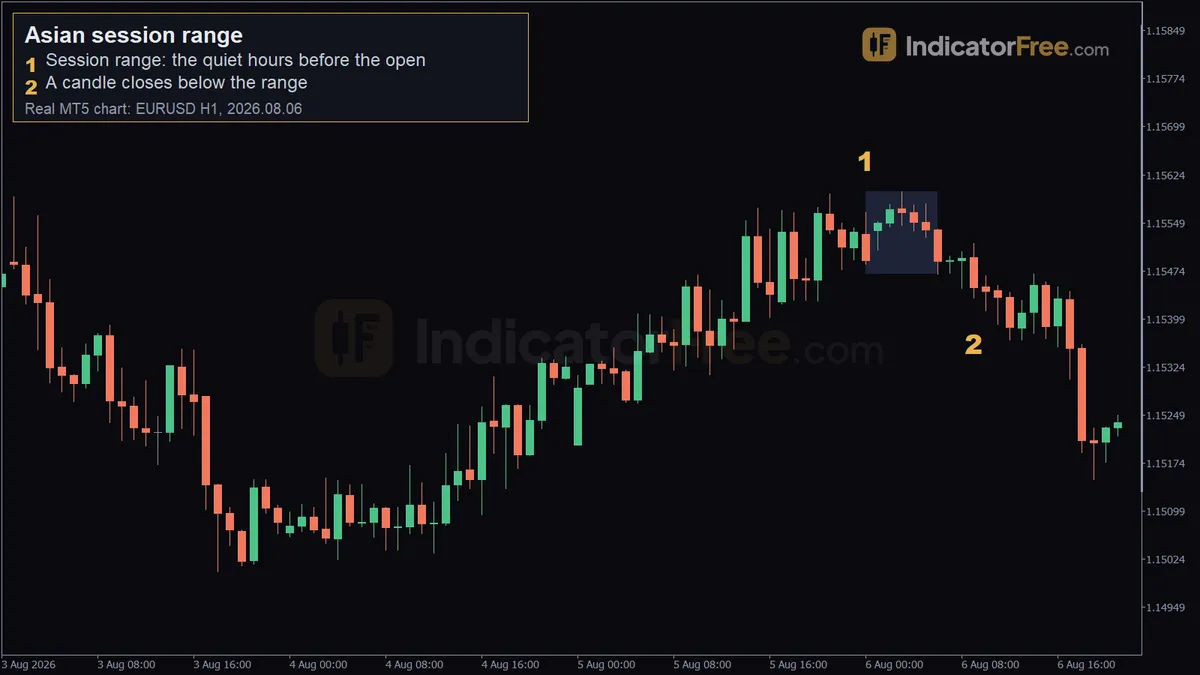
The box matters because of what sits around it. Overnight, stop orders and pending orders collect just above the high and just below the low, so the first push out of the range at the European open can be fast, and it can also be a fake. Marking both edges before the open keeps you from chasing that first spike.
Which hours count as the Asian session
Tokyo trades from about 00:00 to 09:00 UTC, and Sydney opens a few hours earlier. Few traders box the whole stretch. Most pick a fixed window inside it and end the box before London gets busy.
Your chart shows your broker's server time, which is usually not UTC, so convert the window once and write it down. The example chart on this page boxes 00:00 to 06:00 on its own clock. The exact window matters less than using the same one every day, because only then can you compare today's box with last week's.
The range forms because these hours are quiet on European and US currencies. The IndicatorFree Lab measured the average 1-hour candle on EURUSD from 2025-10-02 to 2026-10-02, with Asian hours counted as 01:00-09:59 server time. This is past data, not a forecast.
How to mark the Asian range on your chart
- Convert your chosen Asian window into your chart's clock.
- Open a 1-hour or 15-minute chart and find the highest high and the lowest low inside the window, wicks included.
- Draw a box from the first candle of the window to the last, then extend both edges to the right as lines.
- Measure the height in pips and note it.
- Mark the midpoint, the price halfway between the high and the low.
- Once the window ends, freeze the box. Never stretch it to fit later candles.
A clean box versus a weak one
A valid range looks like a box: price touches both sides at least once and the candles overlap each other. The height is normal or small compared with your own record of recent Asian ranges.
A weak range looks like a staircase. If price climbed or fell steadily through the whole window, the "high" and "low" are just the start and end of a trend, and nobody has parked orders around them.
The range is also weak when it is unusually tall, because much of the day's movement has already been spent. And it is broken, not tradable, once price has closed outside one edge and come all the way back through the other.
The 6 August 2026 EURUSD box, marker by marker
The chart at the top of the page is a 1-hour EURUSD chart. It is a past example, not a prediction.
Marker 1 labels the session range: the quiet hours before the open. Between 00:00 and 06:00 on 6 August 2026, price stayed between 1.15469 and 1.15597. That is 1.15597 - 1.15469 = 0.00128, about 13 pips for six hours of trading.
Marker 2 sits on the 09:00 candle. It closed at 1.15447, which is 2.2 pips under the range low of 1.15469. A close below the box is the bearish version of the break.
Sweep or breakout: read the close, not the wick
The most common misread is treating any poke through an edge as a breakout. A sweep is a wick that trades through the edge and closes back inside. A breakout is a candle that closes outside.
The sketch below shows both on one box. One candle spikes above the Asian high and closes back inside. Two candles later, a candle closes under the Asian low, and the next one retests that low from below.
Use this decision rule. If a 1-hour candle closes outside the box, plan a breakout trade. If it only wicks outside and closes back in, plan a trade back into the range. If neither has happened by the time London's morning is over, leave the box alone.
Two setups, priced on the example range
The levels below are an illustrative example: planning maths built on the real range from the chart, not a record of a trade or of what price did next.
Setup 1: breakout on a close
- Entry: sell at 1.15447, the close of the 09:00 candle below the range.
- Stop loss: 1.15597, the range high. Risk is 1.15597 - 1.15447 = 15 pips.
- Target: two range heights below the low. The height is 12.8 pips, so that is 25.6 pips under 1.15469. Your entry is already 2.2 pips under the low, which leaves 25.6 - 2.2 = 23.4 pips from entry.
Note what a one-height target would give: 12.8 - 2.2 = only 10.6 pips for 15 pips of risk. When the stop is the far edge of the box, a one-height target pays less than you risk, so check this before you enter.
Size the trade from the stop, not from habit. With a $3,000 account, 1% risk and $10 per pip on one standard lot of a USD-quoted pair:
Setup 2: sweep and return
Suppose instead that a candle had spiked above the range high of 1.15597 and closed back inside the box.
- Entry: sell at the close of that candle, back inside the box.
- Stop loss: just above the top of the wick. Risk is the distance from your entry to that stop.
- Target: the opposite edge, 1.15469. The midpoint, halfway between 1.15469 and 1.15597, is the first place to check whether price is still moving your way.
When the Asian range helps and when to skip it
It suits pairs that are quiet in Asian hours and active in Europe, such as EURUSD in the Lab data above. It is less clear on markets that stay active overnight. On XAUUSD, the Lab's 1-hour candles for the same period averaged $21.3 in Asian hours against $18.9 in the London morning (past data, not a forecast). On gold, the Asian hours were not the quiet part of the day.
Skip the box on days with a major release scheduled right at the European open, on Tokyo holidays, and when the range is far taller than your recent average.
| Pros | Cons | |
|---|---|---|
| Levels | Two objective prices, set before you trade | Everyone sees the same levels, so sweeps are common |
| Risk | The box gives a natural stop and a measurable height | A tall box means a wide stop and a small size |
| Timing | Tells you when to look: the hours after the box closes | Useless if your window changes from day to day |
Bullish and bearish versions
Bullish: a candle closes above the Asian high, and the high becomes the level to hold on a pullback. Bearish: a candle closes below the Asian low, as in the 6 August example.
The wider family has its own entries: range breakout, opening range breakout, false breakout and breakout retest.
Practical tips for trading the box
- Log the height of every Asian range for 20 trading days. That list is your yardstick for "tight" and "tall".
- Decide before the open which setup you will take on a close outside and which on a wick outside.
- Measure reward against risk from your real entry price, not from the edge of the box.
- Take one trade per box. A second break in the other direction usually means the day is choppy.
- If the breakout candle is very long, wait for a retest of the edge instead of entering at its close.
Quick checklist
- Same window as yesterday, converted to chart time?
- Box shaped like a box, not a staircase, and not unusually tall?
- Close outside (breakout) or wick only (sweep)?
- Stop, target and lot size calculated before entry?
FAQ
What time is the Asian session in CST?
Tokyo's 00:00 to 09:00 UTC is 6:00 pm to 3:00 am Central Standard Time. During daylight saving time in the US it shifts to 7:00 pm to 4:00 am Central.
What should I trade during the Asian session itself?
Pairs whose home markets are open move most: those with the Japanese yen, Australian dollar and New Zealand dollar. On quieter pairs, traders who are active in these hours usually trade inside the range, from edge to edge, and not the break.
Do I need an indicator to draw the Asian session range?
No. A rectangle and two horizontal lines do the job on any charting platform. A session-box indicator only saves the daily redrawing; check that its hours match your window and your chart's clock.