









Opening range breakout
Also called ORB, Opening range break, Session open breakout, Opening range breakout strategy
An opening range breakout (ORB) is a trade taken when price closes beyond the high or low of a fixed opening window, such as the quiet hours before a session or the first minutes after a market opens.
You know both key prices before you click: where you enter and where the idea is proven wrong. Your stop and position size are fixed before the busy part of the day starts. That is where most breakout losses are kept small, or not.
How to mark an opening range: the 7-step checklist
- Pick one window and never change it mid-week. Forex has no single opening bell, so you tie the range to a session. Common windows are the quiet Asian hours before London, or the first hour of London or New York. In stocks, the window is the first minutes after the exchange opens.
- Choose a chart that shows several candles inside the window. A 6-hour window on a 1-hour chart gives you six candles. A short stock window needs a 1-minute or 5-minute chart.
- Mark the highest high and the lowest low of the window. Wicks count. These two lines are the opening range.
- Measure the height in pips. Your buffer, stop and target are all measured from this one number.
- Add a buffer. A simple rule is 10% of the range height, above the high and below the low. This filters out closes that only just poke through.
- Wait for a candle to close beyond the buffer. A touch or a wick is not a signal.
- Set an end time. If nothing triggers by the time the session you are trading slows down, cancel the setup for the day.
Valid break or weak break: what to check before you enter
A valid ORB has a candle body closing clearly outside the range, during the session you planned to trade. A weak one closes a fraction of a pip outside, or prints a long wick through the line and a close back inside.
Check the range height against the pair's normal day (see average daily range). If the range already covers most of a normal day's movement, there is little room left to run. A tight range before a busy session usually has more room, because quiet periods tend to give way to range expansion.
The setup is broken when price closes back inside the range after your entry. That is a false breakout. Exit or stay out. Do not re-enter on the same side just because price pokes out again.
The chart below shows both cases on one illustrative range. One candle wicks above the high and closes back inside. A later candle closes above the buffer and goes on to reach a target equal to one range height.
Reading the 4 June 2026 EURUSD breakout, marker by marker
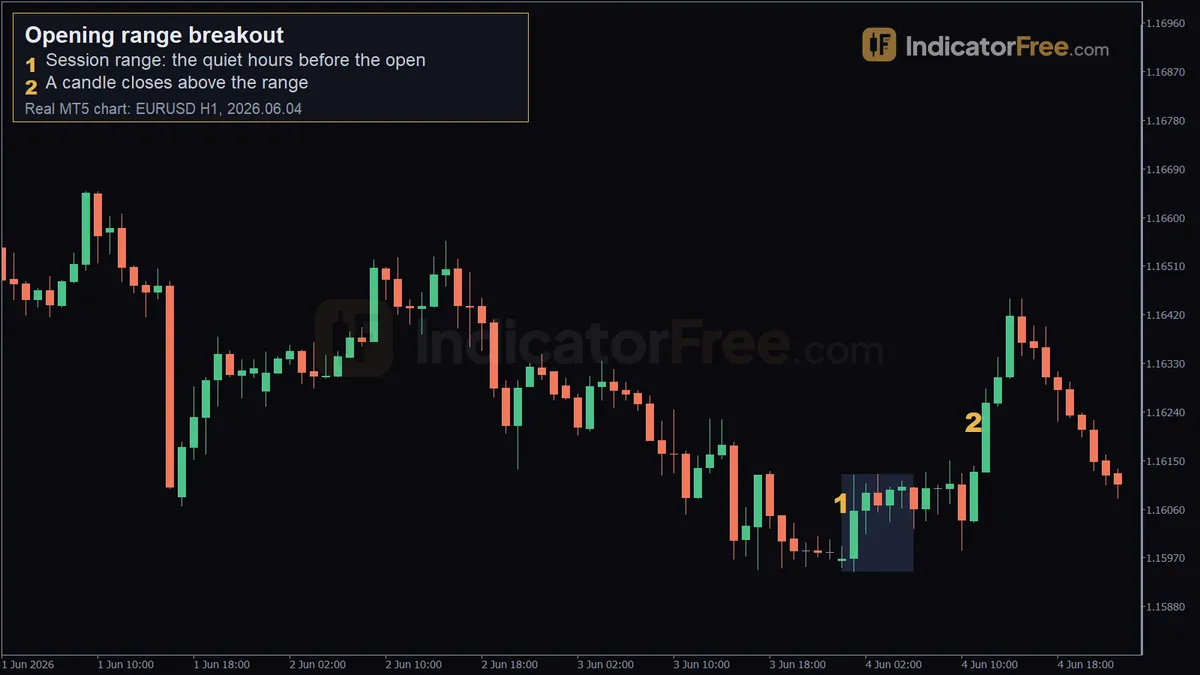
The chart at the top of the page is a past example on the EURUSD 1-hour chart. It is not a prediction.
- Marker 1: the session range. From 00:00 to 06:00 chart time on 4 June 2026, price stayed between 1.15945 and 1.16125, an 18-pip range. The marker sits at 00:00, near 1.15992, where the quiet hours begin. Chart time is the broker server's clock, not your local time, and it differs between brokers. Here the window is the quiet Asian hours before London opens, so check how your own chart's clock lines up with that session before you copy the times.
- Marker 2: a candle closes above the range. The 11:00 candle closed at 1.16129, above the range high.
The 11:00 close (1.16129) is 0.4 pip above the 1.16125 high. That is the thin kind of close the buffer rule is there to catch. A 10% buffer on an 18-pip range is 1.8 pips above the 1.16125 high. The 11:00 close does not reach it.
Decision rule: if the breakout close is inside your buffer, do not enter on that candle. Wait for a later close above the trigger, or for a pullback to the range high (see breakout retest).
Placing entry, stop loss and target on the 4 June prices
The prices recorded for this chart show no close above the buffer trigger, 1.8 pips above the 1.16125 range high, so on these facts there was no valid trade that day. The figures below are an illustrative example of the trade the rules would set up if a candle did close above the trigger, on a $10,000 account risking 1%.
- Entry: the buffer trigger, 1.8 pips above the 1.16125 range high.
- Wide stop: the same 10% buffer below the 1.15945 range low. That is 21.6 pips below entry.
- Tight stop: the middle of the range, halfway between 1.15945 and 1.16125. That is 10.8 pips below entry.
- Target 1: one range height (18 pips) above entry.
- Target 2: two range heights (36 pips) above entry.
Now compare them. With the wide stop, target 1 pays 18 pips for 21.6 pips of risk, which is less than you risk. So pair the wide stop with target 2, or pair target 1 with the mid-range stop. If the target distance is smaller than the stop distance, change one of them or skip the trade.
The lot size for the wide stop works out like this, using the textbook $10 per pip for 1 standard lot on EURUSD:
With the 10.8-pip stop, the same $100 risk gives $100 ÷ (10.8 × $10) ≈ 0.93, so 0.92 lots rounded down. The money you lose if the stop is hit stays the same.
When the opening range breakout works and when to stand aside
It tends to suit days when a quiet period is followed by a busy session, and the range is tight compared with a normal day. It also suits days when one clear driver, such as a central bank theme, pushes the market one way.
Stand aside when major scheduled news lands inside the window or soon after it. News can blow through both sides of the range. Also skip thin holiday sessions, ranges already as wide as a normal day, and days when price has already broken one side and come back.
| Pros | Cons |
|---|---|
| Entry, stop and target come from fixed prices, not opinion | A break can close back inside the range and stop you out |
| Risk is known before the session starts | A wide range means a wide stop and a small position |
| Simple rules you can test and repeat | Thin closes tempt early entries |
| One setup per day limits overtrading | Quiet days give no trade, or a slow one |
Bullish and bearish opening range breakouts
A bullish ORB is a close above the range high plus the buffer, and you buy. A bearish ORB is the mirror image: a close below the range low minus the buffer, and you sell with the stop above the range middle or at the range high plus the same buffer.
Practical tips for trading the opening range
- Write your window, buffer and end time down before the week starts. Changing them after you see the chart is fitting the rules to the result.
- Measure every range in pips and keep a log. After a few weeks you will see which range sizes suit your pair.
- Size the trade from the stop distance, never from how confident the breakout looks.
- If the break comes late in the session, treat it as weaker. Many traders cancel the setup after a fixed number of hours.
- After a stop-out, do not flip to the other side on impulse. Only take it if it meets the same checklist.
FAQ
How long should the opening range be for stocks?
Traders commonly use the first 5, 15 or 30 minutes after the exchange opens. Shorter windows trigger sooner but give more false starts. Longer ones trigger later with wider stops. Pick one and test it on your own market.
Can an opening range breakout be run by a trading bot?
Yes. Every rule is a fixed time or price, so it can be automated. Test it on past data, including spread and slippage, first.
Should I use a stop order above the range or wait for the candle close?
A stop order fills as soon as price trades through the level, so a wick-only poke can fill you and then reverse. Waiting for the close filters those pokes, but you enter further from the range with a wider stop. If you use a stop order, place it at the buffer level, not right on the range high or low.