









Hidden divergence
Also called Trend continuation divergence, Reverse divergence, Hidden bullish divergence, Hidden bearish divergence
Hidden divergence is a momentum signal that a trend is likely to continue. In an uptrend, price makes a higher low while an oscillator such as RSI makes a lower low. In a downtrend it is the mirror image.
Most traders first learn divergence as a warning that a trend may reverse. Hidden divergence points the other way. It marks the likely end of a pullback, so it shows you where to join a trend instead of fighting it. If you read it backwards, you end up selling into a healthy uptrend and getting stopped out.
How to spot hidden divergence: a 7-step checklist
- Confirm the trend first. The bullish version needs higher highs and higher lows on the chart you trade. If there is no clear trend, there is no hidden divergence.
- Mark two pullback lows. A swing low is a candle with higher lows on both sides of it. Pick lows that end pullbacks, not small pauses in the middle of a move.
- Check price. The second low must be higher than the first.
- Check the oscillator on the same candles. Read RSI (or MACD, or Stochastic) on the exact candles of the two price lows. The second reading must be lower than the first.
- Keep both lows in one trend leg. If a range or a trend break sits between them, comparing them tells you little.
- Wait for the turn. The second low only counts once a later candle closes above the high of the candle that made the second low, and RSI rises from its low.
- Set the stop before the size. Place the stop below the FIRST low (the level where the pattern breaks), plus a small buffer. Then calculate the lot size from that distance.
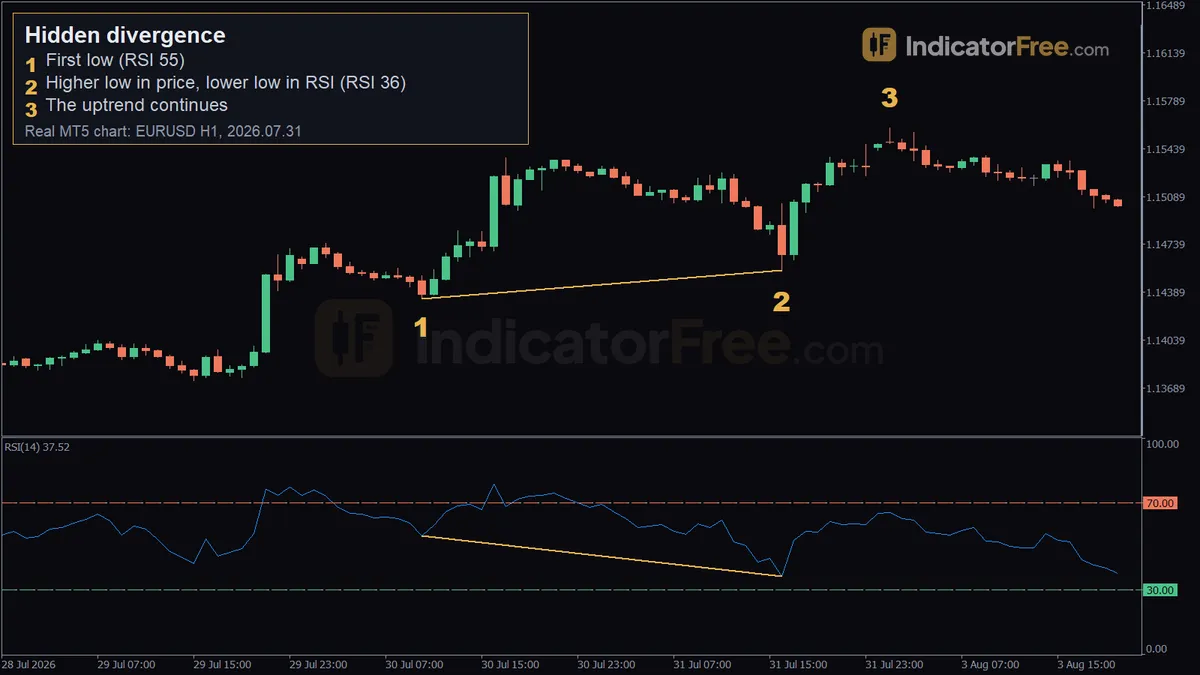
The chart below shows the shape you are looking for. Price steps up while RSI steps down.
The most common misread is mixing up hidden and regular divergence. Look at price first, then find the row in the table below. Regular divergence is covered in the RSI divergence, Bullish divergence and Bearish divergence entries.
| Type | Price swing | Oscillator swing | Trend it appears in | What it signals | What you do |
|---|---|---|---|---|---|
| Regular bullish | Lower low | Higher low | Downtrend | Selling is fading; possible reversal up | Watch for a reversal; tighten or close shorts |
| Regular bearish | Higher high | Lower high | Uptrend | Buying is fading; possible reversal down | Watch for a reversal; tighten or close longs |
| Hidden bullish | Higher low | Lower low | Uptrend | Pullback is ending; uptrend likely continues | Look to buy the pullback |
| Hidden bearish | Lower high | Higher high | Downtrend | Rally is ending; downtrend likely continues | Look to sell the rally |
In a downtrend you flip the checklist: mark two rally highs instead of two pullback lows. The drawing below shows bearish hidden divergence. Price makes a lower high while RSI makes a higher high, and the downtrend then resumes.
Reading the EURUSD 1-hour example marker by marker
The chart at the top of the page is a past example from EURUSD on the 1-hour chart. It is not a prediction.
- Marker 1, first low. On 30 July 2026 at 10:00, price made a low at 1.14343 with RSI at 54.7.
- Marker 2, higher low in price, lower low in RSI. On 31 July 2026 at 16:00, price bottomed at 1.14552. That is about 21 pips above marker 1. RSI read 36.4, about 18 points lower. Price and RSI moved in opposite directions.
- Marker 3, the uptrend continues. From the second low, price climbed 104 pips within 20 candles. It was trading at 1.15589 on 3 August 2026 at 01:00. The deep RSI reading at marker 2 looked like weakness, but it was the pullback using up its momentum before the trend resumed.
What makes a hidden divergence weak or broken
A hidden divergence is weak when:
- the second low sits only a pip or two above the first, which is noise rather than structure;
- the oscillator readings differ by only a few points;
- price is drifting sideways rather than trending;
- the higher timeframe trend points the other way;
- the second low was printed by a single news spike.
It is broken when price closes below the first low. The higher-low structure is gone and the trend itself is in doubt. Treat that level as your exit, never as a place to add to the position.
A strong one has a clear trend and a pullback into a level that has mattered before, such as old resistance now acting as support. The oscillator should dip noticeably while price holds well above the first low.
Trading a bullish hidden divergence pullback
Buy setup on the EURUSD 1-hour example
The figures here are an illustrative example. They use the chart's real swing lows, a simple $6,000 account and 1% risk per trade. The entry is an illustrative price standing in for the close of the confirming candle, the first candle that closes above the high of the second-low candle (step 6 of the checklist).
- Entry: buy at 1.14611, used here as the close of the confirming candle after the second low at 1.14552, with RSI turning up.
- Stop loss: 30 pips below entry. The first low at 1.14343 is 26.8 pips below entry, so the stop sits about 3 pips under it, just past the level where the pattern breaks (see the broken-pattern section above).
- Target: twice the risk, 60 pips above entry, at 1.15211. For reference, price went on to reach 1.15589.
On EURUSD, one standard lot (100,000 units) is worth $10 per pip. The calculation below turns 1% risk into an order size.
At 0.20 lots, each pip is worth $2. Reaching the target pays 60 pips × $2 = $120, and the stop costs $60.
When hidden divergence works and when to skip it
It tends to work best in clean trends with regular pullbacks. It is more reliable on the 1-hour chart and above, where swings are clearer.
Skip it after a long, stretched run of very large candles, and on 1-minute charts, where noise creates a new "divergence" every few minutes.
| Pros | Cons |
|---|---|
| Trades with the trend, not against it | Gives no target; you must set one yourself |
| Gives a logical stop under a defined low | Needs a confirmed swing, so entry comes late |
| Works with RSI, MACD or Stochastic | A stop under the first low can be wide, which shrinks your lot size |
| Clear rule for when the idea is wrong | Many false signals on small timeframes |
Practical tips before you trade it
- Read the trend on a higher timeframe and take the signal on a lower one, for example a 4-hour trend with a 1-hour entry.
- Do not wait for RSI to touch 30. In the example above, the second low came at 36.4.
- Keep your oscillator settings fixed. Changing settings until a divergence appears is fooling yourself.
- Log each trade with a note on how clear the trend was. Your weak trades usually share a pattern.
FAQ
Should I use wicks or candle closes for the swing lows?
Either works. Wicks show the true extreme of each pullback, while closes ignore brief spikes. Pick one and use it every time, because mixing them creates divergences that are not there.
Can a hidden divergence indicator repaint?
It can. A swing low only exists after later candles confirm it, so any tool that auto-marks divergences either draws them a few candles late or draws them early and then removes them. Before you trust its alerts, watch it on a live chart and compare what it showed in real time with what it shows afterwards.
Can I trade hidden divergence on stocks, indices or crypto?
Yes. It compares price swings with momentum, so it applies to any market that trends. Thin markets with large gaps produce messier swings, so the weak-signal filters above matter even more there.