Awesome Oscillator
Free Awesome Oscillator for MT5: AO histogram with Zero Cross, Saucer and Twin Peaks arrows, a panel and alerts. Lab: 0 of 750 signals repainted.
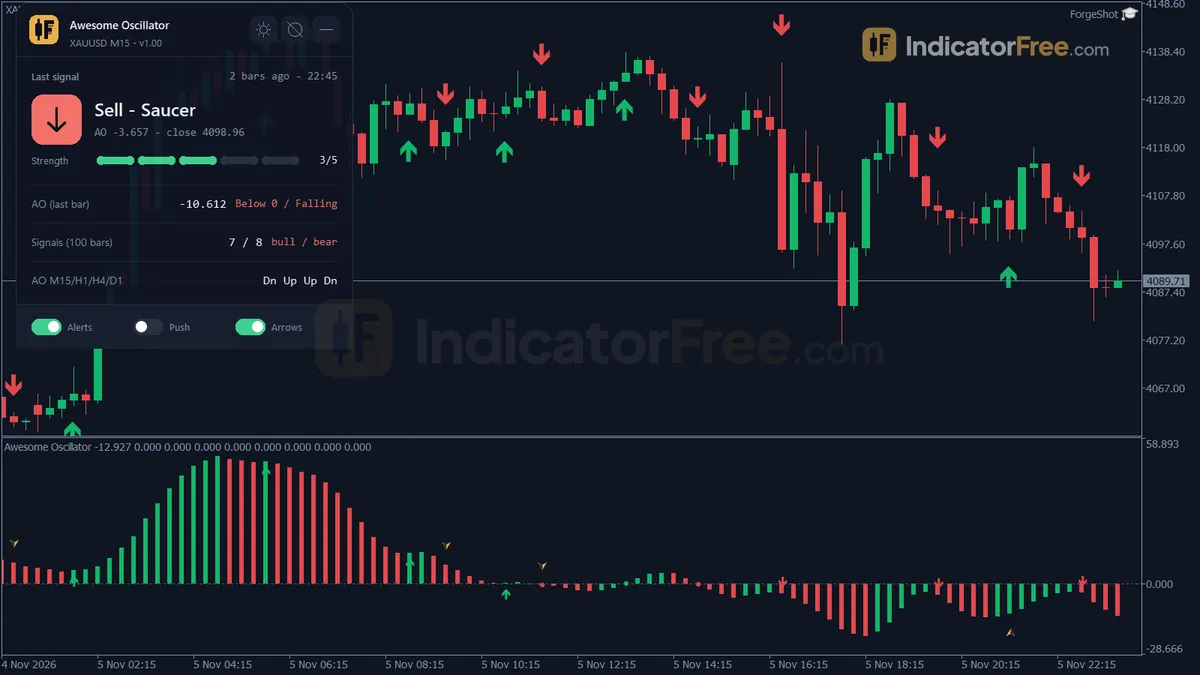
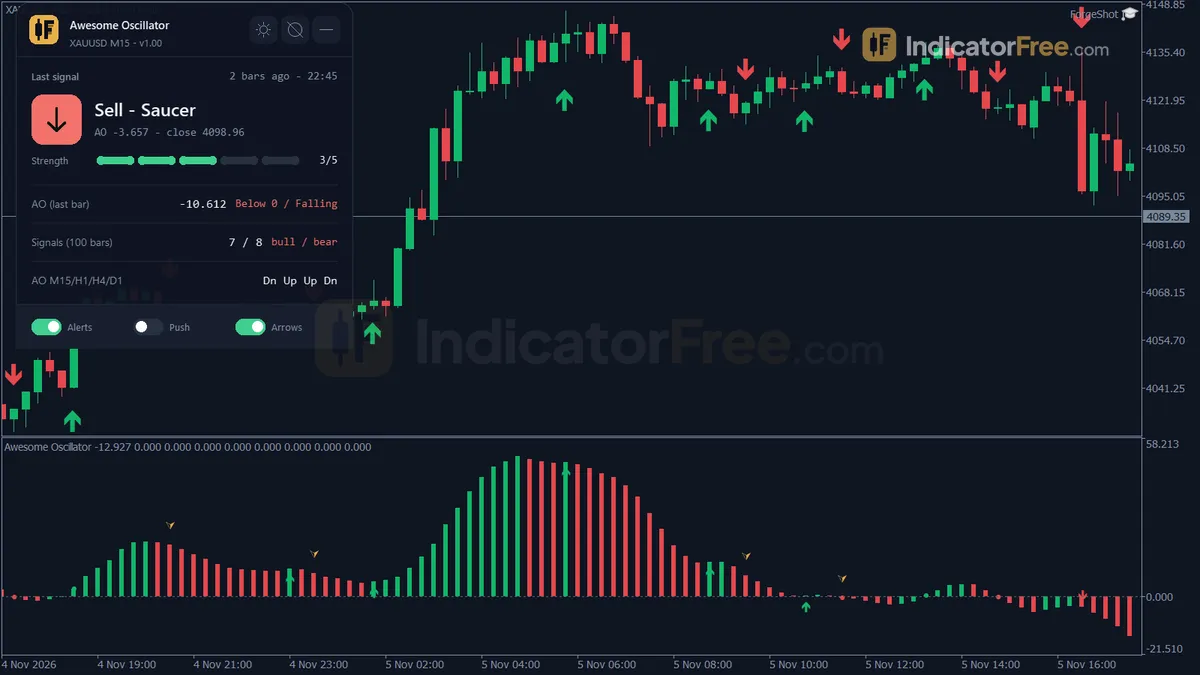
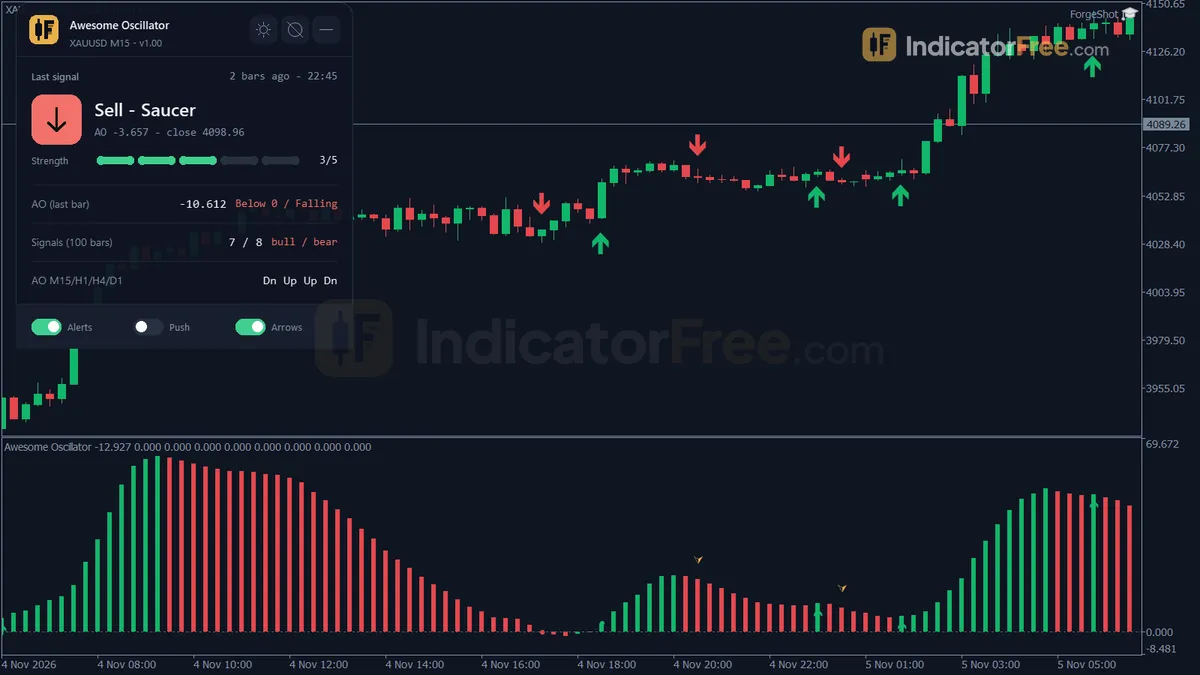
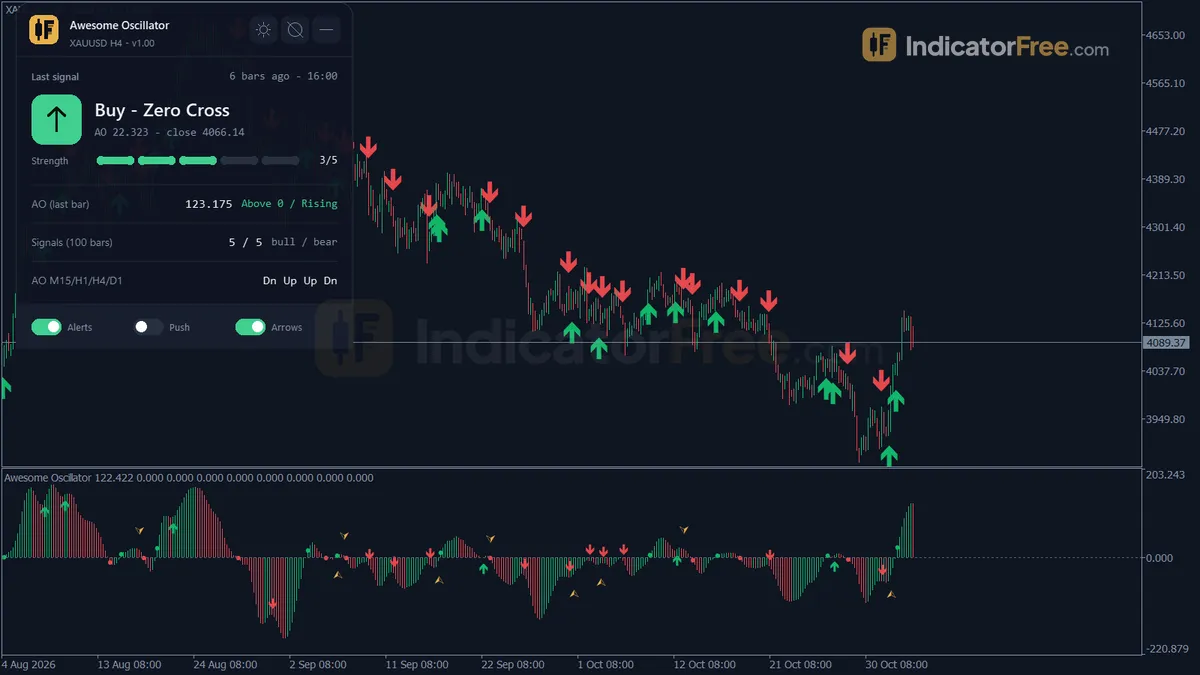
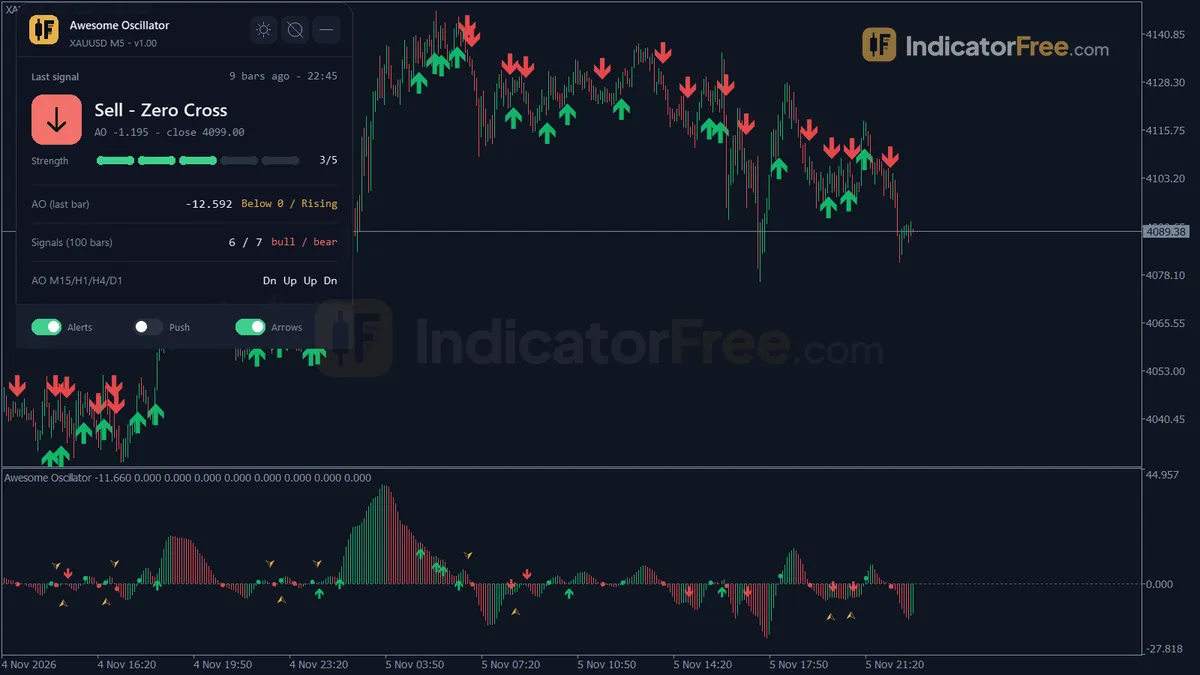
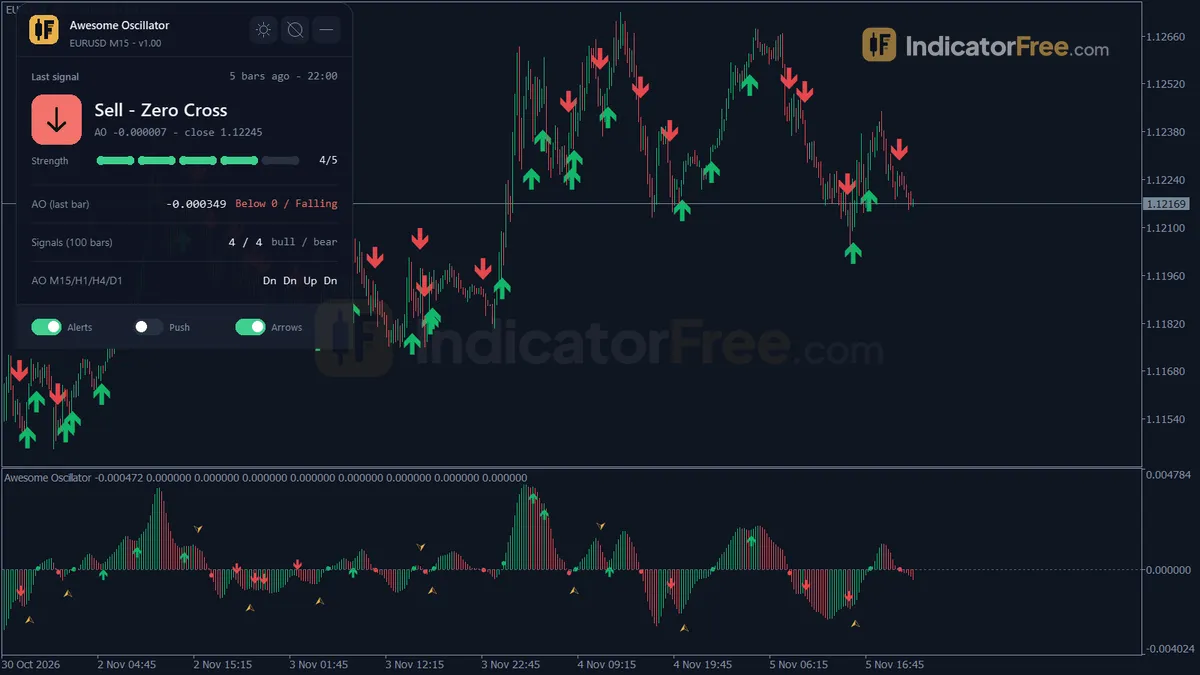
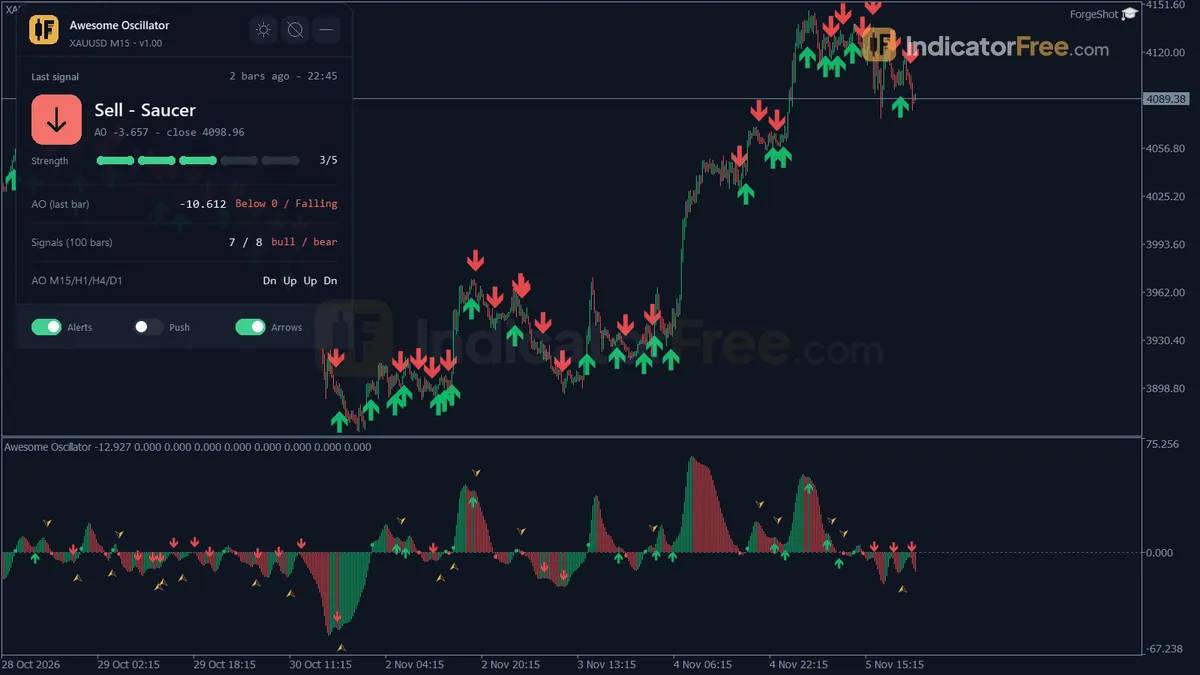
- Repainted
- 0 / 750
- Signals / week
- ≈ 57.1
- Tested on
- EURUSD M15
- Tested
- 2026-10-09
Overview
The Awesome Oscillator indicator for MT5 draws Bill Williams' AO histogram in a subwindow. It finds Zero Line Cross, Saucer and Twin Peaks signals on closed bars and copies them as buy and sell arrows onto the price chart. In the Lab's repaint test, 0 of 750 signals changed after they printed. It helps traders who want AO's three classic signals found for them instead of read by eye.
What the indicator puts on your chart
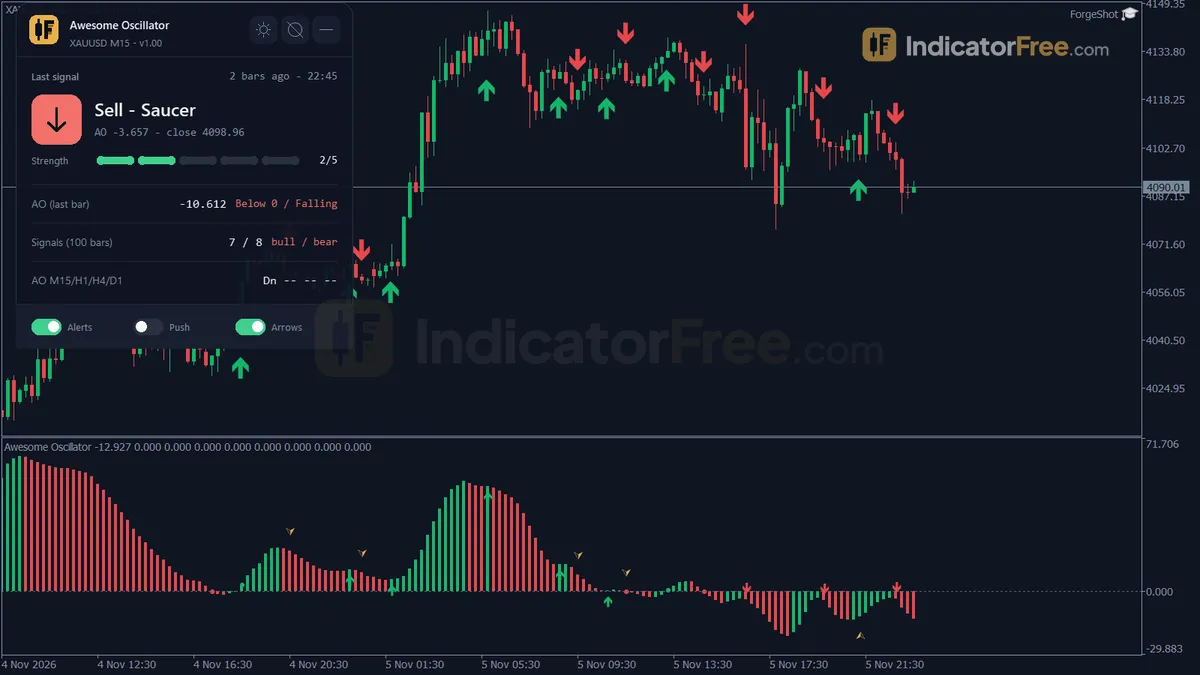
AO = fast SMA minus slow SMA of median price; green bar = AO rose, red = fell.
On top of the histogram you get:
- Six subwindow arrows: bull and bear versions of Zero Cross, Saucer and Twin Peaks.
- Main chart arrows: one Buy Arrow below the candle's low or one Sell Arrow above its high whenever any enabled signal prints.
- A Signal panel that sums up the latest signal and the AO state on four timeframes.
Screenshot (gallery, first close-up): a Bull Zero Cross on XAUUSD M15, 27 Oct 2026 14:15. The gallery screenshots are XAUUSD apart from the one labelled EURUSD. The Lab numbers on this page come from EURUSD M15.
How the Lab tested it
The Lab tested version 1.00 (147.1 KB) on MT5 build 6230 on 2026-10-09. It ran the indicator on EURUSD M15 from 2026-07-09 to 2026-10-08 using real ticks from Raw Trading Ltd.
- Repaint: 750 signals were logged as they printed. Afterwards, 0 had changed and the largest arrow delay was 0 bars. For you, this means an arrow on a closed bar stays put, so your history looks the same as live trading did. Twin Peaks is late by design, though: it is drawn on the bar that confirms the pattern, not on the peak itself.
- Follow-through: for each arrow, the Lab checked whether price moved 1 ATR in the arrow's direction before it moved 1 ATR against it. Sell arrows did slightly better than buy arrows, but neither side beat a coin flip (chart below).
- Speed: the median signal reached one of the two levels in 2 bars for buys and 3 bars for sells. Only 2% reached neither level within 20 bars. AO arrows play out fast, in either direction, so treat them as short-horizon triggers.
- Frequency: 57.1 signals a week on one chart (29.2 buy, 27.9 sell). That is about 11 a day on M15, simple arithmetic from the weekly count over five trading days. It is a busy chart if you leave all three signal types on.
Scale zoomed in to show the difference (bars do not start at zero).
Who it is for
It suits traders who already know AO's three patterns and want them marked and alerted on closed bars, with a panel that shows what higher timeframes are doing.
How it works
- 1Calculates the median price of each bar, the average of high and low.
Median = (High + Low) / 2 - 2Subtracts a slow average of median prices from a fast one to get the oscillator.
AO = average Median over FastPeriod - average Median over SlowPeriodInputs: FastPeriod, SlowPeriod - 3Colours each bar up or down by whether AO rose or fell versus the previous bar.
Up if AO > previous AO, down if lower - 4Detects zero cross, saucer and twin peaks on closed bars, a saucer is two same-colour bars then a flip.
Zero cross: AO changes sign | Twin peaks: second pivot closer to zero than the first, then colour flipsInputs: EnableZeroCross, EnableSaucer, EnableTwinPeaks, TwinPeakPivotBars - 5Draws buy or sell arrows on the price chart and reads AO on four other timeframes.
Arrow offset from ATR-like average rangeInputs: ShowMainChartArrows, MainArrowBars, MTF_TF1, MTF_TF2, MTF_TF3, MTF_TF4
Specifications
- Platform
- MetaTrader 5
- Version
- 1.00
- Type
- Indicator
- Window
- Separate window
- Draws
- 1 histo, 8 arrows, 1 panel
- Alerts
- popup, push, sound
- Repaints
- No (0 of 750 signals changed)
- Inputs
- 21
- Tested on
- MT5 build 6230 · 2026-10-09
Repaint test
No repaint detected. In a 9 Jul 2026 – 8 Oct 2026 test on EURUSD M15 (Raw Trading Ltd real ticks), 750 signals were logged at bar close and re-read at the end of the test: 0 changed. Arrows print on the bar that closes the signal, with no delay.
IndicatorFree — tested 2026-10-09 · MT5 build 6230 · Raw Trading Ltd real ticks. Results come from historical data, not live trading, and do not guarantee future results.
Signal statistics
Over 9 Jul 2026 – 8 Oct 2026 on EURUSD M15, the indicator printed 750 arrows. After 48.1% of them, price moved 1×ATR(14) in the arrow's direction before moving 1×ATR against it (median 2 bars). 2% reached neither level within 20 bars.
This measures price movement after the arrow, not a trading result. It includes no spread, commission, stop loss or position sizing.
What it draws
- A histogram (AO Histogram) in a separate window.
- Arrows (Bull Zero Cross) from buffer 2, drawn on the closed bar.
- Arrows (Bear Zero Cross) from buffer 3, drawn on the closed bar.
- Arrows (Bull Saucer) from buffer 4, drawn on the closed bar.
- Arrows (Bear Saucer) from buffer 5, drawn on the closed bar.
- Arrows (Bull Twin Peaks) from buffer 6, drawn on the closed bar.
- Arrows (Bear Twin Peaks) from buffer 7, drawn on the closed bar.
- Arrows (Buy Arrow) from buffer 8, drawn on the closed bar.
- Arrows (Sell Arrow) from buffer 9, drawn on the closed bar.
- An on-chart panel (Signal); values shown in the panel are not exposed as buffers.
Inputs
| Input | Default | What it does |
|---|---|---|
| FastPeriod | 5 | Fast SMA period of median price (2-20, standard 5) |
| SlowPeriod | 34 | Slow SMA period of median price (10-100, standard 34) |
| EnableZeroCross | true | Detect Zero Line Cross signals |
| EnableSaucer | true | Detect Saucer signals |
| EnableTwinPeaks | true | Detect Twin Peaks signals |
| TwinPeakPivotBars | 2 | Bars each side to confirm an AO peak (1-5); Twin Peaks prints this many bars late |
| ShowMainChartArrows | true | Show buy/sell arrows on the main chart (can be toggled on the panel) |
| MainArrowBars | 1000 | How many recent bars get main chart arrows |
| ShowMTFPanel | true | Show AO state on 4 timeframes in the panel |
| MTF_TF1 | M15 | Panel timeframe 1 |
| MTF_TF2 | H1 | Panel timeframe 2 |
| MTF_TF3 | H4 | Panel timeframe 3 |
| MTF_TF4 | D1 | Panel timeframe 4 |
| SignalCountBars | 100 | Recent closed bars used for the bull/bear signal count (20-500) |
| PanelScale | 1 | Panel size multiplier (DPI is handled automatically) |
| AlertPopup | true | Popup alert on a new signal (can be toggled on the panel) |
| AlertPush | false | Push notification on a new signal (can be toggled on the panel) |
| AlertSound | false | Play a sound on a new signal |
| SoundFile | alert.wav | Sound file in the MT5 Sounds folder |
| Theme | Dark | Chart colour theme applied on load |
| RestoreTheme | true | Restore the previous chart colours when removed |
How to read it
Reading the histogram
The side of zero tells you which average is on top. Above zero, the 5-bar average of median price is above the 34-bar average. Below zero, it is beneath it. The colour only tells you whether AO rose or fell compared with the previous bar.
Common misread: a red bar above zero is not a sell signal. It means upside momentum is fading, not that it has flipped. On its own, a colour change triggers nothing. Only the three patterns below do.
The three signals
The illustration below shows how a Zero Cross and a Saucer look in the subwindow.
Zero Line Cross. A bull cross prints when AO was below zero on the previous closed bar and closes at or above zero. A bear cross is the mirror image. It marks the bar where the fast average overtakes the slow one. In a range it can fire back and forth around zero. Rule: take a cross only when it comes after a clear run of bars on the other side of zero. Skip it when AO has crossed back and forth within the last few bars.
Saucer. A Bull Saucer needs three closed bars, all above zero, coloured red, red, then green. A Bear Saucer needs three bars below zero coloured green, green, then red. It is a continuation signal: momentum pauses and then resumes in the same direction. Common misread: three bars of the same colour are not a saucer. Neither is a red-red-green sequence that straddles zero. All three bars must sit on the same side of zero with the flip on the third. Rule: take a saucer only in the direction AO is already on. Skip it when the bars are tiny and hugging zero, because that is a zero cross in waiting, not a pause in a trend.
Twin Peaks. A Bull Twin Peaks prints when a new AO trough below zero is confirmed higher than the previous confirmed trough below zero and the confirming bar is green. A Bear Twin Peaks is a lower peak above zero, confirmed on a red bar. It is AO's reversal signal: momentum is still negative (or positive) but weaker than at the last extreme. The arrow sits on the confirming bar, TwinPeakPivotBars bars after the trough or peak.
Rule: before taking it, check how far price has already moved since the trough. If price has already moved about 1 ATR from the trough by the time the arrow prints, skip it. The Lab measured follow-through in 1 ATR steps.
Main chart arrows and the panel
The Buy Arrow and Sell Arrow on the price chart combine every enabled signal type into one mark per closed bar, so you can trade from the main chart without reading the subwindow. MainArrowBars (default 1000) sets how many recent bars get these arrows.
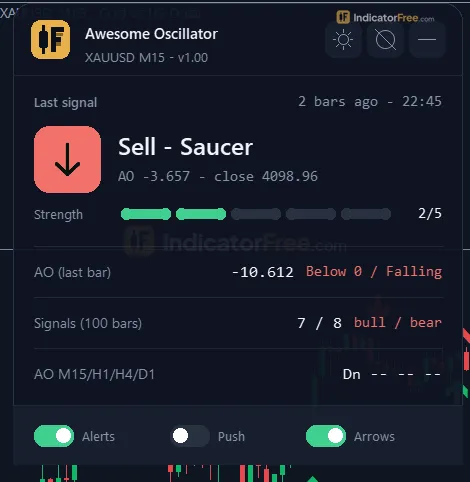
The Signal panel shows:
- the last AO signal and how many bars ago it printed
- the current AO value and which side of zero it is on
- the bull and bear signal counts over the last
SignalCountBarsclosed bars (default 100, range 20-500) - the AO state on four timeframes
The panel also lets you switch main chart arrows, popup alerts and push alerts on or off without opening the inputs.
Screenshot (gallery): "The on-chart panel, close up". Taken on XAUUSD; the Lab numbers on this page are EURUSD M15.
Inputs to change first
EnableZeroCross,EnableSaucer,EnableTwinPeaks(all on by default). Keep only the signals that fit your style: crosses and saucers for trend-following, Twin Peaks for early reversals. The main chart arrows follow whatever you leave on.TwinPeakPivotBars(default 2, range 1-5). A higher value needs more bars on each side to confirm a peak, so every Twin Peaks arrow prints later.MTF_TF1toMTF_TF4(default M15, H1, H4, D1). Set the first slot to the timeframe you trade and the others to the timeframes above it, so the panel always shows your higher-timeframe context.FastPeriod/SlowPeriod(default 5 / 34). These are the standard AO settings. Leave them alone unless you have a reason to change them (see FAQ).PanelScale(default 1). Resizes the panel. DPI is handled automatically.
Alerts
Alerts fire when a new signal prints on a closed bar. Popup (AlertPopup) is on by default and appears in the MT5 alert window. Push (AlertPush) is off by default. It sends to the MT5 mobile app once your MetaQuotes ID is set in the terminal. Sound (AlertSound) is off by default and plays SoundFile (default alert.wav) from the MT5 Sounds folder.
A decision rule to start with
Take a main chart arrow only when the panel's AO state for the next higher timeframe agrees with the arrow's direction. Pass on it when the arrow points against that timeframe. This is a starting rule, not a Lab result. Note how it does on your own chart before you rely on it.
Installation
- 1Download AwesomeOscillatorIndicator.ex5 from the button above (Google Drive).
- 2In MetaTrader 5: File → Open Data Folder → MQL5 → Indicators. Copy AwesomeOscillatorIndicator.ex5 there.
- 3Restart MT5 or right-click Indicators in Navigator → Refresh.
- 4Drag Awesome Oscillator onto a chart. For push alerts, enable "Allow push notifications" under Tools → Options → Notifications.
- Tested on MT5 build 6230.
Key terms and guides
- Zero line
- The zero line is the horizontal 0 level on oscillators such as MACD, momentum and CCI. When the indicator crosses above it, momentum has turned up. When it crosses below it, momentum has turned down.
- Average True Range
- Average True Range (ATR) is a volatility indicator that shows how far price typically moves per candle, gaps included, averaged over a set number of candles. It measures the size of moves, not their direction.
- Simple moving average
- A simple moving average (SMA) is the average closing price of the last n candles, drawn as one line on the chart. Traders use it to read trend direction, time pullback entries and build crossover signals.
- Every tick based on real ticks
- Every tick based on real ticks is the MT5 Strategy Tester mode that replays the actual bid and ask ticks your broker recorded, with the real changing spread, instead of ticks the tester invents from 1-minute bars.
- Awesome oscillator
- The Awesome oscillator (AO) is a momentum histogram. It subtracts a 34-bar simple average of each candle's midpoint from a 5-bar average of the same midpoints. The result shows whether short-term momentum is running ahead of the longer trend or falling behind it.
- Trading Signal
- A **trading signal** is a specific prompt to buy or sell a market. It usually gives an entry price, a stop-loss and a take-profit, and it comes from an indicator, a set of rules or a signal provider.
- Guide: How to Trade for Dummies: Your First Forex Trade, Step by Step
- Guide: What Is Bull Bear Power? How to Read Elder's Bull and Bear Power
- Guide: What Does It Mean to Trade Long or Short? A Forex Beginner's Guide
More on this subject: Oscillators & momentum guide, terms and tools
User reviews
No reviews yet. Members who download the tool can review it here.
Sign in and download the tool to review it.
Build a checklist with it
Awesome Oscillator does one job on the chart: entry signal. Put it on the same chart as the tools below and the IndicatorFree panels merge into one checklist card, ordered trend, zone, signal, risk.
- Trend / contextADXAwesome Oscillator tells you when; this tells you which way the market leans, so you can skip signals against it.
- Zone / levelAsian Session RangeShows the zones and levels, so you can see whether a signal from Awesome Oscillator fires at a level worth trading.
The Lab has not tested these combinations. Each tool is tested on its own; the card only lines up what each one says. Free members get 2 new tools a day. If one has to wait until tomorrow, install BlackBox to raise the limit to 5 a day (20 on a live account).
FAQ
Does Awesome Oscillator repaint?
No repaint detected. In a 9 Jul 2026 – 8 Oct 2026 test on EURUSD M15 (Raw Trading Ltd real ticks), 750 signals were logged at bar close and re-read at the end of the test: 0 changed. Arrows print on the bar that closes the signal, with no delay.
Can I use Awesome Oscillator in an EA?
Yes. Read buffer 2 (Bull Zero Cross) with iCustom() on bar 1 — the last closed bar.
Why can’t my EA read the zones?
Zones and the panel are chart objects, not indicator buffers, so iCustom() does not return them.
How do I get alerts on my phone?
Enter your MetaQuotes ID under Tools → Options → Notifications, tick "Enable push notifications", and keep the push alert input on.
Why does it open in a separate window?
It plots values on their own scale, so MT5 draws it below the price chart.
Does it work on other pairs?
Tested on EURUSD only; other symbols not tested.
Can I change the 5 and 34 periods?
Yes. `FastPeriod` accepts 2-20 and `SlowPeriod` 10-100, but 5/34 is the standard Bill Williams definition of AO. Any other pair makes a different oscillator, so treat it as untested and don't apply this page's Lab numbers to it.
Which timeframes and symbols can I use it on?
It runs on any MT5 chart, and the gallery shows it on M5, M15 and H4. The Lab measured only EURUSD M15, so on other symbols and timeframes, check how the arrows behave on your own chart before relying on them.
Is the Awesome Oscillator the same as MACD?
No. Both subtract a slow average from a fast one, but AO uses simple averages of median price (high plus low, divided by two) with standard 5 and 34 periods, and it has no signal line. Its signals come from zero crosses and bar patterns instead.
Why did my chart colours change when I attached it?
The `Theme` input (default Dark) applies a colour theme on load. With `RestoreTheme` left on, your previous chart colours come back when you remove the indicator.
Changelog
- 1.00Initial release: Awesome Oscillator Indicator for MT5, standard Bill Williams AO histogram (SMA5 - SMA34 of median price) with Zero Line Cross, Saucer and Twin Peaks signal detection, each independently toggleable. · 2026-10-09
Final verdict
What it does well
In the Lab, 0 of 750 arrows changed after they printed, so the arrows and alerts you get live match the history. All three classic AO patterns are coded to precise closed-bar rules, and each can be switched on or off. The panel puts the last signal, the recent bull/bear count and four timeframes in one place, so you can judge context without flipping charts.
Where it falls short
At 48.1%, taking every arrow with a 1 ATR target and a 1 ATR stop loses slightly before spread, and more after it, so you need your own filter. The indicator gives no stop, no target and no trend filter of its own. AO also has no fixed overbought or oversold levels, so it cannot tell you when a move is stretched. Twin Peaks is late by construction, and with all signals on, the arrow count on a fast chart is high.
- –You trade AO patterns already and want them detected on closed bars
- –You have a direction filter (higher timeframe, structure) and need a timing trigger
- –You want alerts instead of watching the histogram
- –You manage exits yourself
- –You want arrows you can take one by one without a filter
- –You need the tool to set stops and targets
- –You trade a tight range where AO keeps crossing zero
- –You want an early entry from Twin Peaks at the exact turn
Settings to start with
Keep FastPeriod 5 and SlowPeriod 34. On M15, start with all three signals on and the default MTF slots. On M5, try TwinPeakPivotBars 3 to make Twin Peaks wait for a cleaner trough. This is not tested by the Lab, so compare it with the default 2. Set MTF_TF1 to M5 so the panel starts from your chart. Turn on AlertPush if you are not at the screen. Once you know which signal type you actually trade, switch the other two off.
An idea to pair it with
AO tells you momentum has turned but not whether price is already stretched. The free CCI can show when a buy arrow lands in a stretched zone. The Lab has not tested the pair.