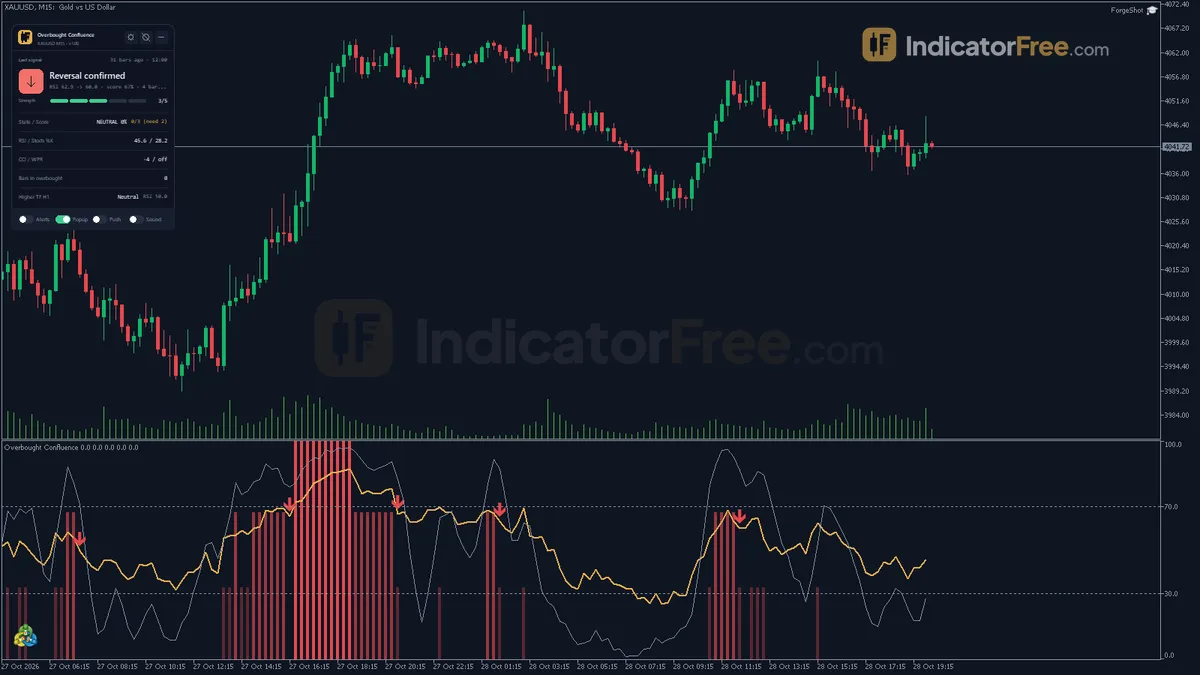
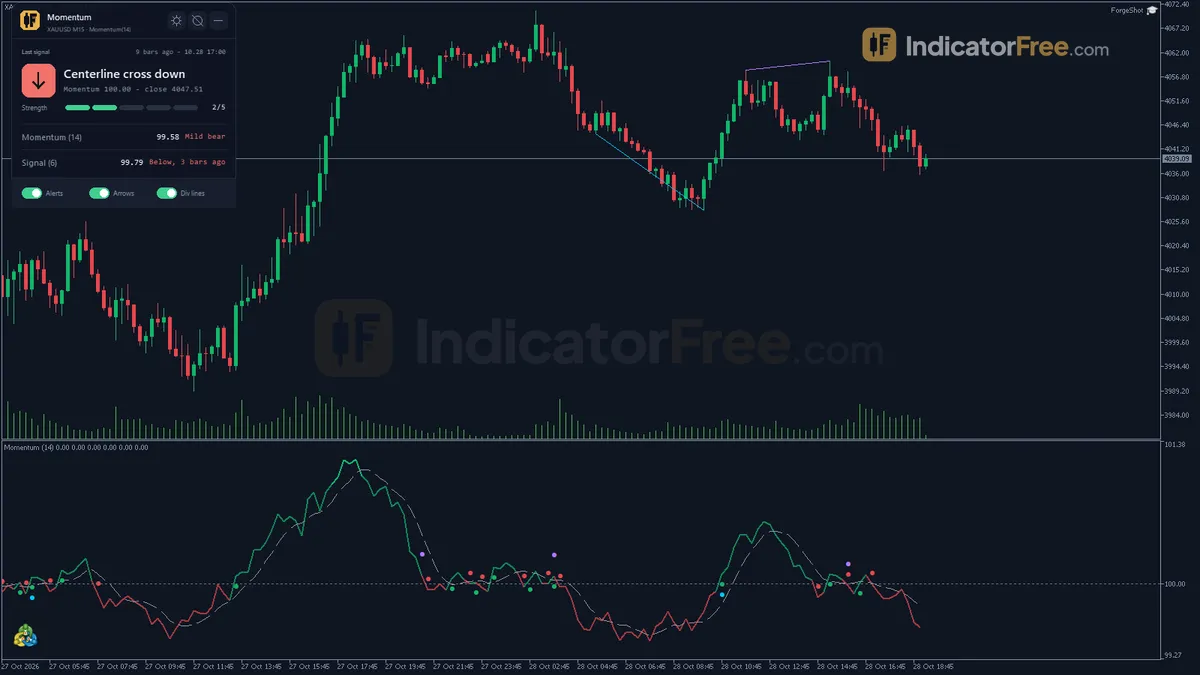
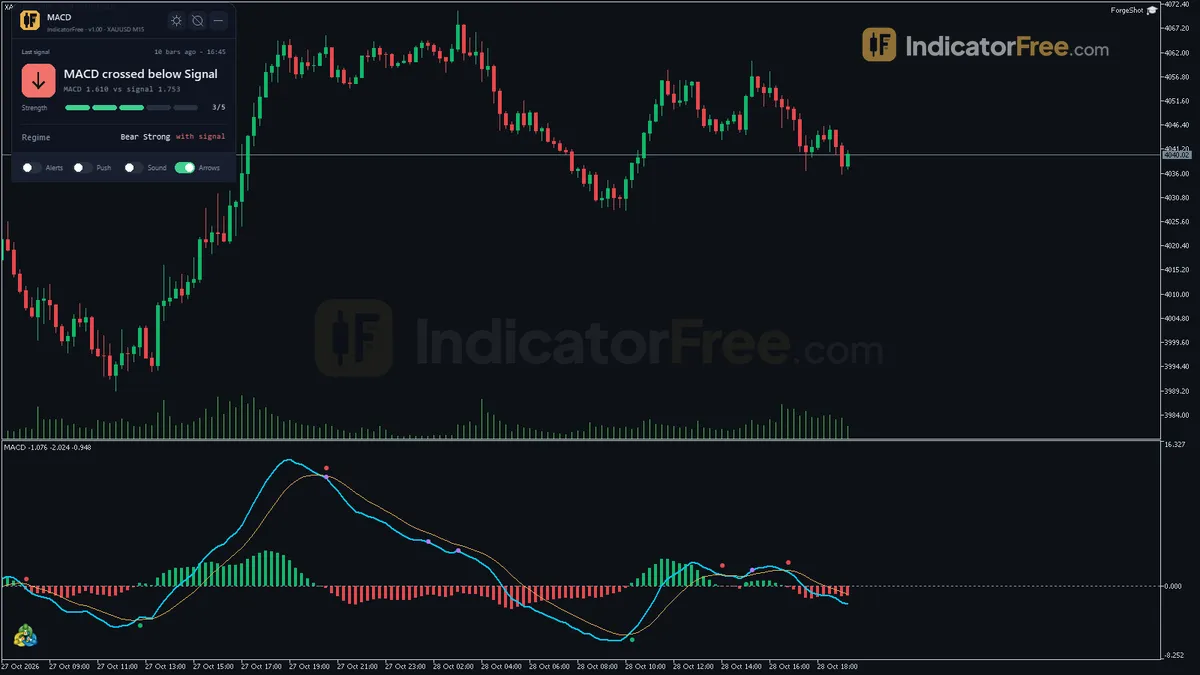
MACD Histogram
Free MACD Histogram indicator for MT5: 4-phase histogram, closed-bar zero-cross arrows and alerts. Lab repaint test: 0 of 867 signals changed.
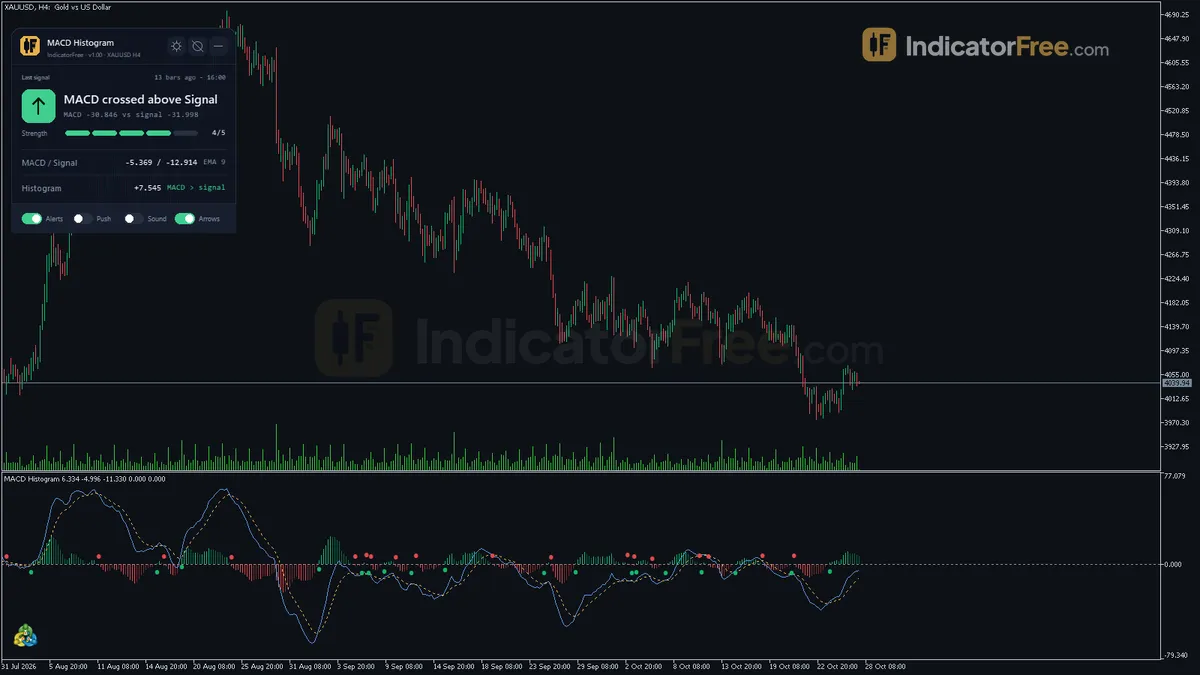
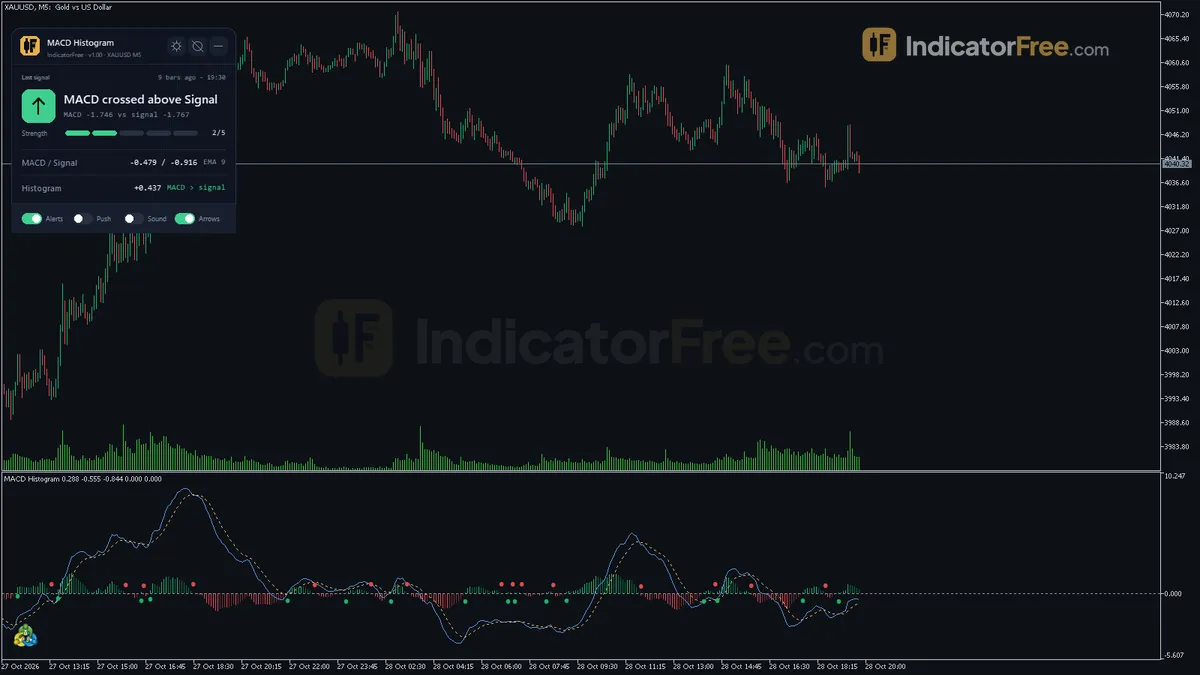
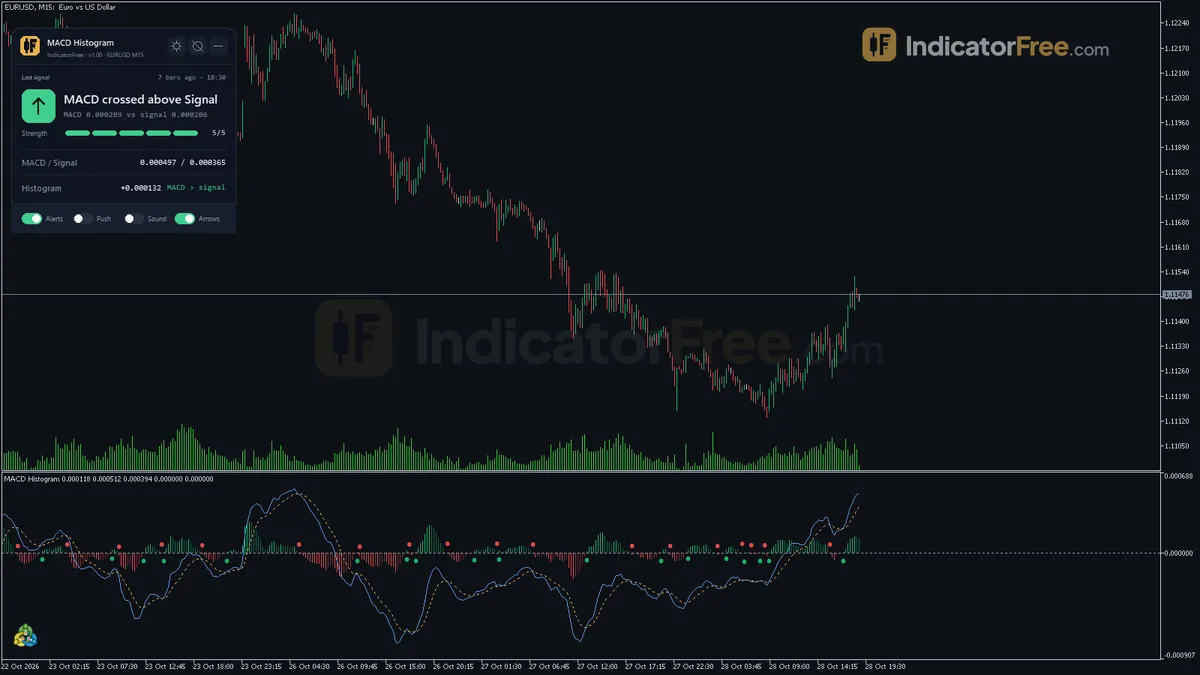
- Repainted
- 0 / 867
- Signals / week
- —
- Tested on
- EURUSD M15
- Tested
- 2026-10-05
Overview
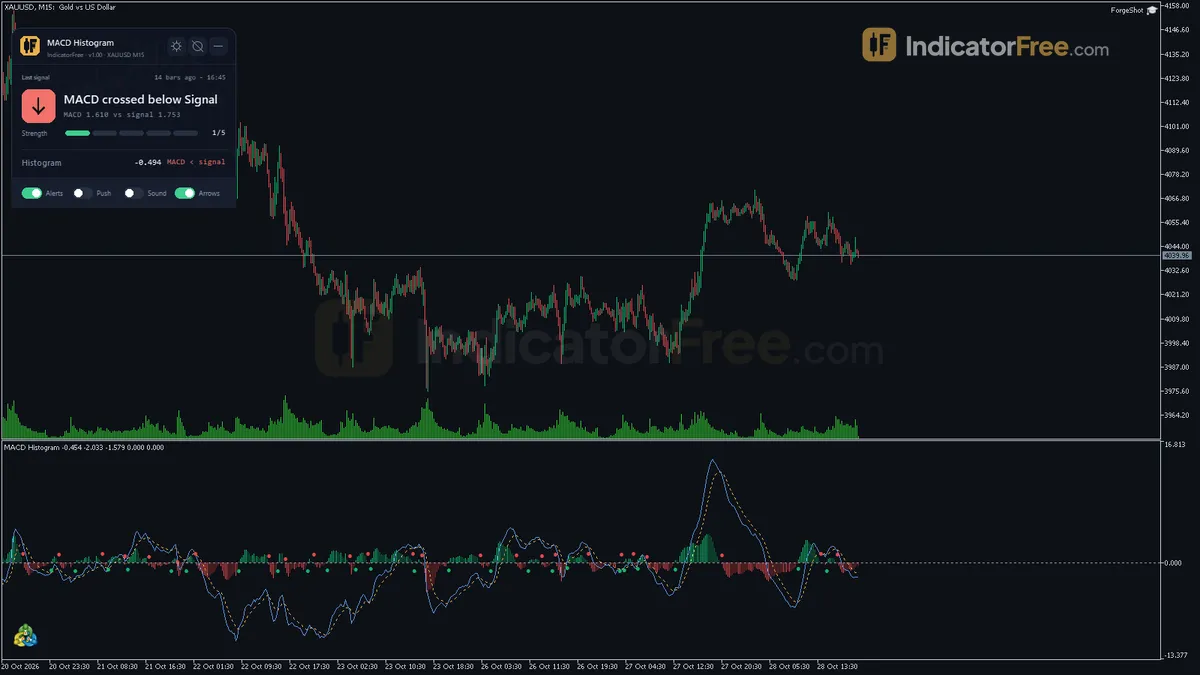
For traders who want a closed-bar momentum trigger: MACD Histogram draws the classic MACD histogram (the MACD line minus its signal line) in its own MT5 subwindow. It also draws the MACD and signal lines, an arrow wherever the histogram crosses zero on a closed bar, and a momentum panel. In the Lab's repaint test, 0 of 867 logged arrows changed after they appeared.
What it draws in the subwindow
MACD is the gap between a fast and a slow exponential moving average. The histogram shows how far MACD sits above or below its own smoothed average, the signal line. This version draws:
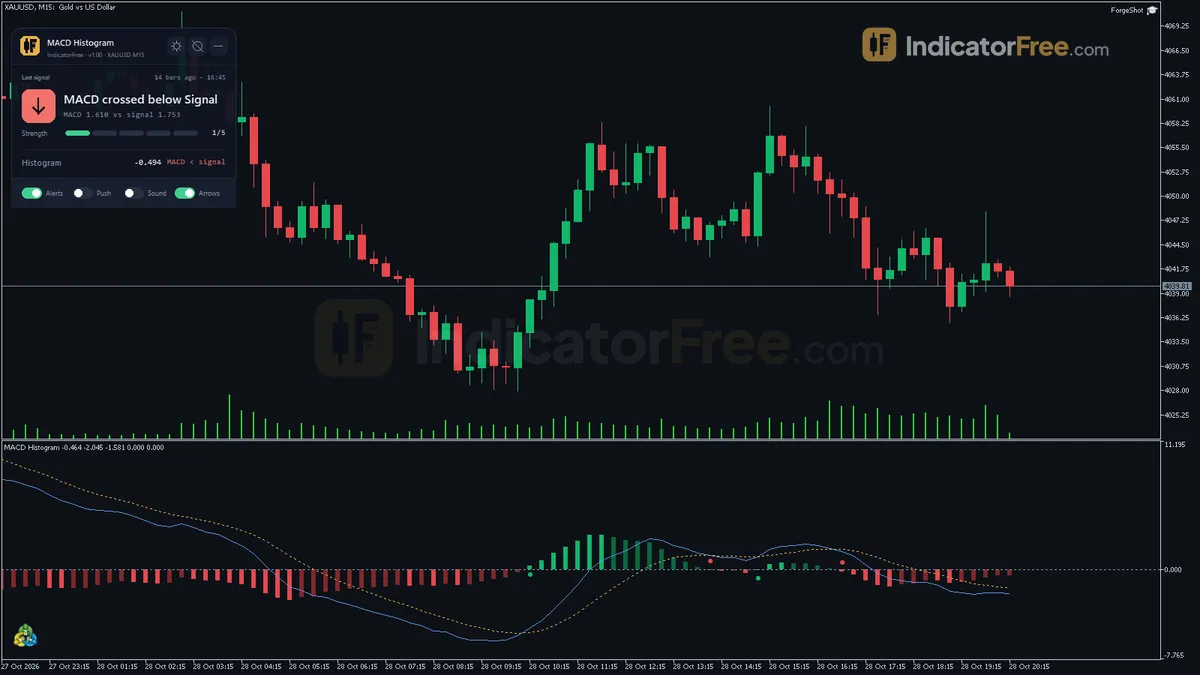
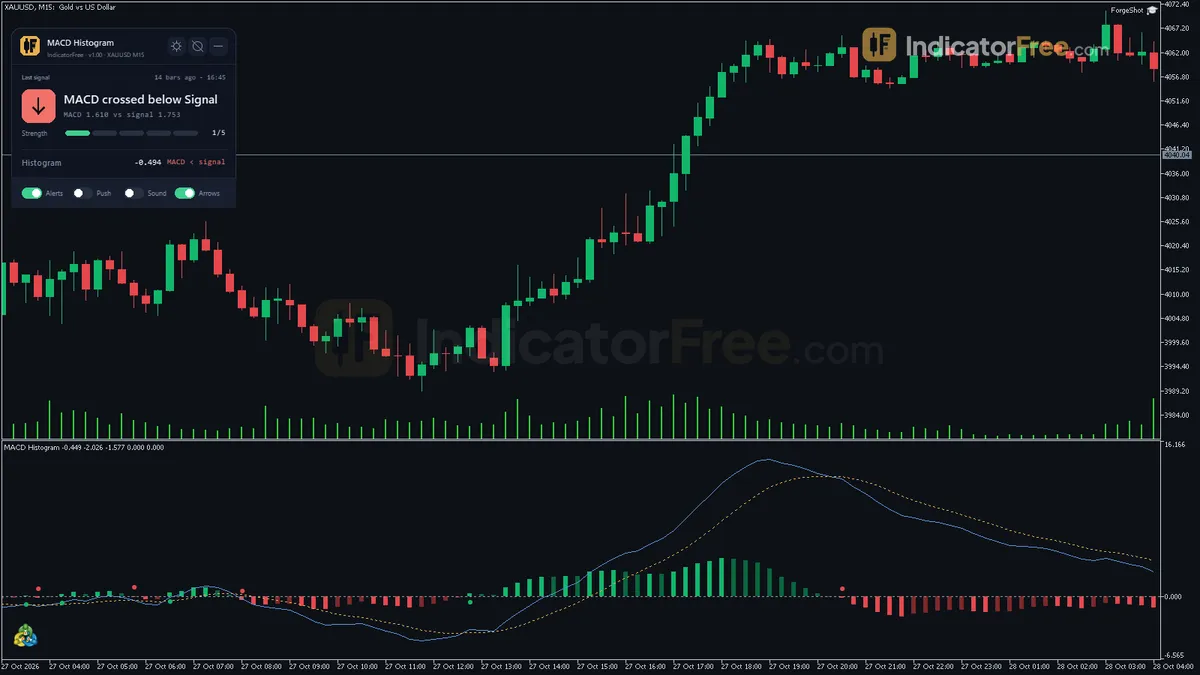
- MACD Histogram: positive when the MACD line is above the signal line and negative when it is below. Each bar is coloured by its sign and by whether it is growing or shrinking, so you get four momentum phases.
- MACD Line and Signal Line: the two reference lines that make up the histogram. You can turn each one off.
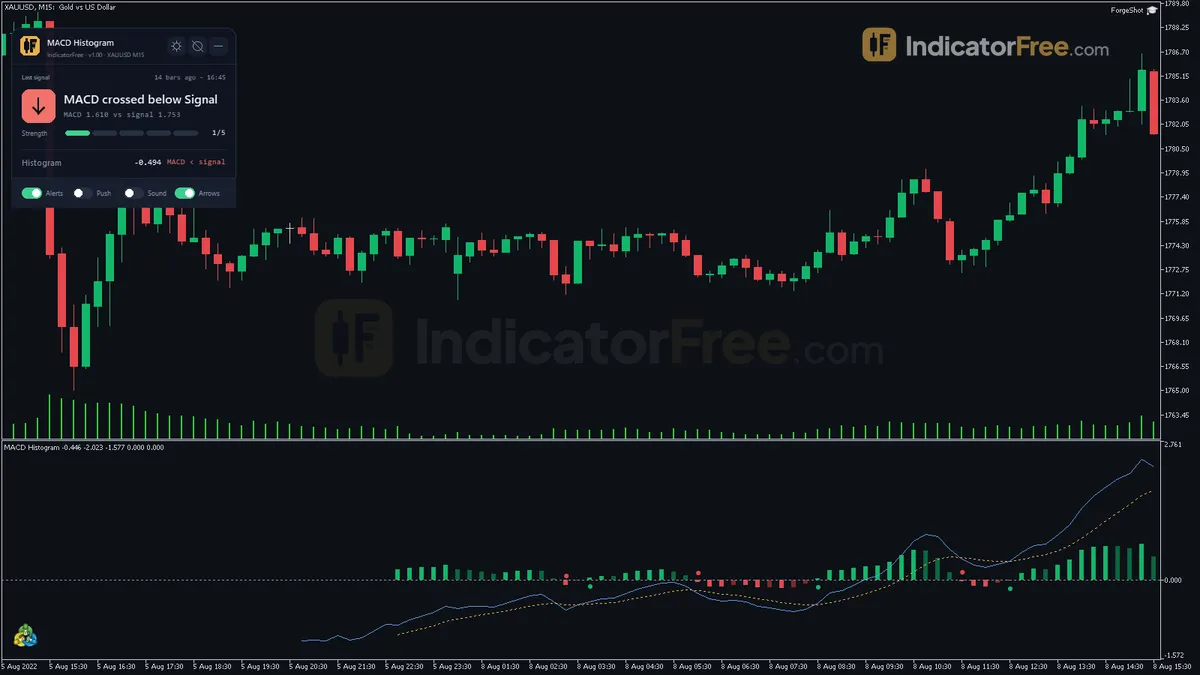
- Bullish Zero Cross and Bearish Zero Cross arrows: drawn on the closed bar where the histogram changes sign.
- Momentum panel: a status box with the last cross, current readings and higher-timeframe bias (details below).
How the Lab tested it
The Lab ran version 1.00 on MT5 build 6230 on 2026-10-05. For the repaint test it replayed EURUSD M15 from 2026-07-06 to 2026-10-02 using Raw Trading Ltd real ticks. It logged every arrow as it appeared, then checked whether any arrow later moved or vanished.
- 867 signals logged, 0 changed. No arrow was redrawn or removed after it printed. In the Lab's EURUSD M15 replay, an arrow you see in history is one you would also have seen live.
- Maximum arrow delay: 0 bars. Each arrow appeared on the bar that closed the cross, not one or more bars later. Arrows wait for the close by design, but they add no extra lag on top of that.
The Lab tested whether the signals hold still. It did not test whether they make money. No result was recorded for how far price moved after an arrow, so treat each cross as a momentum event, not a forecast.
How it works
- 1Takes the chosen price from each bar and runs fast and slow exponential moving averages on it.
EMA = Price x k + EMA_prev x (1 - k), k = 2 / (Period + 1)Inputs: FastEMA, SlowEMA, AppliedPrice - 2MACD is the fast EMA minus the slow EMA, and the signal line is an EMA of the MACD.
MACD = EMA fast - EMA slowInputs: SignalPeriod, ShowMACDLine, ShowSignalLine - 3The histogram is MACD minus signal, coloured by sign and by whether bars grow or shrink.
Histogram = MACD - Signal - 4A zero-cross arrow appears when the histogram changes sign on a closed bar.Inputs: ShowZeroCrossArrows
- 5Optionally computes the same histogram on a higher timeframe and shows its sign as bias.Inputs: ShowHTFBias, HTFTimeframe
Specifications
- Platform
- MetaTrader 5
- Version
- 1.00
- Type
- Indicator
- Window
- Separate window
- Draws
- 1 histo, 2 lines, 2 arrows, 1 panel
- Alerts
- popup, push, sound
- Repaints
- No (0 of 867 signals changed)
- Inputs
- 18
- Tested on
- MT5 build 6230 · 2026-10-05
Repaint test
No repaint detected. In a 6 Jul 2026 – 2 Oct 2026 test on EURUSD M15 (Raw Trading Ltd real ticks), 867 signals were logged at bar close and re-read at the end of the test: 0 changed. Arrows print on the bar that closes the signal, with no delay.
IndicatorFree — tested 2026-10-05 · MT5 build 6230 · Raw Trading Ltd real ticks. Results come from historical data, not live trading, and do not guarantee future results.
What it draws
- A histogram (MACD Histogram) in a separate window.
- A line (MACD Line) from buffer 2.
- A line (Signal Line) from buffer 3.
- Arrows (Bullish Zero Cross) from buffer 4, drawn on the closed bar.
- Arrows (Bearish Zero Cross) from buffer 5, drawn on the closed bar.
- An on-chart panel (Momentum); values shown in the panel are not exposed as buffers.
Inputs
| Input | Default | What it does |
|---|---|---|
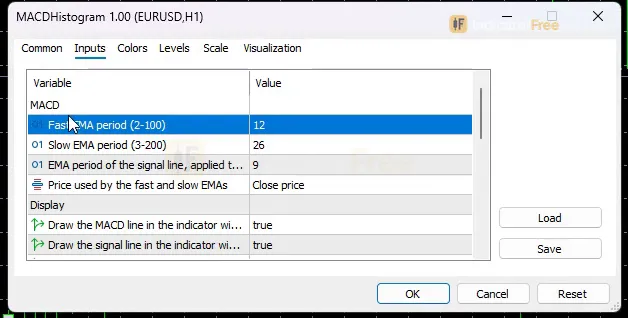
| FastEMA | 12 | Fast EMA period (2-100) |
| SlowEMA | 26 | Slow EMA period (3-200) |
| SignalPeriod | 9 | EMA period of the signal line, applied to the MACD line (2-100) |
| AppliedPrice | Close | Price used by the fast and slow EMAs |
| ShowMACDLine | true | Draw the MACD line in the indicator window |
| ShowSignalLine | true | Draw the signal line in the indicator window |
| ShowZeroCrossArrows | true | Draw arrows where the histogram crosses zero on a closed bar |
| ShowDashboard | true | Show the on-chart status panel |
| PanelScale | 1 | Panel size multiplier (DPI is applied automatically) |
| Theme | Dark | Chart color theme |
| RestoreTheme | true | Restore the original chart colors when removed |
| ShowHTFBias | true | Show the histogram sign of a higher timeframe in the panel |
| HTFTimeframe | H4 | Higher timeframe (row hidden if not above the chart timeframe) |
| AlertOnZeroCross | true | Master switch: alert on a new closed-bar zero cross |
| AlertPopup | true | Popup alert (needs AlertOnZeroCross) |
| AlertPush | false | Push notification (needs AlertOnZeroCross) |
| AlertSound | false | Sound alert (needs AlertOnZeroCross) |
| AlertSoundFile | alert.wav | Sound file played on alert |
How to read it
Installing it in MT5
Copy the .ex5 file to MQL5/Indicators, restart MT5 or refresh the Navigator, then drag it onto the chart.
Reading the four histogram phases
The histogram colour tells you two things: which side of zero momentum is on, and whether it is building or fading.
- Above zero and growing: MACD is pulling further above its signal line. Bullish momentum is building.
- Above zero and shrinking: still bullish, but the gap is closing. This is a warning, not a sell signal.
- Below zero and growing (bars getting more negative): bearish momentum is building.
- Below zero and shrinking: still bearish, but losing force.
The zero-cross arrows
A Bullish Zero Cross prints when the histogram was below zero on the previous closed bar and is at or above zero on the last closed bar. In other words, MACD has crossed above its signal line. A Bearish Zero Cross is the mirror case: at or above zero on the previous closed bar, below zero on the last one. The illustration below shows where each arrow lands on the histogram.
A common misread: the histogram crossing zero is not the same as the MACD line crossing zero. A Bullish Zero Cross can fire while the MACD line is still deep below zero, which is a bounce inside a downtrend. To tell them apart, check the MACD value in the panel or look at where the MACD line sits.
The steps below show how one arrow forms, from the bar close to the alert.
- 1Bar closesOnly closed bars are checked
- 2EMAs updateFastEMA and SlowEMA on AppliedPrice; EMA = Price x k + EMA_prev x (1 - k), k = 2 / (Period + 1)
- 3MACD and signalMACD = EMA fast - EMA slow; signal = SignalPeriod EMA of MACD
- 4HistogramHistogram = MACD - Signal
- 5Sign checkPrevious closed bar vs last closed bar: did the sign flip?
- 6Arrow and alertArrow drawn; alert sent if AlertOnZeroCross is on
The Momentum panel
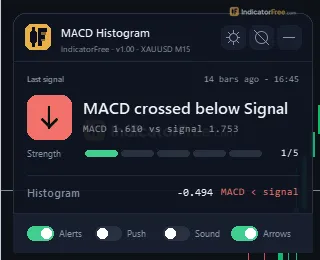
Use the panel to check a cross at a glance. It shows the last zero cross and how many bars ago it happened, the MACD, signal and histogram values, the momentum phase, the length of the current same-sign streak, and the histogram sign on a higher timeframe. Bars ago tells you whether the last cross is still fresh. The same-sign streak tells you how long the histogram has stayed on one side of zero. The HTF bias row shows the histogram sign on HTFTimeframe (default H4). The row is hidden if that timeframe is not higher than your chart's, so on an H4 chart set it to D1 or above.
Inputs to change first
- SignalPeriod (default 9, range 2-100): this is the input that controls the arrows. A higher value smooths the signal line, so you get fewer crosses that come later. A lower value gives more crosses that come sooner. On M5, one starting point is SignalPeriod 12 to cut back-and-forth flips. This value has not been tested by the Lab, so compare it with the default on your own chart.
- FastEMA / SlowEMA (defaults 12 and 26, ranges 2-100 and 3-200): these change the MACD line itself. Keep the defaults unless you have a reason to change them, because most MACD references use 12/26/9.
- AppliedPrice (default Close): the price the two EMAs are calculated on.
- ShowMACDLine / ShowSignalLine / ShowZeroCrossArrows / ShowDashboard: turn on or off what you see.
PanelScaleresizes the panel, and DPI scaling is applied automatically. - Theme / RestoreTheme: the indicator applies a chart colour theme (default Dark). With
RestoreThemeon, your original colours come back when you remove it.
Alerts
AlertOnZeroCross is the master switch. It fires once for each new closed-bar zero cross. Under it, AlertPopup (on by default) opens the MT5 Alert window, AlertPush (off by default) sends a notification to the MetaTrader mobile app, and AlertSound (off by default) plays AlertSoundFile (default alert.wav). Each of the three only works when the master switch is on.
A decision rule for each arrow
- Bullish Zero Cross: consider it only if the panel's HTF bias is positive and the MACD value is above zero, meaning the trend and the momentum turn agree. Skip it if the histogram stayed below zero for fewer than 5 bars before the arrow, because that means the histogram is flipping around zero. Count those bars on the histogram itself, or read bars ago in the panel on the bar just before the arrow: once the arrow prints, the streak counter has already reset to the new side and shows the new streak, not the previous one. The 5-bar cutoff has not been tested by the Lab.
- Bearish Zero Cross: the mirror rule. Consider it only with a negative HTF bias and a MACD value below zero, and skip it if the histogram stayed above zero for fewer than 5 bars before the arrow (same untested cutoff).
This rule is a suggested filter. The Lab has not tested it. Note that requiring the MACD value above zero at a bullish cross (or below zero at a bearish cross) is a strict filter. It will cut most arrows, because the histogram often crosses zero while MACD is still on the other side of zero. The Lab has not measured how many arrows it removes.
Installation
- 1Download MACDHistogram.ex5 from the button above (Google Drive).
- 2In MetaTrader 5: File → Open Data Folder → MQL5 → Indicators. Copy MACDHistogram.ex5 there.
- 3Restart MT5 or right-click Indicators in Navigator → Refresh.
- 4Drag MACD Histogram onto a chart. For push alerts, enable "Allow push notifications" under Tools → Options → Notifications.
- Tested on MT5 build 6230.
Key terms and guides
- MACD histogram
- The MACD histogram is a bar chart under price that shows the gap between the MACD line and its signal line. Bars above zero mean MACD is above its signal. Growing bars mean momentum is building, and shrinking bars mean it is fading.
- Momentum
- Momentum is how fast price is moving in one direction. The Momentum indicator compares the latest close with the close a set number of bars ago, so it shows whether a move is speeding up or slowing down.
- Every tick based on real ticks
- Every tick based on real ticks is the MT5 Strategy Tester mode that replays the actual bid and ask ticks your broker recorded, with the real changing spread, instead of ticks the tester invents from 1-minute bars.
- MACD
- MACD (Moving Average Convergence Divergence) is a momentum indicator: the 12-period EMA minus the 26-period EMA, drawn with a 9-period signal line. It shows whether momentum is building, fading or turning, and whether the bias is bullish (above zero) or bearish (below zero).
- Exponential moving average
- The exponential moving average (EMA) is a moving average that gives the newest closes the most weight, so it turns sooner than a simple moving average. Traders use it to read trend direction and to time entries on pullbacks.
- Signal line
- A signal line is a moving average of an indicator's own line, such as the 9-period average of the MACD line. When the indicator crosses above or below it, traders read it as a change in momentum.
More on this subject: Oscillators & momentum guide, terms and tools
User reviews
No reviews yet. Members who download the tool can review it here.
Sign in and download the tool to review it.
Build a checklist with it
MACD Histogram does one job on the chart: entry signal. Put it on the same chart as the tools below and the IndicatorFree panels merge into one checklist card, ordered trend, zone, signal, risk.
- Trend / contextMarket Structure MapMACD Histogram tells you when; this tells you which way the market leans, so you can skip signals against it.
- Zone / levelFibonacci RetracementShows the zones and levels, so you can see whether a signal from MACD Histogram fires at a level worth trading.
The Lab has not tested these combinations. Each tool is tested on its own; the card only lines up what each one says. Free members get 2 new tools a day. If one has to wait until tomorrow, install BlackBox to raise the limit to 5 a day (20 on a live account).
FAQ
Does MACD Histogram repaint?
No repaint detected. In a 6 Jul 2026 – 2 Oct 2026 test on EURUSD M15 (Raw Trading Ltd real ticks), 867 signals were logged at bar close and re-read at the end of the test: 0 changed. Arrows print on the bar that closes the signal, with no delay.
Can I use MACD Histogram in an EA?
Yes. Read buffer 4 (Bullish Zero Cross) with iCustom() on bar 1 — the last closed bar.
Why can’t my EA read the zones?
Zones and the panel are chart objects, not indicator buffers, so iCustom() does not return them.
How do I get alerts on my phone?
Enter your MetaQuotes ID under Tools → Options → Notifications, tick "Enable push notifications", and keep the push alert input on.
Why does it open in a separate window?
It plots values on their own scale, so MT5 draws it below the price chart.
Does it work on other pairs?
Tested on EURUSD only; other symbols not tested.
Does it work on other symbols or timeframes than the one tested?
The arrows use the same closed-bar check on every chart, but the Lab's repaint test covered EURUSD M15 only. The Lab has not tested other symbols or timeframes, so check its behaviour on your own chart before you rely on it.
The histogram crossed zero during the bar but no arrow appeared. Is something wrong?
No. Arrows and alerts only use closed bars. A histogram that dips below zero during a bar and recovers before the close is not a cross. The arrow appears once the bar closes on the other side of zero.
Will it change my chart colours?
Yes, it applies the theme set in the Theme input (Dark by default). With RestoreTheme left on, your original chart colours come back when you remove the indicator.
How do I get zero-cross alerts on my phone?
Keep AlertOnZeroCross on and set AlertPush to true. MT5 then sends a notification to the MetaTrader mobile app linked to your terminal's push notification settings. Sound alerts work the same way through AlertSound and AlertSoundFile.
How big is the download and which MT5 build was it checked on?
The file is 139.5 KB. The Lab ran it on MT5 build 6230.
Changelog
- 1.00Initial release: classic Gerald Appel MACD histogram (EMA-based signal line) with 4-color momentum phase coloring, optional MACD/signal reference lines, closed-bar zero-cross arrows, a same-sign streak counter, an. · 2026-10-09
Final verdict
The Lab's verdict
MACD Histogram is a faithful version of the classic MACD (Gerald Appel's design, with an EMA-based signal line) that you can trust not to rewrite its own history. That clean repaint result is its main strength, and it is the right base for alerts, backtesting by eye, and journaling. The four momentum phases, the streak counter and the HTF bias row add useful context without hiding the standard MACD calculation.
Its limits are built into how MACD works, not bugs. A zero cross is a crossover of two moving averages, so it always confirms a turn after it has started. In sideways markets it produces bursts of opposite arrows. It gives no stop, target or position size. The repaint check also covered one symbol on one timeframe, so it shows that the arrows stay fixed, not that they suit every market.
The chart below sums up when the tool fits and when you should look elsewhere.
- –You want a momentum trigger that stays fixed after the bar closes
- –You already have a trend or level read and need a timing cue
- –You can wait for the bar to close before acting
- –You want the higher-timeframe histogram sign without a second chart
- –You need a complete setup with stop and target levels
- –Price is ranging and arrows flip every few bars
- –You need the earliest possible turn, not a confirmed one
- –You want a tested win rate: the Lab has not measured one
Settings to start with
Start with the defaults (12/26/9 on Close, HTF bias on H4) on M15 to H1 charts. On those charts the H4 bias row is visible. The defaults use the classic 12/26/9 settings with an EMA signal line (MT5's built-in MACD uses an SMA signal, so values differ slightly). Turn on AlertPush if you trade away from the screen. If you trade above H4, raise HTFTimeframe so the bias row stays visible.