Skip to content
MT5MT4soonTradingViewsooncTradersoonNinjaTradersoonPythonsoon
IndicatorSupport, resistance & levelsMT5No repaint

Fibonacci Retracement

Free MT5 Fibonacci Retracement indicator: auto levels, Golden Zone and rejection arrows. Lab: 0 of 711 arrows repainted on EURUSD M15.

Add to a kit
CompareRequest a variant
Embed
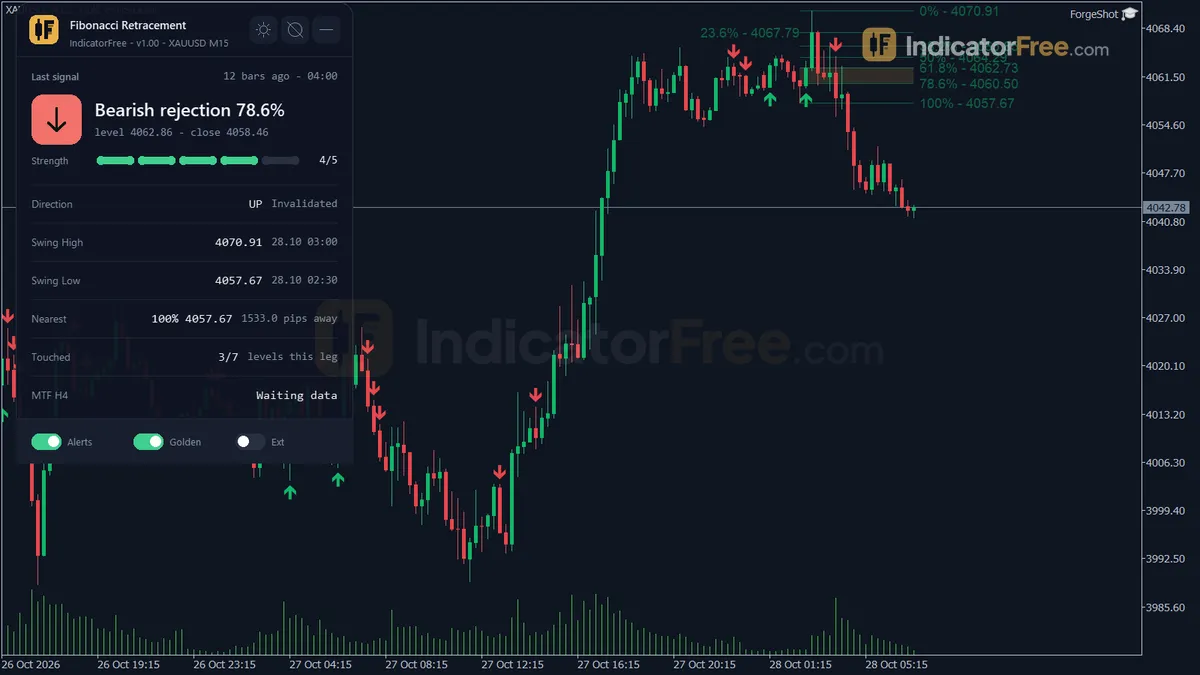
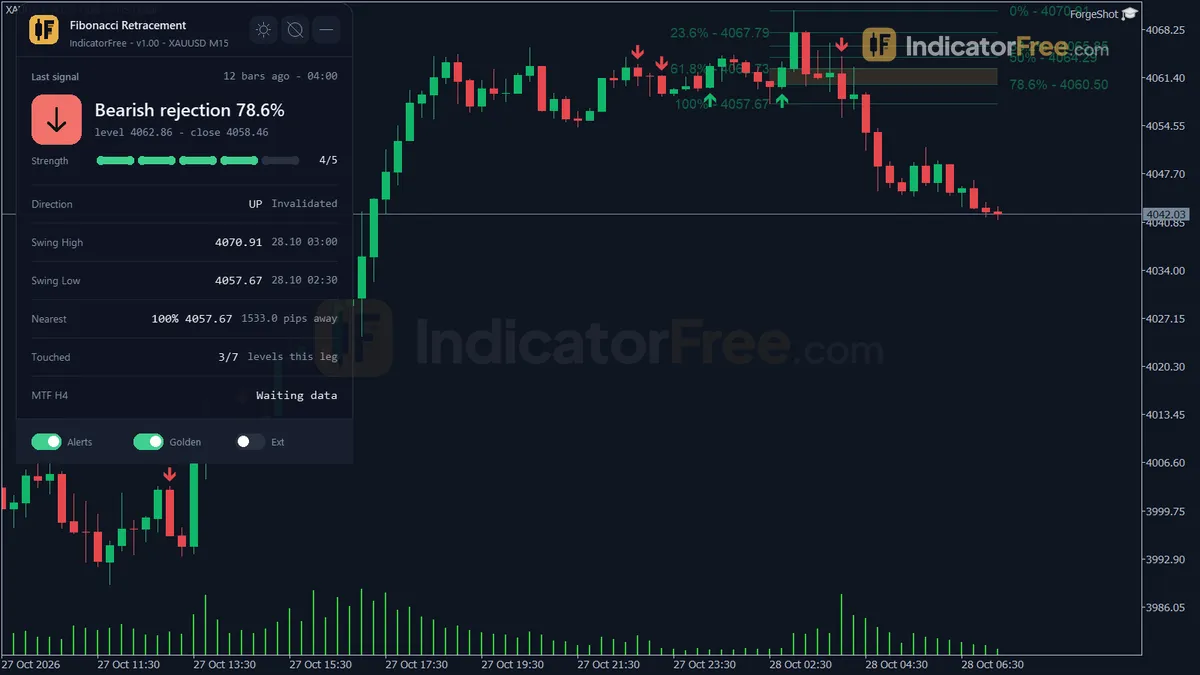
Fibonacci Retracement on XAUUSD M15, MT5 chart with default settings: bullish rejection, bearish rejection, fib levels
Screenshots from a real MT5 chart · 9 · scroll sideways
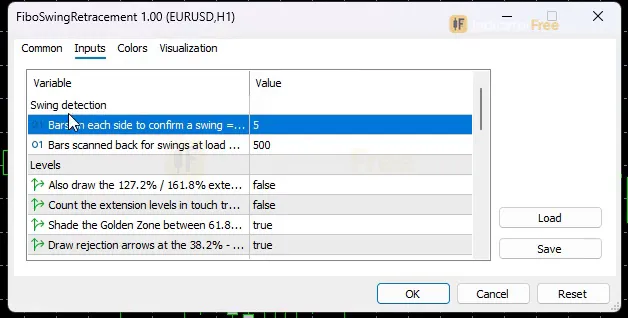
Fibonacci Retracement inputs window in MetaTrader 5 with the default settings
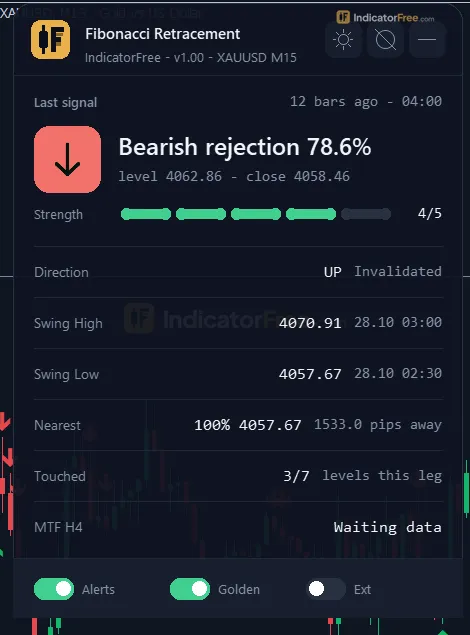
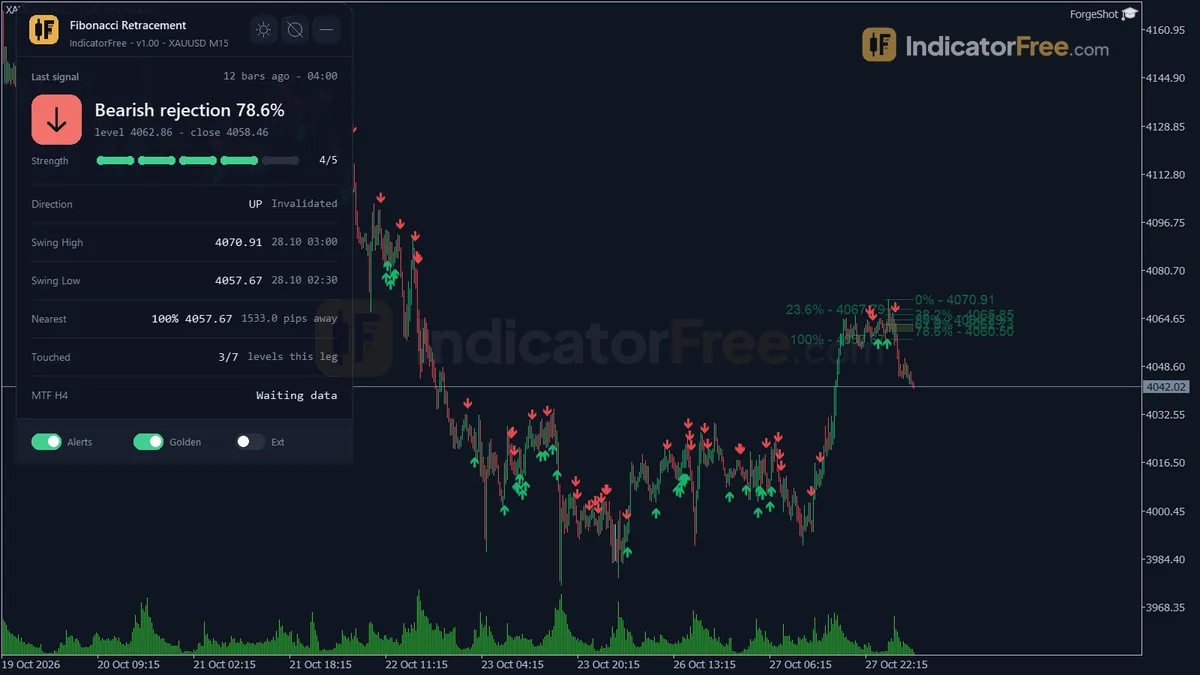
Fibonacci Retracement Bearish Rejection arrow on XAUUSD M15, 28 Oct 2026 04:00
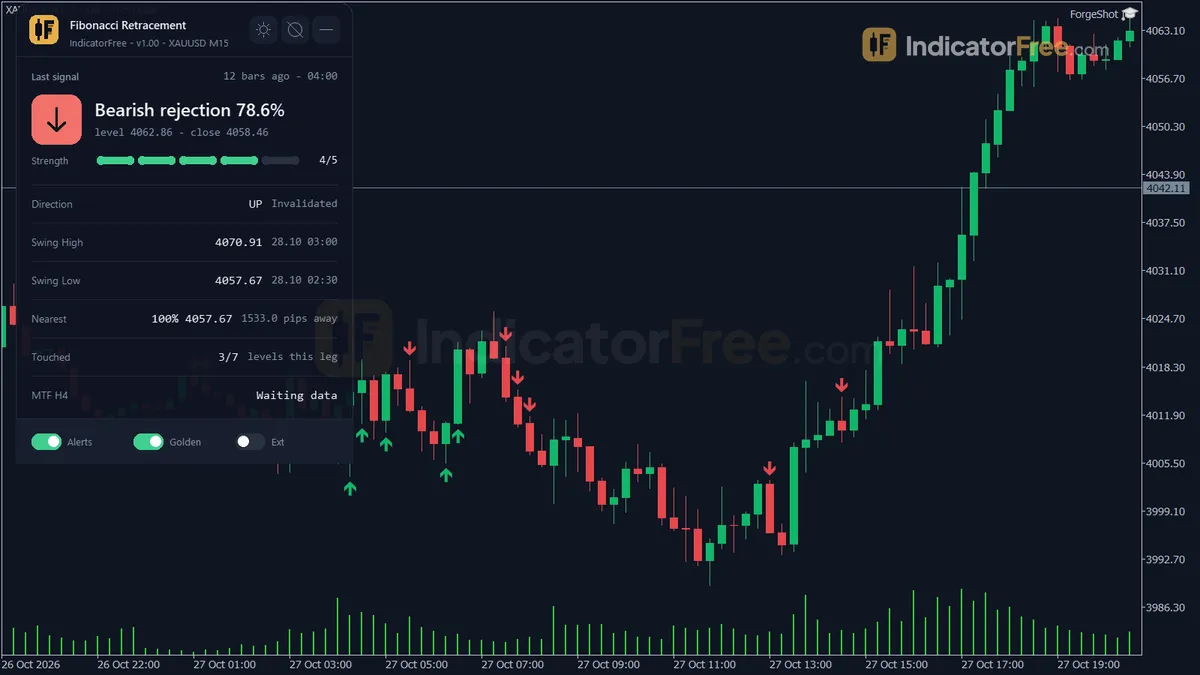
Fibonacci Retracement Bearish Rejection arrow on XAUUSD M15, 27 Oct 2026 14:30
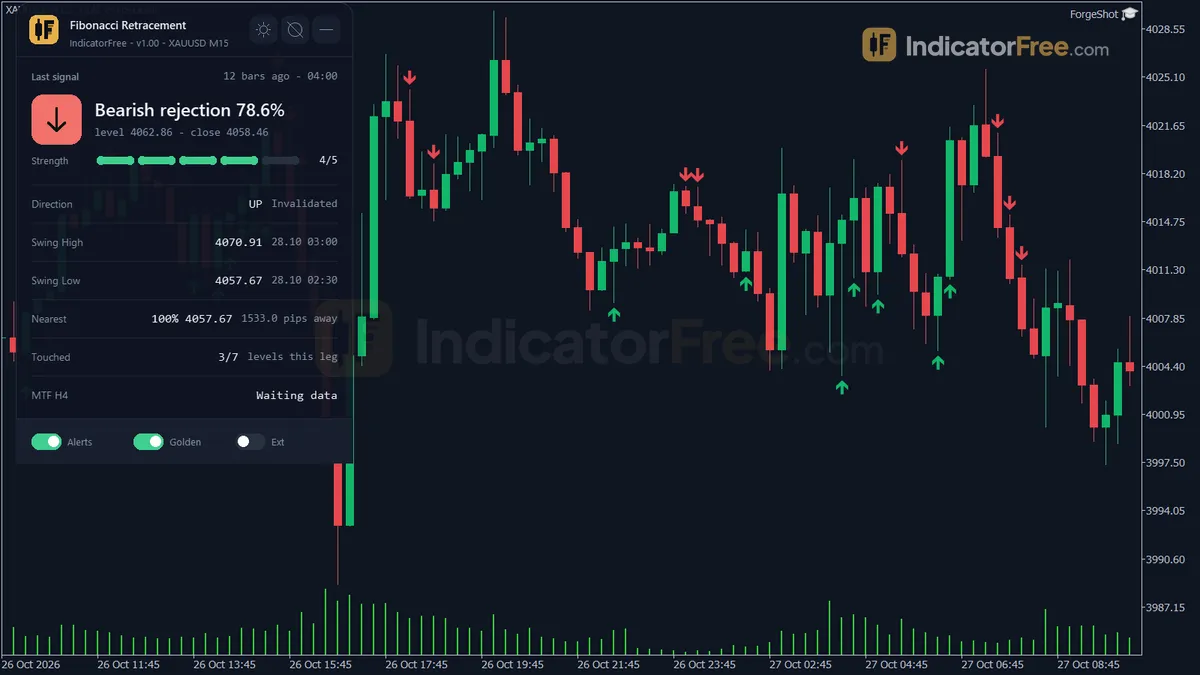
Fibonacci Retracement Bullish Rejection arrow on XAUUSD M15, 27 Oct 2026 04:15
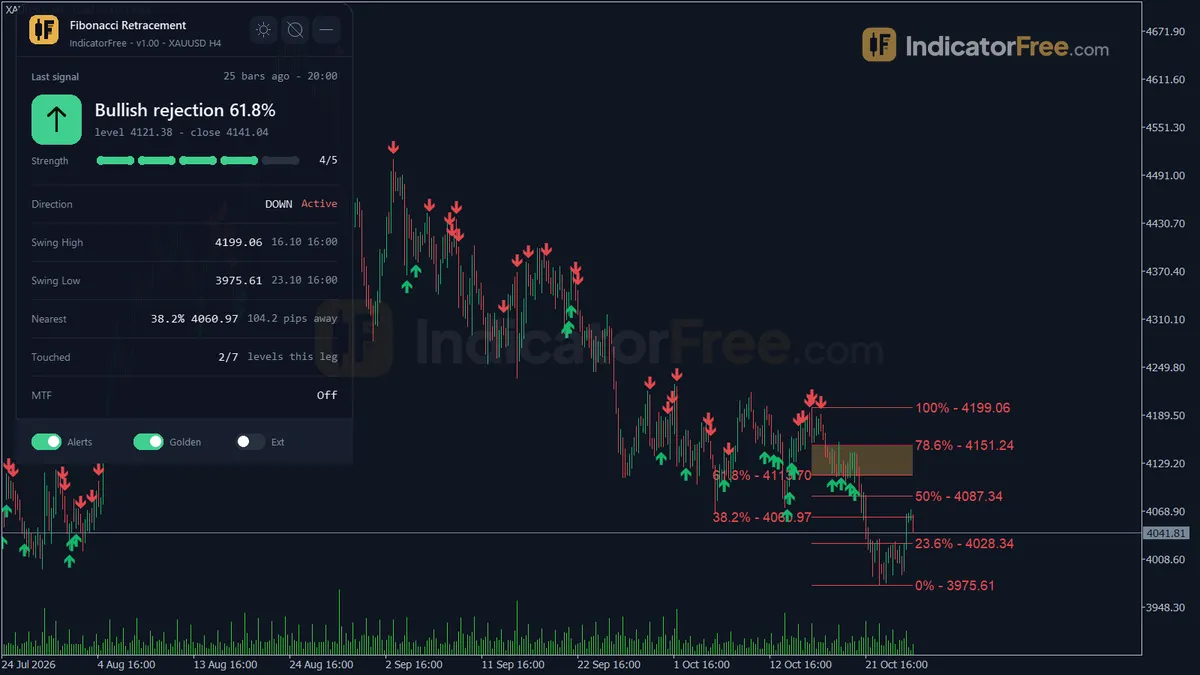
Fibonacci Retracement on XAUUSD H4 (another timeframe)
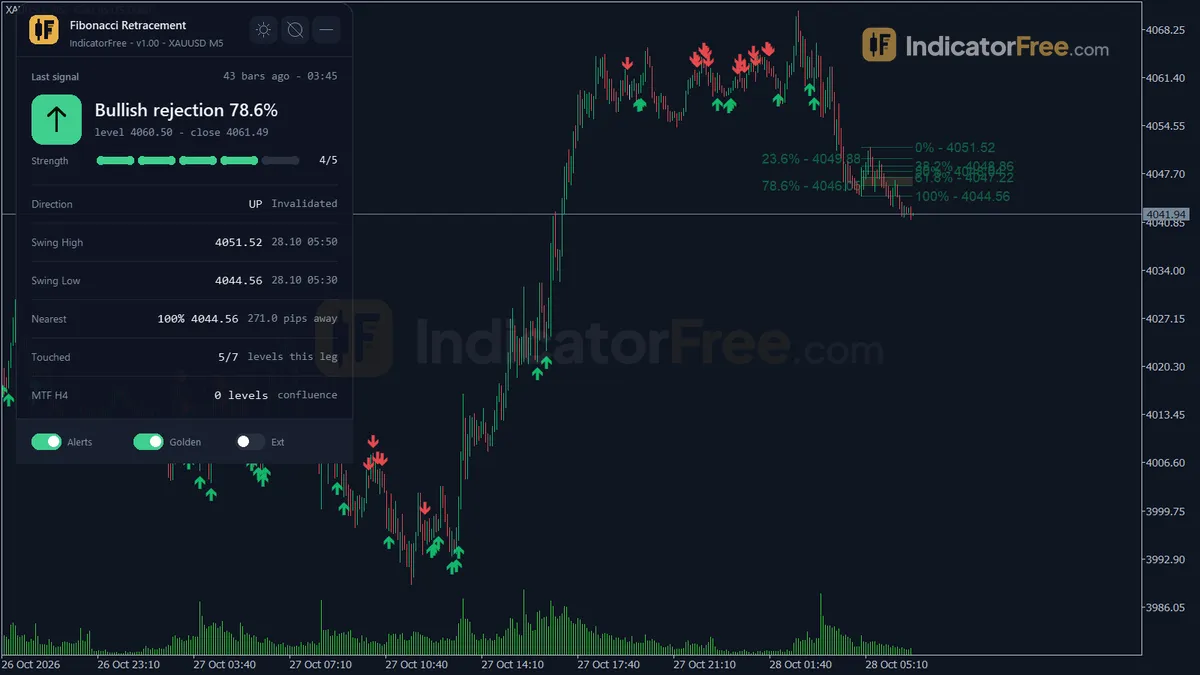
Fibonacci Retracement on XAUUSD M5 (another timeframe)
Fibonacci Retracement on-chart panel: last signal and status
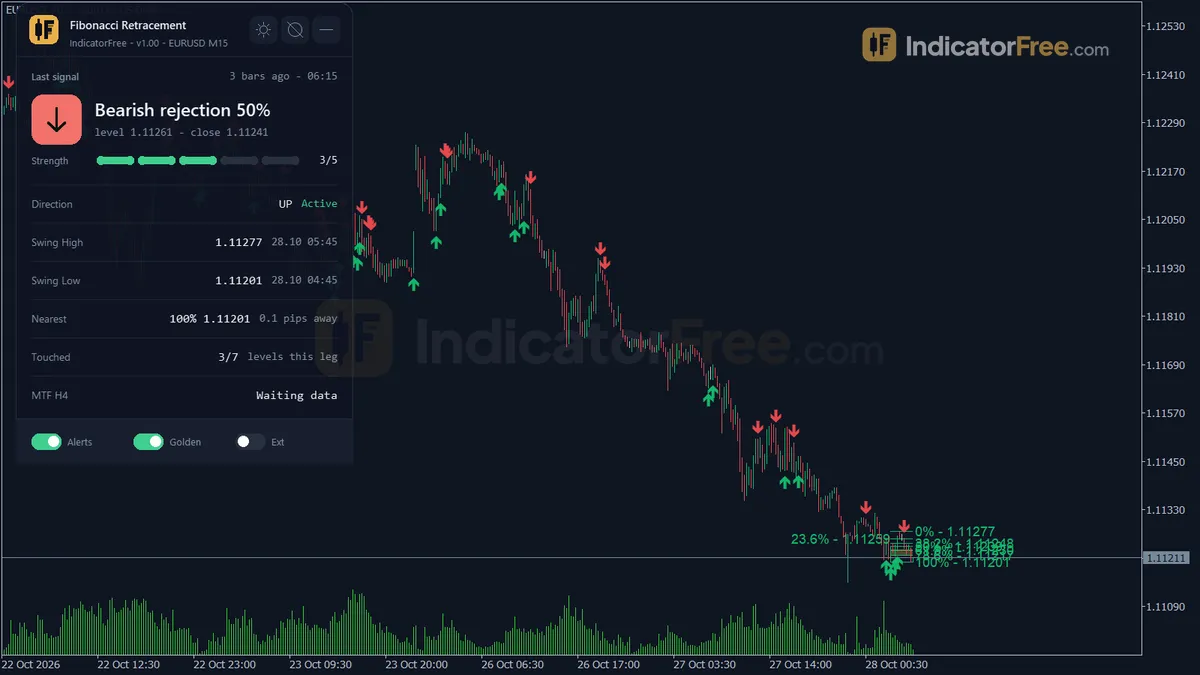
Fibonacci Retracement on EURUSD M15
Fibonacci Retracement zoomed out on XAUUSD M15: several weeks of history
Test verdictPassed
Repainted
0 / 711
Signals / week
≈ 55.9
Tested on
EURUSD M15
Tested
2026-10-04
Download free · Google DriveFree account needed · sign in with Google in one clickFree — share it freely. Just don’t sell, crack or modify it. Licencev1.00 · 152.5 KB · .ex5
Lab pick — built by the lab, not from a member request. Want something like it? Request a tool

Overview

Fibonacci Retracement is a free MT5 indicator that finds the latest swing leg on your price chart and draws its 0–100% levels with a shaded Golden Zone. It also marks Bullish and Bearish Rejection arrows at the 38.2%–78.6% levels. In the Lab's repaint test, 0 of 711 arrows changed after they appeared, and none showed up late.

It is for traders who trade pullbacks and want the grid drawn and kept up to date for them, so they don't have to drag the tool by hand.

A Fibonacci retracement measures how far price pulls back into its last swing, as a percentage of that swing. This tool only does the drawing and the signalling. The glossary covers the theory.

What it puts on your chart

Everything sits on the main price chart. There is no subwindow.

  • Fib Levels: lines from the swing high to the swing low. They take one colour on an up leg and another on a down leg. You can also show the 127.2% and 161.8% extensions, but they are for reference only.
  • Golden Zone: a shaded rectangle between 61.8% and 78.6%.
  • Level Labels: the percentage next to each line.
  • Bullish Rejection / Bearish Rejection arrows: they appear only at the 38.2%, 50%, 61.8% and 78.6% levels.
  • Fib Status panel: the last rejection signal, the leg's direction and status, the swing high and low prices, the nearest level with its distance in pips, how many levels have been touched, and how many levels match a higher timeframe.

The picture below is an illustration of a typical signal, not Lab data. On bar 11 a red candle pokes into the Golden Zone but closes below 61.8%. That is only a touch, so there is no arrow. Bar 12 dips through 61.8% and closes green above it, which gives a Bullish Rejection. No other bar in the picture closes green across a level between 38.2% and 78.6%, so no other bar gets an arrow.

Illustration of a typical Bullish Rejection at 61.8% on an up legIllustration
0% (swing high)1.1100023.6%1.1076438.2%1.1061850%1.10500Golden Zone61.8%-78.6%Bullish Rejection

How the Lab tested it

  • Version and platform: the Lab ran version 1.00 on MT5 build 6230 on 2026-10-04.
  • Data: EURUSD M15 from 2026-07-06 to 2026-10-02, using real ticks from Raw Trading Ltd.
  • Repaint check: the Lab logged every arrow as it appeared and checked whether it later changed or moved. The longest delay between the signal bar and its arrow was 0 bars. The arrow you see on a closed bar is the one you would have seen live.

The test covered the arrows only. The Fibonacci levels are deleted and redrawn on purpose whenever the leg changes, and the level-touch alerts were not part of the test.

What the numbers mean for you

  • Direction: 50.2% of all arrows reached 1 ATR in the arrow's direction before 1 ATR against it. That is a coin flip. On its own, the arrow gave no edge in this test, so use it to time an entry and get the direction from something else. The chart below shows that the split by direction is almost even.
Arrows that reached +1 ATR before -1 ATR (EURUSD M15, Lab test)Illustration
Bullish Rejection (364 arrows)
49.9%
Bearish Rejection (347 arrows)
50.6%

Scale zoomed in to show the difference (bars do not start at zero).

  • Speed: the median was 2 bars until price hit +1 ATR or −1 ATR (3 for bullish arrows, 2 for bearish). On M15 you know within about 30 minutes whether the reaction held.
  • Dead signals: only 2.4% of arrows reached neither +1 ATR nor −1 ATR within 20 bars. Almost every arrow is followed by a 1 ATR move one way or the other.
  • Frequency: there were 55.9 arrows per week: 28.6 bullish and 27.3 bearish. That is about 11 per weekday on M15, far too many to take every one.

Who it is for

  • Pullback traders who already decide trend direction their own way and want a level and a candle-close trigger in one place.
  • Traders who keep redrawing Fibonacci by hand and want the grid to follow each new swing on its own.

How it works

  1. 1
    Finds swing highs and lows using the pivot bars within the lookback window and builds a zigzag from them.Swing high if High is above the pivot bars on both sidesInputs: PivotBars, LookbackBars
  2. 2
    Takes the latest swing leg and draws retracement levels from 0 to 100 percent, plus 127.2 and 161.8 if enabled.Up leg: Level = High - ratio x (High - Low). Down leg: Level = Low + ratio x (High - Low)Inputs: ShowExtensions, ShowGoldenZone
  3. 3
    A bar crossing a level is a touch. Rejection is a close beyond the level in the leg direction.Up leg: Close > Open and Close > levelInputs: EnableRejectionSignal
  4. 4
    Strength is 2, 3 or 4 by level depth, plus one if a higher timeframe level matches. Max 5.Match if abs(level - HTF level) <= ConfluenceToleranceATR x ATRInputs: EnableMTFConfluence, ConfluenceTF, ConfluenceToleranceATR
  5. 5
    The leg is dropped when price closes beyond its start, and a new one is built from the next swing.

Specifications

Platform
MetaTrader 5
Version
1.00
Type
Indicator
Window
Main chart
Draws
2 arrows, 3 zones, 1 panel
Alerts
popup, push, sound
Repaints
No (0 of 711 signals changed)
Inputs
20
Tested on
MT5 build 6230 · 2026-10-04

Repaint test

Signals logged live
711
Changed after close
0
Arrow delay
None

No repaint detected. In a 6 Jul 2026 – 2 Oct 2026 test on EURUSD M15 (Raw Trading Ltd real ticks), 711 signals were logged at bar close and re-read at the end of the test: 0 changed. Arrows print on the bar that closes the signal, with no delay.

IndicatorFree — tested 2026-10-04 · MT5 build 6230 · Raw Trading Ltd real ticks. Results come from historical data, not live trading, and do not guarantee future results.

Signal statistics

Price moved 1×ATR in the signal direction first50.2%
Price moved 1×ATR against it first47.4%
Neither within 20 bars2.4%

Over 6 Jul 2026 – 2 Oct 2026 on EURUSD M15, the indicator printed 711 arrows. After 50.2% of them, price moved 1×ATR(14) in the arrow's direction before moving 1×ATR against it (median 2 bars). 2.4% reached neither level within 20 bars.

This measures price movement after the arrow, not a trading result. It includes no spread, commission, stop loss or position sizing.

What it draws

  • Arrows (Bullish Rejection) from buffer 0, drawn on the closed bar.
  • Arrows (Bearish Rejection) from buffer 1, drawn on the closed bar.
  • Rectangles (Fib Levels) drawn as chart objects, not buffers — they are not readable by iCustom() in an EA.
  • Rectangles (Golden Zone) drawn as chart objects, not buffers — they are not readable by iCustom() in an EA.
  • Rectangles (Level Labels) drawn as chart objects, not buffers — they are not readable by iCustom() in an EA.
  • An on-chart panel (Fib Status); values shown in the panel are not exposed as buffers.

Inputs

InputDefaultWhat it does
PivotBars5Bars on each side to confirm a swing = confirmation lag (2-20)
LookbackBars500Bars scanned back for swings at load and on the higher timeframe (100-3000)
ShowExtensionsfalseAlso draw the 127.2% / 161.8% extension levels (reference only)
AlertOnExtensionsfalseCount the extension levels in touch tracking and touch alerts
ShowGoldenZonetrueShade the Golden Zone between 61.8% and 78.6%
EnableRejectionSignaltrueDraw rejection arrows at the 38.2% - 78.6% levels
EnableAlertPopuptruePopup alert on a first level touch or a rejection signal
EnableAlertPushfalsePush notification to the phone
EnableAlertSoundfalsePlay a sound
EnableMTFConfluencetrueCompare the levels with the Fibonacci levels of a higher timeframe
ConfluenceTFH4Higher timeframe used for confluence (must be above the chart timeframe)
ConfluenceToleranceATR0.25Levels match when closer than this x ATR(14) of the higher timeframe (0.05-1.0)
LineColorUpC'18,183,106'Level color on an up leg
LineColorDownC'229,72,77'Level color on a down leg
GoldenZoneColorC'232,176,75'Golden Zone color (blended with the chart background)
ShowDashboardtrueShow the status panel
DashCornerLeft UpperPanel corner
PanelScale1Panel size multiplier (DPI is applied automatically)
ThemeDarkChart color theme
RestoreThemetrueRestore the original chart colors when the indicator is removed

How to read it

Install

Copy the indicator file (152.5 KB) into your MT5 MQL5/Indicators folder, refresh the Navigator, and drag the indicator onto a chart.

How the leg is found and redrawn

  1. Find the swings. The indicator scans the last LookbackBars bars (default 500, range 100–3000). A bar counts as a swing high when its high is above the PivotBars bars on both sides, and the same in reverse for a swing low.
  2. Draw the latest leg. It takes the most recent leg between swings and draws the levels on it:
    • On an up leg: Level = High − ratio × (High − Low).
    • On a down leg: Level = Low + ratio × (High − Low).
  3. Replace the leg. The leg is dropped when price closes beyond the point where the leg started. When a new swing pivot replaces the current leg, all lines and labels are deleted and drawn again, and the Golden Zone is redrawn with them. You always see one grid: the latest leg.

Reading a rejection arrow

When a bar crosses a level, that is a touch. A rejection needs more: the bar has to close beyond the level, in the direction of the leg.

  • Bullish Rejection: on an up leg, a closed bar trades through a level between 38.2% and 78.6% and closes bullish (close above open) above that level.
  • Bearish Rejection: on a down leg, a closed bar trades through a level between 38.2% and 78.6% and closes bearish (close below open) below that level.

The flow below shows how one arrow forms.

How one Bullish Rejection arrow forms
  1. 1Swing confirmedA high or low has PivotBars bars on each side; this is the confirmation lag
  2. 2Leg drawnLevels 0-100% and the Golden Zone (61.8%-78.6%) are drawn on the latest leg
  3. 3TouchA bar trades through a level; the first touch can trigger a popup
  4. 4Rejection closeUp leg: the bar closes above open and above a 38.2%-78.6% level
  5. 5Arrow on the closed barBullish Rejection is drawn
  6. 6Leg endsA close beyond the leg's start or a new swing pivot replaces the grid

Reading the Fib Status panel

The panel answers three questions without you having to measure anything:

  • Which way is the leg going? The leg direction and status.
  • Where is the nearest level? The nearest level and its distance in pips.
  • Does a higher timeframe agree? The higher timeframe confluence count.

Use DashCorner to move the panel and PanelScale to resize it. ShowDashboard hides it.

Inputs to change first

  • PivotBars (default 5, range 2–20) is the confirmation lag. A lower value finds smaller swings sooner, so the grid is redrawn more often. A higher value waits for bigger swings and gives fewer, larger legs.
  • EnableMTFConfluence / ConfluenceTF / ConfluenceToleranceATR compare your levels with the Fibonacci levels of a higher timeframe (default H4). Two levels match when they are closer than 0.25 × ATR(14) of that timeframe. Each level gets a strength of 2, 3 or 4 based on how deep it is, plus 1 for a match, up to 5. A smaller tolerance counts only tight matches.
  • ShowGoldenZone turns the shading off if it clutters your chart. ShowExtensions adds the 127.2% and 161.8% lines.
  • EnableRejectionSignal turns the arrows off if you only want the levels.
  • Theme recolours the chart (default Dark). With RestoreTheme on, your original colours come back when you remove the indicator.

Alerts

  • Popup (EnableAlertPopup, on by default) appears in the MT5 Alert window on your desktop. It fires on a first level touch or on a rejection signal.
  • Push (EnableAlertPush) sends the alert to the MT5 app on your phone. Your MetaQuotes ID must be set in the terminal.
  • Sound (EnableAlertSound) plays in the terminal.

Push and sound are off by default.

A decision rule for each arrow

These rules are untested ideas, not Lab results. Compare them with taking every arrow.

  • Bullish Rejection: take it only if all three are true:
    1. The arrow is in the Golden Zone, or the panel shows a higher timeframe confluence count above zero.
    2. The swing high on the panel is at least 1 ATR above the arrow bar's close. The panel does not show ATR, so add the standard ATR(14) to the chart and read its value.
    3. The panel still shows the up leg as the current leg.
  • Bearish Rejection: the mirror image. The swing low must be at least 1 ATR below the close.
  • Skip either arrow when its level has no confluence and sits outside the Golden Zone.

Common misreads

  • A popup is not always an arrow. First touches also trigger popups. Check the chart before you act.
  • A wick is not a rejection. A red bar that wicks into the Golden Zone on an up leg is only a touch. Wait for a bar that closes green above the level.
  • Old arrows can outlive their lines. When the grid is redrawn, arrows from the previous leg stay at prices where no line exists any more. Judge only arrows on the current leg.

Installation

  1. 1Download FiboSwingRetracement.ex5 from the button above (Google Drive).
  2. 2In MetaTrader 5: File → Open Data Folder → MQL5 → Indicators. Copy FiboSwingRetracement.ex5 there.
  3. 3Restart MT5 or right-click Indicators in Navigator → Refresh.
  4. 4Drag Fibonacci Retracement onto a chart. For push alerts, enable "Allow push notifications" under Tools → Options → Notifications.
  5. Tested on MT5 build 6230.

Key terms and guides

Fibonacci extension
A Fibonacci extension estimates how far a trend may run after a pullback. You take a fixed share of the previous swing (61.8%, 100% or 161.8%) and add it to the pullback point. Traders mostly use these levels as profit targets.
Fibonacci retracement
A Fibonacci retracement is a set of horizontal levels drawn across one finished price move, at 23.6%, 38.2%, 50%, 61.8% and 78.6% of its size. Traders use them to judge where a pullback may pause before the original move resumes.
Golden ratio
The golden ratio in trading is the 61.8% Fibonacci level (161.8% for targets). Traders measure a finished price move and watch the point where a pullback has given back 61.8% of it as a likely place for the trend to resume.
Push notifications
Push notifications are short messages your trading platform or charting app sends to your phone when something you chose to watch happens, such as price reaching a level, an order filling or a stop being hit, even when the app is closed.
Swing High/Low
A swing high is a candle whose high sits above the highs of the candles on both sides of it. A swing low is a candle whose low sits below the lows on both sides. Together they mark the turning points of price.
Higher Timeframe
A higher timeframe is any chart period longer than the one you trade on, such as the daily chart for someone trading the 1-hour chart. Traders use it to see the bigger trend and the main price levels around their smaller-chart trades.

More on this subject: Supply, demand & key levels guide, terms and tools

User reviews (1)

★★★★★StefanoDownloaded v1.00USDJPY H1Demo account2026-10-25

Facile da installare e funziona bene anche su Nikkei mi ha già tracciato subito i livelli appena l'ho installato è adatto anche ai principianti

IndicatorFree team: Grazie mille per la tua utile recensione. Ti auguro transazioni di successo!
Write a review

Sign in and download the tool to review it.

Build a checklist with it

Fibonacci Retracement does one job on the chart: zone / level. Put it on the same chart as the tools below and the IndicatorFree panels merge into one checklist card, ordered trend, zone, signal, risk.

  • Trend / contextADXAdds the trend side: which way the market leans before you act on Fibonacci Retracement.
  • Entry signalFalse Breakout TrapAdds the entry signal: the moment to act once Fibonacci Retracement has set the scene.

The Lab has not tested these combinations. Each tool is tested on its own; the card only lines up what each one says. Free members get 2 new tools a day. If one has to wait until tomorrow, install BlackBox to raise the limit to 5 a day (20 on a live account).

FAQ

Does Fibonacci Retracement repaint?

No repaint detected. In a 6 Jul 2026 – 2 Oct 2026 test on EURUSD M15 (Raw Trading Ltd real ticks), 711 signals were logged at bar close and re-read at the end of the test: 0 changed. Arrows print on the bar that closes the signal, with no delay.

Can I use Fibonacci Retracement in an EA?

Yes. Read buffer 0 (Bullish Rejection) with iCustom() on bar 1 — the last closed bar.

Why can’t my EA read the zones?

Zones and the panel are chart objects, not indicator buffers, so iCustom() does not return them.

How do I get alerts on my phone?

Enter your MetaQuotes ID under Tools → Options → Notifications, tick "Enable push notifications", and keep the push alert input on.

Does it work on other pairs?

Tested on EURUSD only; other symbols not tested.

Which timeframe should I use it on?

It loads on any MT5 timeframe. `ConfluenceTF` must be above your chart's timeframe, so on an H4 chart or higher, set it to D1 or above, or turn `EnableMTFConfluence` off.

Price made a new swing high. Why hasn't the Fibonacci moved up yet?

A new high only counts once `PivotBars` bars on its right have closed lower (5 with the default). Until then the old leg stays. Once the high is confirmed, the grid is redrawn on the new leg automatically.

Does it work in the MT5 phone app?

It runs in MT5 on your computer. To follow it from your phone, turn on `EnableAlertPush`, and the touch and rejection alerts will reach the MT5 app.

Do the 127.2% and 161.8% extensions give arrows or alerts?

They never give arrows, because rejection arrows only appear at 38.2%–78.6%. They count for touch tracking and touch alerts only when `AlertOnExtensions` is on.

Can I get alerts for arrows only, without the level touches?

There is no separate switch. The popup fires on both first touches and rejection signals, so check the chart for an arrow before you act on a popup.

Changelog

  • 1.00Initial release: automatic Fibonacci retracement grid between the last two alternating, fractal-confirmed swing points, shaded Golden Zone (61.8%-78.6%), optional 127.2%/161.8% extension lines, one-time-per-leg level. · 2026-10-05

Final verdict

Where it earns its place

  • No repainting. The arrows held up in the repaint test, and each one is drawn on the bar that closed. A signal you see in history is a signal you could have acted on.
  • The grid maintains itself. It follows each new swing, shades the Golden Zone, and checks a higher timeframe for you. That is the part most traders do badly by hand.
  • You find out fast. Reactions resolve within a few bars, so you learn quickly whether a level is holding.

Where it falls short

  • No edge on its own. The arrow's direction was a coin flip in the Lab. It is a location and timing tool, not a buy/sell system.
  • Too many signals. Arrows come often, so without a filter you will overtrade.
  • Lag. A swing only counts after PivotBars bars, so the grid always reacts a little after the turn.
  • One leg only. It draws the latest leg and nothing else. If you prefer to pick your own swing, you will disagree with it at times.
  • Narrow test. The Lab measured one symbol on one timeframe. Every other market and timeframe is untested.

Skip it if

  • You want arrows to trade without a trend view of your own.
  • You trade from a phone only.
  • You need several Fibonacci grids from different swings on the chart at once.

Settings to start with

  • Any timeframe: keep the defaults on M15. They are the settings the Lab tested.
  • M5: try PivotBars 8 so the grid ignores minor wiggles. This is not tested by the Lab, so compare it with the default.
  • Fewer, stronger confluence matches: try ConfluenceToleranceATR 0.15. Also untested; compare it with 0.25.
  • Away from the screen: turn on EnableAlertPush.

Pairing ideas

For a second opinion on the level, try Key Level Map: an arrow at a Fibonacci level that sits inside one of its scored support/resistance zones has two reasons behind it. For trend direction, Dynamic Support Line can show whether a bullish arrow forms above a rising support line. Both are ideas to try; the Lab has not tested either pair.

More support, resistance & levels tools