









Fibonacci extension
Also called Fib extension, Fibonacci projection, Fibonacci expansion, Trend-based Fibonacci extension
A Fibonacci extension estimates how far a trend may run after a pullback. You take a fixed share of the previous swing (61.8%, 100% or 161.8%) and add it to the pullback point. Traders mostly use these levels as profit targets.
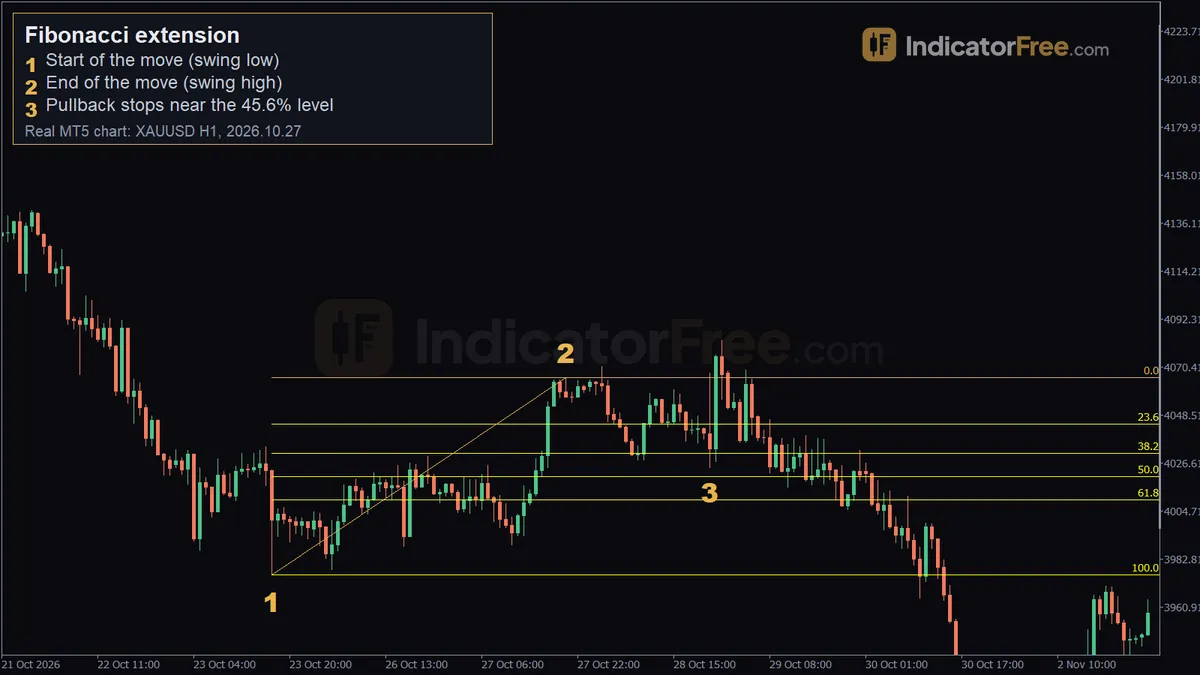
An extension gives you a target before the trade opens, so you don't pick your exit out of greed or fear in the moment. It also tells you when a trade isn't worth taking: if the nearest sensible extension is closer to your entry than your stop loss is, the trade does not pay for its risk.
How to draw a Fibonacci extension: the identification checklist
- Find a clear impulse leg: a strong, one-direction move with few overlapping candles. Mark where it starts. This is point A.
- Mark where the leg ends, at the swing high in an uptrend or the swing low in a downtrend. This is point B.
- Wait for a pullback that holds somewhere between about 38.2% and 78.6% of the A-to-B move. The point where it turns back is point C.
- Measure the distance from A to B. Add 61.8%, 100% and 161.8% of that distance to C in an uptrend, or subtract them in a downtrend.
- Check whether each level lines up with something else, such as a prior high, a supply or demand zone or a round number. A level that stands alone is weaker.
The ratios come from the Fibonacci number sequence. Divide any number in it by the next one and you get about 61.8%. A Fibonacci retracement is the sister tool. It measures how far price comes back inside the move, so traders use it to find entries. The extension measures how far price may travel beyond the move, so traders use it for targets.
Working out the extension levels by hand
You don't need a drawing tool. All you need is the size of the A-to-B move in pips. Each level is that size multiplied by a ratio, measured up from C. The calculation below uses the prices from the EURUSD chart at the top of this page.
To place each level on your chart, add its distance to the price at C.
A common misread is to stretch a retracement tool past 100% and read its 161.8% line as the extension. That line is measured from A, not from C, so it sits 84 pips above A instead of 84 pips above C. On this chart the gap between the two equals the A-to-C distance, about 25 pips. A simple test: if the tool asked for only two clicks, you are looking at a retracement level, not an extension.
The EURUSD 1-hour example, marker by marker
The chart at the top of the page is a past example, not a forecast.
- Marker 1, swing low (point A). The move started at 1.15826 on 3 September 2026 at 00:00.
- Marker 2, swing high (point B). Price climbed to 1.16346 on 8 September 2026 at 05:00. That is a 52-pip leg.
- Marker 3, pullback low (point C). Price fell back to 1.16080 at 14:00 the same day. That gave back 51.2% of the leg, which is well inside the valid 38.2% to 78.6% range.
From C, price rose 41 pips. It passed the 61.8% extension, about 32 pips above C, and the old swing high, then stalled before the 100% extension, 52 pips above C. The levels chart below shows where that stall happened compared with each level.
The lesson: the first extension was reached, but the second was not. Planning your exit in two parts would have locked in part of the gain.
What makes an extension valid, weak or broken
An extension is valid when A and B are obvious swing points that any trader would mark. The leg between them should be clean, and the pullback should turn somewhere between 38.2% and 78.6%.
It is weak in these cases:
- the leg is choppy;
- the pullback is very shallow (under about 23.6%) or very deep (over 78.6%);
- you had to try several anchor points before the levels "fit";
- the levels land in empty space with nothing else on the chart nearby.
It is broken when price moves past point A. In an uptrend, a break below A means the structure you measured no longer exists. Delete the drawing. Don't drag it to new points so you can keep the trade.
Trading setups built on Fibonacci extensions
Setup 1: buy the pullback, take profit at the 61.8% and 100% extensions
This setup uses the EURUSD chart above, as a past example.
- Entry: buy as the pullback stalls near C, at about 1.16080. In real trading you would wait for a bullish candle to confirm the turn, so your fill would usually be a little higher.
- Stop loss: a couple of pips below point A at 1.15826, about 28 pips of risk. If price gets there, the setup is broken.
- Target 1: the 61.8% extension, about 32 pips above entry. Close half the position here.
- Target 2: the 100% extension, 52 pips above entry. That is about 1.9 times the risk.
In this case Target 1 filled and Target 2 did not. You would then exit the second half using a trailing stop or a stop at breakeven.
A decision rule worth copying: if the 100% extension is less than 1.5 times your stop distance, skip the trade.
Setup 2: sell at the 161.8% extension only where it meets a supply zone
At the 161.8% level, a move is often stretched, but stretched does not mean finished. Take a counter-trend sell there only if the level sits inside a supply zone or under a clear prior high, and only after a rejection candle closes. Put your stop beyond the far edge of the zone. Aim for the 100% extension first, then C. If there is no confluence, treat 161.8% as a place to take profit on your long, not a place to go short.
When extensions work well and when to avoid them
Extensions behave best in trending markets with clean, rhythmic swings, and on the 1-hour chart and higher, where swing points are clearer. Avoid them in sideways ranges, in the minutes around major news (when price can jump straight through any level) and when the higher-timeframe trend points the other way.
Does Fibonacci work in trading? The ratios don't predict anything. The levels matter partly because many traders watch the same prices, and they matter most where they line up with existing support or resistance. Treat each level as a place to make a decision, not a promise.
| Pros | Cons |
|---|---|
| Sets objective targets before entry | Different anchor points give different levels |
| Easy to calculate by hand | Price often turns between levels, not at them |
| Lets you check risk-to-reward in advance | Weak in ranges and around news |
| Works on any market and timeframe | Easy to redraw until it "fits" (hindsight) |
Bullish and bearish Fibonacci extensions
In a bullish extension, you measure from a swing low (A) to a swing high (B), then project the levels upward from the higher low (C) to target the next leg up.
In a bearish extension, you measure from a swing high to a swing low, then project the levels downward from the lower high to target the next leg down. Fibonacci retracement, which finds the entry, is its own entry in the glossary.
Practical tips for extension targets
- Anchor on wicks or on closes, then stick with that choice so your levels stay comparable.
- Use 61.8% as your first scale-out and 100% as your main target. Save 161.8% for strong trends.
- Move your stop to breakeven once Target 1 fills.
- If two separate swings project to nearly the same price, that cluster is a stronger target than either level alone.
- Set your take-profit a few pips short of the level, because price often turns just before it.
Quick checklist before you use an extension target
- Are A and B clear swing points, and did C turn between 38.2% and 78.6%?
- Is price still on the right side of A?
- Does the target line up with a zone, a prior high or low, or a round number?
- Is the 100% extension at least 1.5 times your stop distance?
FAQ
Why does the extension tool need three clicks when the retracement needs two?
The extension needs C, the pullback point, as the base for its projection. A retracement only measures between A and B.
Can I use Fibonacci extensions on the 5-minute chart?
You can, but small swings are noisy and the spread takes up a bigger share of each target. Check the levels against the 1-hour chart before you rely on them.
What should I do when price blows straight through the 161.8% extension?
Don't sell into it. A move that strong suggests a new trend leg. Wait for a fresh A-B-C structure and draw a new extension from it.