Fibonacci Extension
Free MT5 indicator that finds A-B-C swings and projects 61.8%-261.8% Fibonacci extension targets with a Golden Zone. Lab-run on MT5 build 6230.
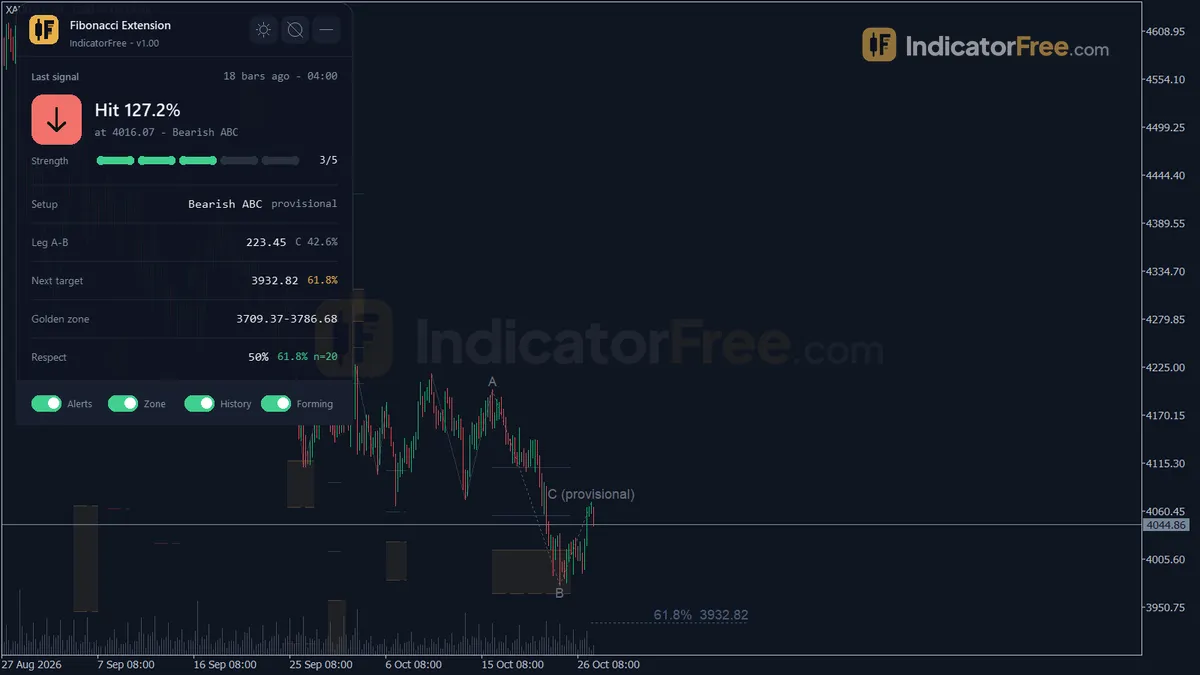
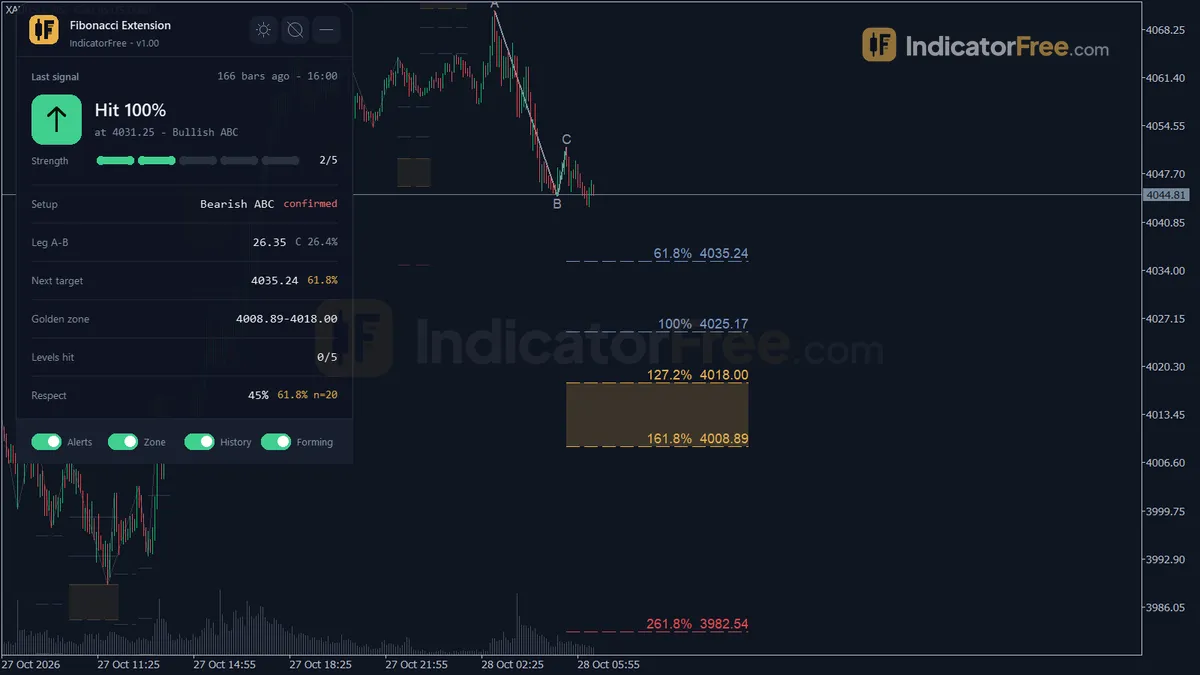
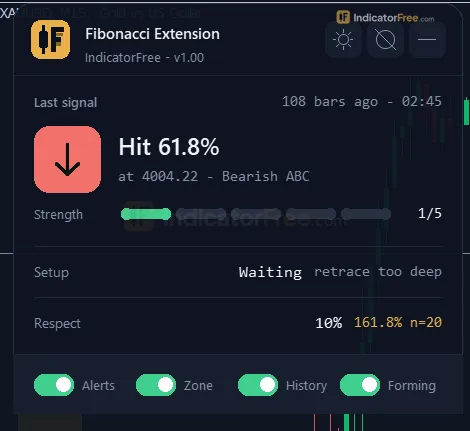
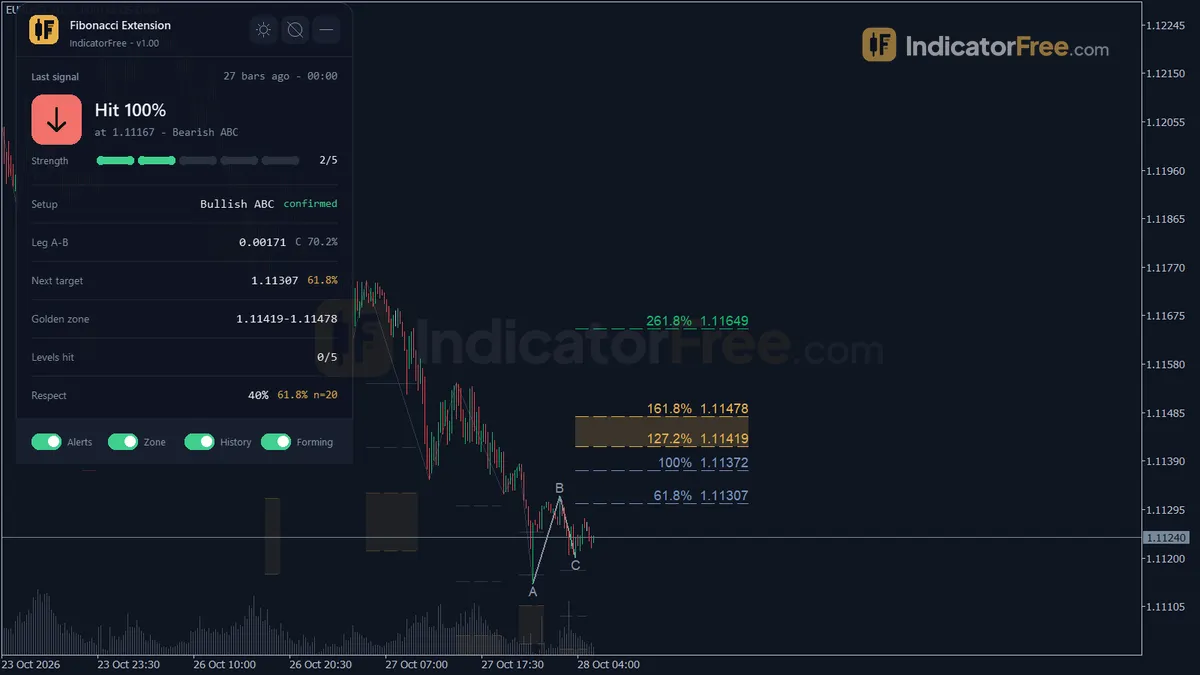
- Repainted
- Not tested
- Signals / week
- —
- Tested on
- —
- Tested
- 2026-10-09
Overview
Fibonacci Extension is a free MT5 indicator for swing and intraday traders who need price targets: it finds the latest A-B-C swing on your main price chart and projects extension levels from point C at 61.8%, 100%, 127.2%, 161.8% and 261.8% of the A-B leg. It also shades the 127.2%-161.8% Golden Zone. The Lab ran version 1.00 (157.6 KB) on MT5 build 6230 on 2026-10-09.
It suits traders who already have a reason to enter and want targets they can check, without redrawing the Fibonacci tool by hand on every swing.
What it draws on your chart
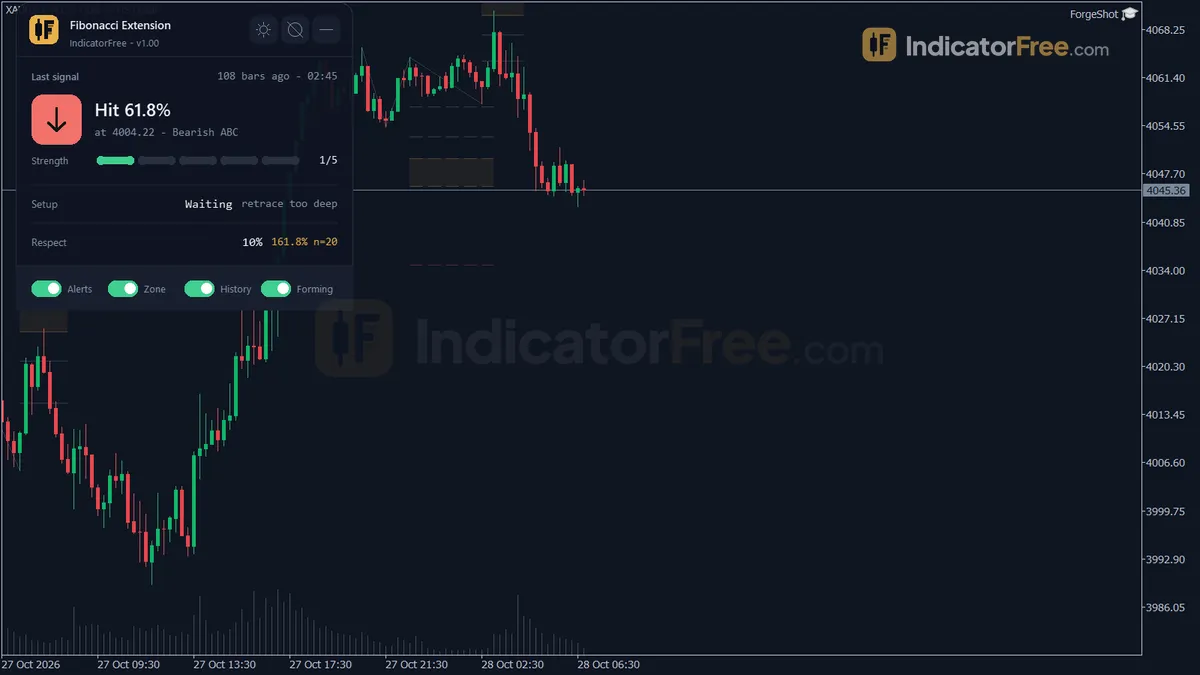
A Fibonacci extension takes the size of one swing and projects it from the end of the pullback that follows. This gives a rough idea of how far the next move may stretch. The indicator draws everything in the main chart window, not a subwindow:
- ABC Swings: the A-B and B-C legs of the set it is using.
- Extension Levels: horizontal lines from C at each percentage in
ShowLevels. They extend right until a newer confirmed pivot replaces the set, or until a closed bar closes back beyond C. - Golden Zone: a shaded box from 127.2% to 161.8%. It ends with its set and is deleted with it.
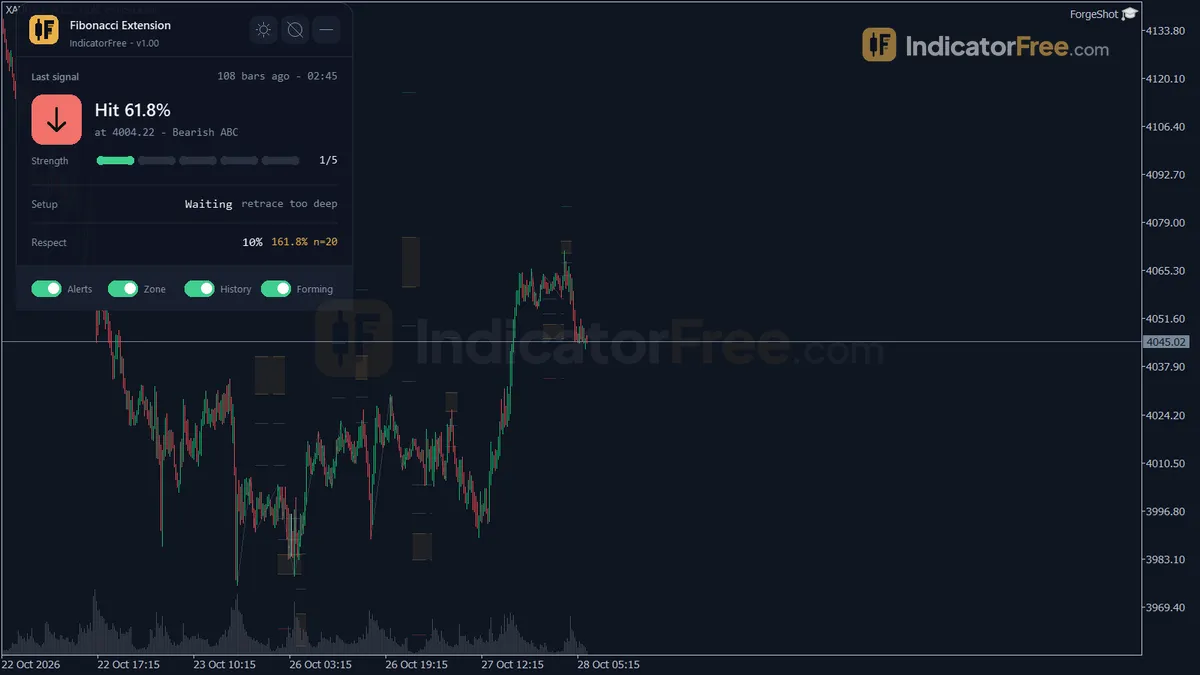
- Status panel: a summary of the current set. It is described in the How it works tab.
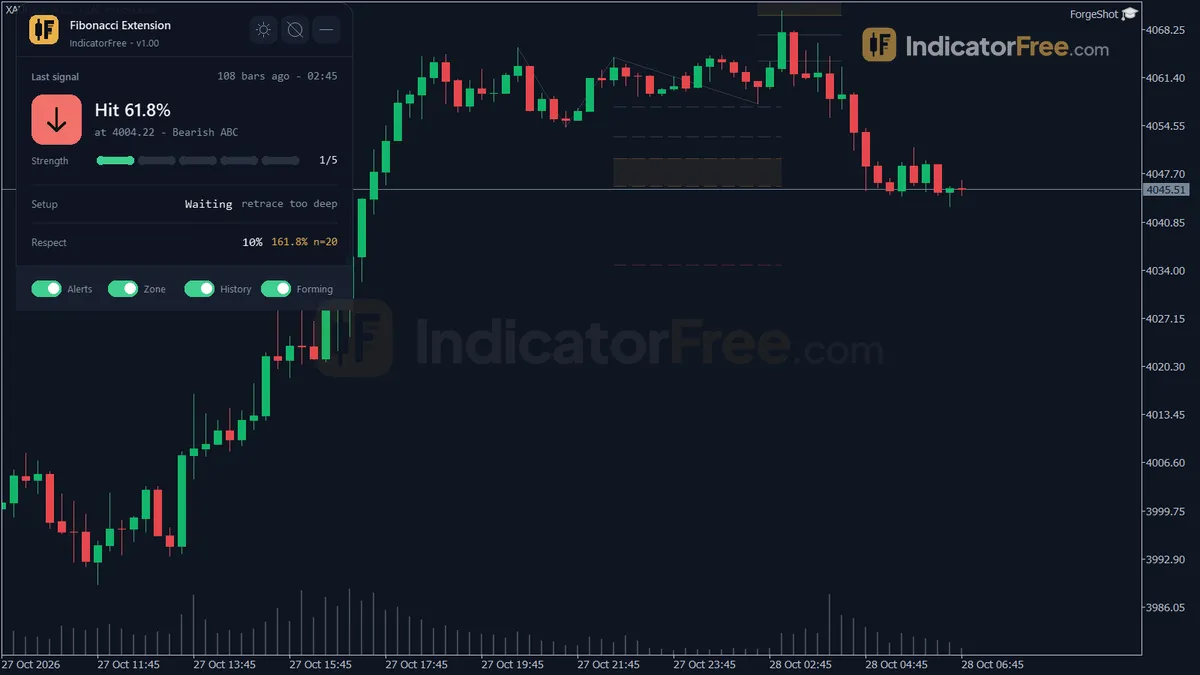
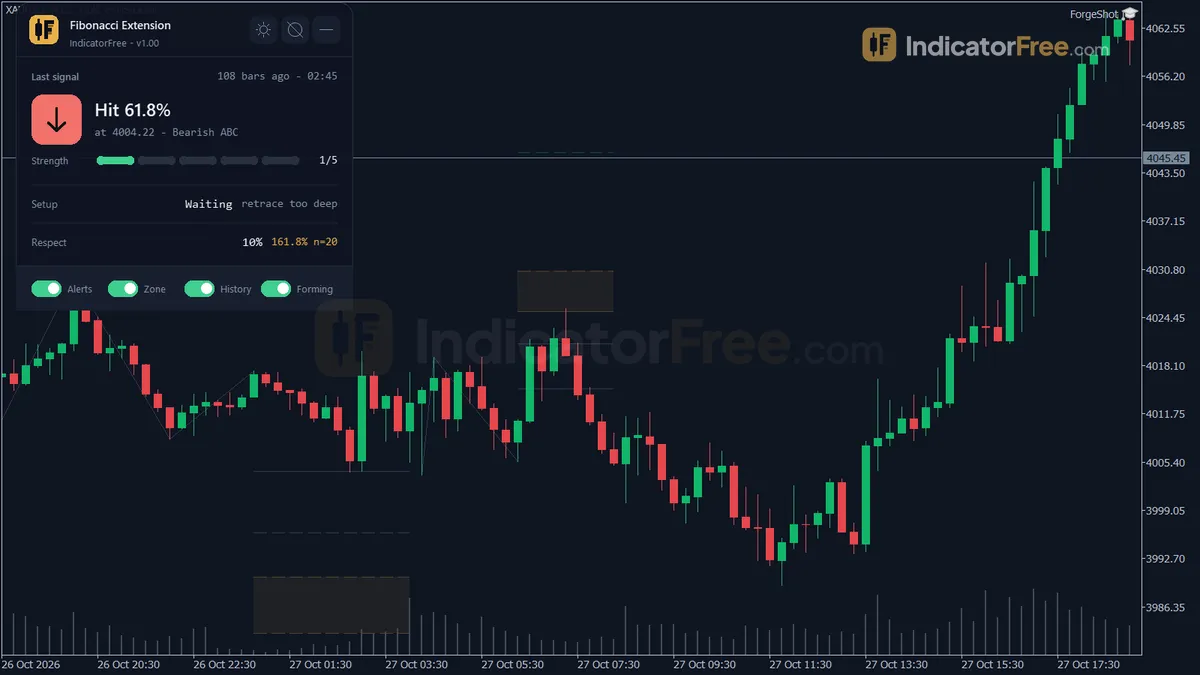
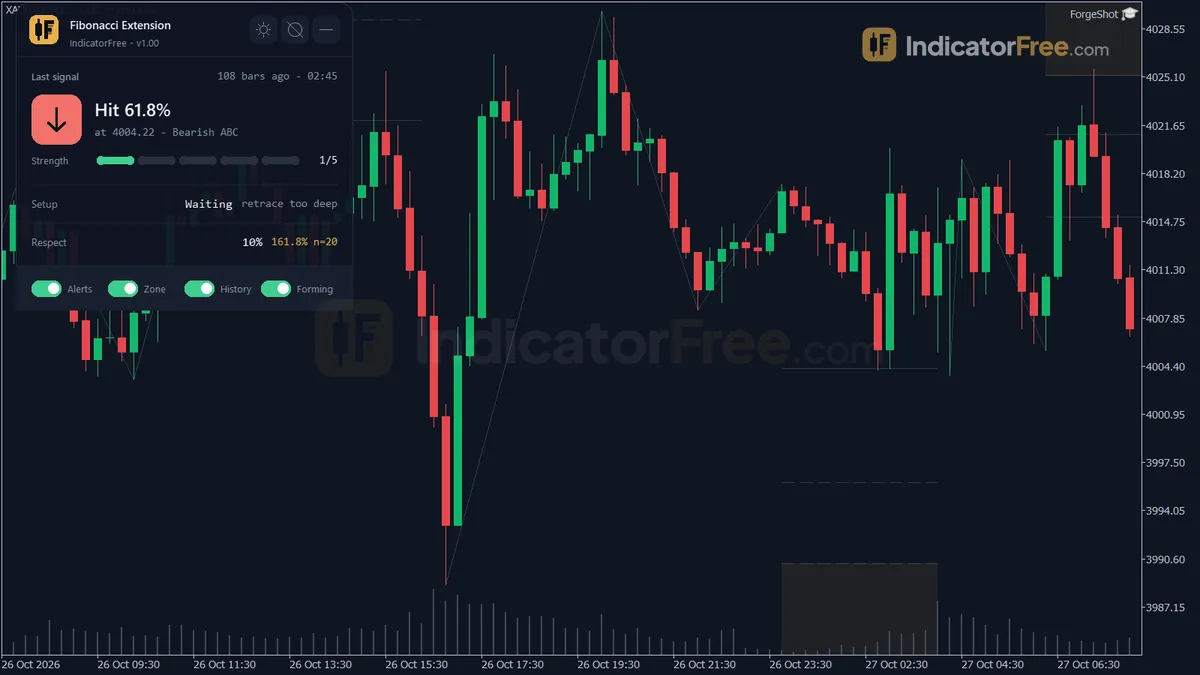
Older sets stay on the chart, faded, up to MaxHistorySets (default 10). That lets you scroll back and see how price reacted to earlier projections. The figure below shows a bullish set: A is the swing low, B the swing high, C the higher low, and the levels sit above B.
What the Lab checked, and what it did not
The Lab installed version 1.00 on MT5 build 6230, attached it on EURUSD H4 and M5, and scrolled back through several weeks of history (screenshots below). That shows the file loads and runs on a current terminal. The Lab facts contain no measured hit rate and no repaint count for this tool, so this page gives no win rate or accuracy figure.
To see how often levels are reached on your own symbol and timeframe, use the indicator's Respect row. The tool calculates it live from finished sets on your chart. The Lab did not produce it.
How it works
- 1Finds swing highs and lows by the set bars each side, keeping the last three pivots as A, B, C.Inputs: SwingBars
- 2Accepts an ABC set only if leg AB is long enough and BC retraces within the allowed percent range.
Retrace % = abs(B - C) / abs(B - A) x 100, between MinRetracePct and MaxRetracePctInputs: MinLegPoints, MinRetracePct, MaxRetracePct - 3Projects levels from point C along the AB direction using the listed percentages. A golden zone spans 127.2% to 161.8%.
Level = C + direction x abs(B - A) x ratioInputs: ShowLevels, ShowGoldenZone - 4A level counts as hit when a later bar reaches it. The set ends on a close back past C.Inputs: ShowProvisional, MaxHistorySets
- 5Keeps hit records of past sets to show how often each level was reached, and alerts on a new hit.Inputs: ShowRespectStats, StatsLookbackSets, EnableAlert
Specifications
- Platform
- MetaTrader 5
- Version
- 1.00
- Type
- Indicator
- Window
- Main chart
- Draws
- 3 zones, 1 panel
- Alerts
- popup, push, sound
- Repaints
- not tested
- Inputs
- 17
- Tested on
- MT5 build 6230 · 2026-10-09
Repaint test
Repaint: not tested. This indicator draws zone, panel, which the IndicatorFree harness cannot read through iCustom().
IndicatorFree — tested 2026-10-09 · MT5 build 6230. Results come from historical data, not live trading, and do not guarantee future results.
What it draws
- Rectangles (Extension Levels) drawn as chart objects, not buffers — they are not readable by iCustom() in an EA.
- Rectangles (Golden Zone) drawn as chart objects, not buffers — they are not readable by iCustom() in an EA.
- Rectangles (ABC Swings) drawn as chart objects, not buffers — they are not readable by iCustom() in an EA.
- An on-chart panel (Status); values shown in the panel are not exposed as buffers.
Inputs
| Input | Default | What it does |
|---|---|---|
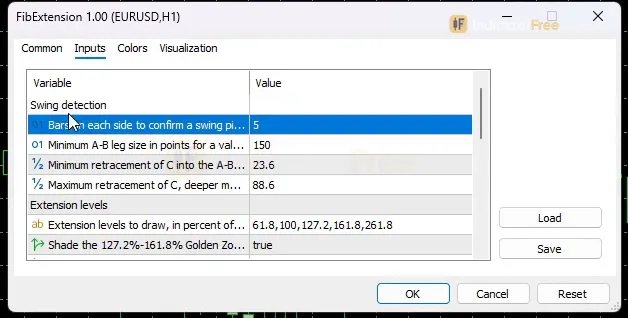
| SwingBars | 5 | Bars on each side to confirm a swing pivot (2-15), also the confirmation lag in bars |
| MinLegPoints | 150 | Minimum A-B leg size in points for a valid ABC (20-2000) |
| MinRetracePct | 23.6 | Minimum retracement of C into the A-B leg, in percent (10-50) |
| MaxRetracePct | 88.6 | Maximum retracement of C, deeper means the trend reversed and nothing is projected (60-95) |
| ShowLevels | 61.8,100,127.2,161.8,261.8 | Extension levels to draw, in percent of the A-B leg, comma separated (up to 8) |
| ShowGoldenZone | true | Shade the 127.2%-161.8% Golden Zone of each set |
| ShowProvisional | true | Show the forming ABC (C not confirmed yet) as dotted lines, it may still change |
| MaxHistorySets | 10 | Superseded ABC sets kept faded on the chart (1-50) |
| ShowRespectStats | true | Show the Respect row: % of recent finished ABC sets that reached the next target level |
| StatsLookbackSets | 20 | Finished ABC sets used for the Respect statistic (5-100) |
| PanelScale | 1 | Panel size multiplier (DPI is applied automatically) |
| EnableAlert | true | Alert once per level when a closed bar first reaches it (initial state of the panel Alerts toggle) |
| AlertPopup | true | Show a popup alert |
| AlertPush | false | Send a push notification |
| AlertSound | false | Play a sound |
| Theme | Dark | Chart color theme |
| RestoreTheme | true | Restore the original chart colors when the indicator is removed |
How to read it
Installing it
File > Open Data Folder > MQL5/Indicators, paste the .ex5 file, restart or refresh the Navigator, then drag Fibonacci Extension onto a chart. When you attach it, Theme (default Dark) changes the chart colors.
How one ABC set forms
The indicator follows the same five steps on every new swing. Each check uses the input named in the step:
- 11. Confirm pivotsA swing high or low needs SwingBars bars (default 5) on each side. The last three pivots become A, B, C
- 22. Check the A-B legA-B must be at least MinLegPoints (default 150 points), or the set is ignored
- 33. Check the C retracementRetrace % = abs(B - C) / abs(B - A) x 100, between MinRetracePct 23.6 and MaxRetracePct 88.6
- 44. Project levelsLevel = C + direction x abs(B - A) x ratio, for every ratio in ShowLevels; shade 127.2%-161.8%
- 55. Track hitsA level is hit when a later bar reaches it; the set ends on a close past C
If C retraces deeper than MaxRetracePct, the indicator treats the move as a reversal and projects nothing. An empty chart after a deep pullback is expected behaviour, not a bug.
Reading the lines and the zone
- Dotted lines = provisional set. C is not confirmed yet and the set can still move or disappear. This is the most common misread. A dotted 161.8% line is a draft, not a target. Wait for solid lines, which appear
SwingBarsbars after the C pivot. - Solid lines = confirmed set. These levels stay fixed until the set ends.
- Faded lines = superseded sets. Use them to study history, not as live targets.
- Golden Zone: the shaded 127.2%-161.8% band; the panel prints its two prices. Treat it as an area to consider taking profit, not an exact price.
Reading the Status panel
The panel shows the last level hit, the ABC direction and state, the A-B leg size and C's retracement, the next target level, the Golden Zone prices, the levels hit so far, and the Respect percentage for the next target. Respect is the share of the last StatsLookbackSets finished sets (default 20) that reached that level. PanelScale changes the panel's size; DPI is applied automatically.
Inputs to change first
SwingBars(2-15, default 5): the most important setting. Lower values find more, smaller swings with less lag. Higher values find fewer, larger swings and confirm C later.MinLegPoints(20-2000, default 150): measured in points, not pips. On a 5-digit forex pair, 150 points is 15 pips. On gold or indices, the same number is a much smaller move, so raise it there.MinRetracePct/MaxRetracePct: narrow this range if you only want classic pullbacks. For example, try 38.2 to 78.6. This is an untested starting point, not tested by the Lab, so compare it with the default.ShowLevels: up to 8 comma-separated percentages. Remove 261.8 if the chart looks crowded, or add 200 if you trade runner targets.StatsLookbackSets(5-100): higher values make the Respect number steadier but slower to reflect a change in market behaviour.
Alerts
With EnableAlert on, you get one alert per level, the first time a closed bar reaches it. You can also switch alerts on and off from the panel's Alerts toggle. AlertPopup is on by default. AlertPush (to the MT5 mobile app) and AlertSound are off until you enable them.
A decision rule
Use an extension level as a profit target only when all three are true:
- The set is solid, not dotted.
- The trade is in the set's direction.
- The panel's Respect for that next target is above a threshold you choose, for example 50%.
If a bar closes back beyond C, treat the trade idea as finished. The indicator ends the set at that point too.
Installation
- 1Download FibExtension.ex5 from the button above (Google Drive).
- 2In MetaTrader 5: File → Open Data Folder → MQL5 → Indicators. Copy FibExtension.ex5 there.
- 3Restart MT5 or right-click Indicators in Navigator → Refresh.
- 4Drag Fibonacci Extension onto a chart. For push alerts, enable "Allow push notifications" under Tools → Options → Notifications.
- Tested on MT5 build 6230.
Key terms and guides
- Golden ratio
- The golden ratio in trading is the 61.8% Fibonacci level (161.8% for targets). Traders measure a finished price move and watch the point where a pullback has given back 61.8% of it as a likely place for the trend to resume.
- Swing High/Low
- A swing high is a candle whose high sits above the highs of the candles on both sides of it. A swing low is a candle whose low sits below the lows on both sides. Together they mark the turning points of price.
- Pullback
- A pullback is a short, temporary move against the main trend: price dips during an uptrend or rallies during a downtrend, then turns back the trend's way. Traders use it to enter a trend at a better price.
- Fibonacci extension
- A Fibonacci extension estimates how far a trend may run after a pullback. You take a fixed share of the previous swing (61.8%, 100% or 161.8%) and add it to the pullback point. Traders mostly use these levels as profit targets.
- Win rate
- Win rate is the share of your closed trades that ended in profit: winning trades divided by total trades, times 100. On its own it does not show whether a strategy makes money, because it ignores how big the wins and losses are.
- Symbol
- A symbol is the short code a trading platform uses to name one tradable market, such as EURUSD for the euro against the US dollar or XAUUSD for gold. Every quote, chart and order is tied to exactly one symbol.
More on this subject: Supply, demand & key levels guide, terms and tools
User reviews
No reviews yet. Members who download the tool can review it here.
Sign in and download the tool to review it.
Build a checklist with it
Fibonacci Extension does one job on the chart: zone / level. Put it on the same chart as the tools below and the IndicatorFree panels merge into one checklist card, ordered trend, zone, signal, risk.
- Trend / contextKijun Sen LineAdds the trend side: which way the market leans before you act on Fibonacci Extension.
- Entry signalEngulfing Pattern FinderAdds the entry signal: the moment to act once Fibonacci Extension has set the scene.
The Lab has not tested these combinations. Each tool is tested on its own; the card only lines up what each one says. Free members get 2 new tools a day. If one has to wait until tomorrow, install BlackBox to raise the limit to 5 a day (20 on a live account).
FAQ
Does Fibonacci Extension repaint?
Repaint: not tested. This indicator draws zone, panel, which the IndicatorFree harness cannot read through iCustom().
Why can’t my EA read the zones?
Zones and the panel are chart objects, not indicator buffers, so iCustom() does not return them.
How do I get alerts on my phone?
Enter your MetaQuotes ID under Tools → Options → Notifications, tick "Enable push notifications", and keep the push alert input on.
How is this different from drawing Fibonacci from a swing low to a swing high by hand?
A two-point drawing measures a retracement inside one swing. This indicator uses three points: it measures the A-B leg and projects it from C, the end of the pullback. That places the targets beyond B instead of inside the leg.
Where should I enter and place my stop?
The indicator gives neither. Your entry has to come from your own method. Point C is a sensible reference for a stop, because the set ends on a close past C.
Which timeframe should I use it on?
The Lab facts include no timeframe comparison. It runs on any chart. Lower timeframes give more and smaller sets, so set `SwingBars` and `MinLegPoints` to suit the size of swings you trade, then check the Respect row.
Does it work on gold, indices or crypto?
It runs on any symbol, but the Lab screenshots only show EURUSD. `MinLegPoints` is counted in points, so raise it on high-priced symbols. The default 150 is a tiny move there and gives many small, unreliable sets.
Will it leave my chart colors changed after I remove it?
With `RestoreTheme` on (the default), the indicator puts your original chart colors back when you remove it. Turn it off only if you want to keep the `Theme` colors.
Changelog
- 1.00Initial release: automatic A-B-C swing detection (fractal N-bar), Fibonacci extension level projection (61.8/100/127.2/161.8/261.8% by default), provisional vs confirmed labeling, shaded Golden Zone (127.2%-161.8%),. · 2026-10-09
Final verdict
Where it earns a place
The indicator does the slow part of Fibonacci extension work for you. It picks A, B and C by fixed rules, rejects legs that are too small and pullbacks that are too deep, and starts a new set when a newer confirmed pivot replaces the old one. The old set stays on the chart, faded. The difference between dotted and solid lines shows how certain the set is. The Respect row gives you a live number from your own chart instead of a general claim about Fibonacci ratios. Alerts fire once per level on a closed bar, so you are not flooded with repeat messages while price sits on a line.
Limits you should know
- It gives targets, not entries or stops. It never says when to buy or sell.
- Confirmation lag: a set only becomes final
SwingBarsbars after C. On fast moves, price may already be close to the 61.8% or 100% level by then. - Respect uses a small sample. With the default 20 sets, one or two outcomes change the percentage noticeably.
MinLegPointsis a fixed point value. It does not adjust to volatility, so one setting will not suit every symbol and timeframe.- Choppy, sideways markets produce many small, short-lived sets.
Use it or skip it
- –You already have an entry method and need targets
- –The market makes clear swings with pullbacks
- –You want alerts as price reaches each level
- –You check the Respect row before trusting a target
- –You want a buy or sell arrow
- –You trade tight ranges or very slow sessions
- –You need targets before a swing is confirmed
- –You expect one MinLegPoints value to fit every symbol
Settings to start with
Run the defaults first on the symbol and timeframe you trade. Keep them until the Respect row is based on a full 20 finished sets, so you have a baseline.
After that, try these untested starting points (not tested by the Lab, so compare each with the default):
- M5:
SwingBars3 andMinLegPoints300 to filter out micro-swings. - H4 on forex:
SwingBars7 andMinLegPoints500.
Change one input at a time. Otherwise you cannot tell which change moved the Respect number.
A tool to try alongside it
You could pair it with Key Level Map, a support and resistance tool, and favour extension levels that land on one of its zones. This is an idea to try: the Lab has not tested the pair.