









Golden ratio
Also called Golden mean, Phi, Golden zone, Golden pocket, 61.8% level, Fibonacci golden ratio
The golden ratio in trading is the 61.8% Fibonacci level (161.8% for targets). Traders measure a finished price move and watch the point where a pullback has given back 61.8% of it as a likely place for the trend to resume.
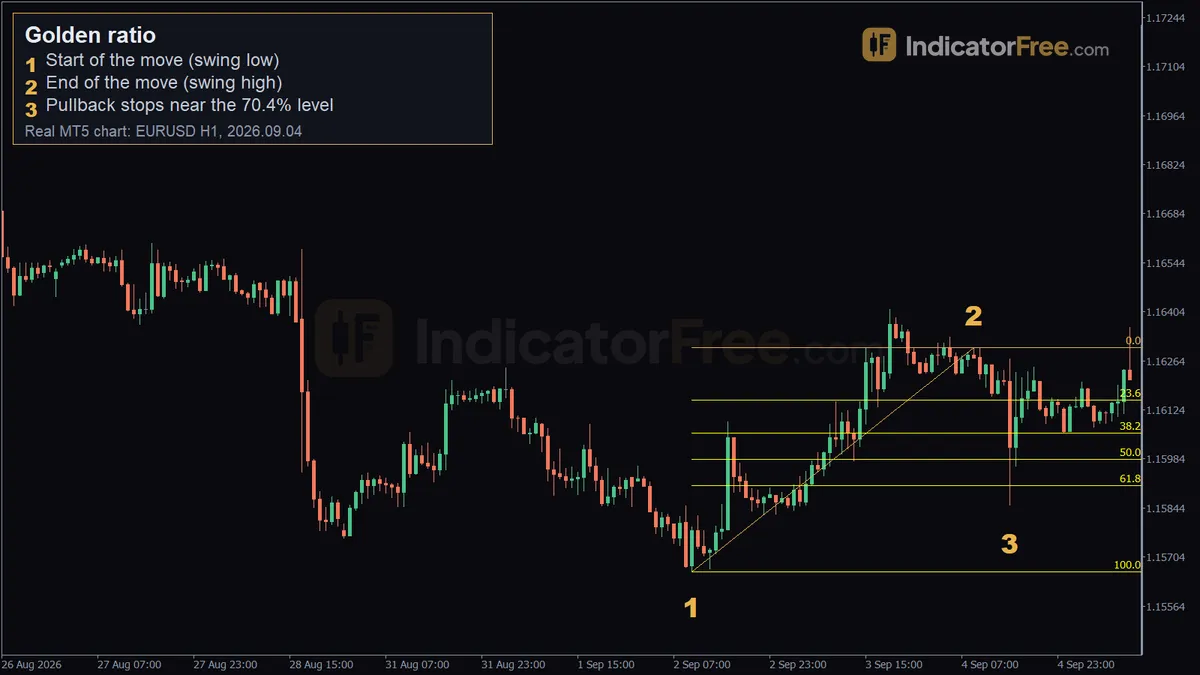
The 61.8% level sets two things for you: the price where you plan to join a trend, and how far away your stop must sit. Treat it as an exact line and you will be stopped out by pullbacks that run a few pips deeper before turning.
Where the 61.8% number comes from
In the Fibonacci sequence (1, 1, 2, 3, 5, 8, 13, 21...), each number settles near 61.8% of the next one. Compared with the one before it, it settles near 161.8%. Traders call both the golden ratio, also known as the golden mean or phi.
The two numbers do different jobs. The 61.8% level measures how deep a pullback goes. The 161.8% level projects a target beyond the old high or low, which is covered in the Fibonacci extension entry.
The narrow band from 61.8% to 65% is often called the golden zone or golden pocket. No market law makes price turn there. It matters because many traders watch the same level and place orders around it.
The drawing below shows where the level sits on a pullback in an uptrend.
How to find the golden ratio level on your chart
- Pick a clear, finished move: a swing low and a swing high that stand out on your timeframe.
- For an up move, anchor the Fibonacci retracement tool at the swing low and drag it to the swing high. For a down move, go from the high to the low.
- Use the wick extremes at both ends, not the candle bodies.
- Mark the 61.8% level and shade the band down to 65%.
- Mark the 78.6% level. This is your line for a failed pullback.
- Wait for price to come to the zone. Do not chase it.
You can check the level by hand. The figures here are an illustrative example with round numbers: an up move of 100 pips from swing low to swing high.
On your chart, subtract that pip amount from the swing high price. For a down move, add the 61.8% amount to the swing low instead.
A valid golden ratio pullback vs a weak one
A valid one starts with a strong move: large candles in one direction with little overlap. The pullback is slower, with smaller candles than the move itself.
It is stronger when the level lines up with something else on the chart, such as an old support level or a round number. Traders call that confluence. The last piece is a reaction: a wick into the zone and a close back outside it.
A weak one comes from a choppy range where no swing stands out. It is also weak when the pullback candles are as large as the candles of the original move. That is no longer a pause. It may be a reversal.
The level is broken when a candle closes beyond 78.6%. Decision rule: if that happens, drop the trade idea and wait for a new swing.
A common misread is measuring a move that has not finished. Each new high shifts the 61.8% level, so your entry keeps moving. Measure only after price has clearly turned away from the high.
EURUSD 1-hour example: a pullback that ran past 61.8%
The chart at the top of the page is a past example, not a prediction.
Marker 1 is the swing low at 1.15662 on 2 September 2026 at 10:00. This is where the measured move starts.
Marker 2 is the swing high at 1.16301 on 4 September 2026 at 09:00. The move between the two markers is 64 pips.
Marker 3 is where the pullback stopped: 1.15851 on 4 September 2026 at 15:00. That is 70.4% of the move, about 45 pips given back in six hours.
Price did not turn at 61.8%. It went through the golden zone and stopped between 61.8% and 78.6%, then rose 51 pips. A stop placed just under the 61.8% line would have been hit before that rise. This is why the stop belongs beyond 78.6%. A stop under the 78.6% level, as in setup 1 below, would have survived the dip to 70.4%.
Two ways to trade the 61.8% level
Both setups use the illustrative 100-pip up move again. They are examples of the method, not results.
Setup 1: limit order at the level
- Entry: buy limit at the 61.8% level, which is 38.2 pips above the swing low.
- Stop loss: 20 pips below entry. That puts it under the 78.6% level, which sits 21.4 pips above the swing low.
- Target: the old swing high, which is 61.8 pips above entry.
Reward divided by risk is 61.8 ÷ 20 = 3.09. The ladder below shows the order of the levels.
Size the trade from the stop. With a $5,000 account and 1% risk, you can lose $50. Then $50 ÷ 20 pips = $2.50 per pip. A standard lot pays $10 per pip on a USD-quoted pair, so that is 0.25 lots.
Setup 2: wait for a close back above the level
- Entry: a 1-hour candle dips into the zone and closes back above 61.8%. You buy at its close, say 45 pips above the swing low.
- Stop loss: 25 pips below entry. That is 20 pips above the swing low, under the 78.6% level.
- Target: the old swing high, which is 55 pips above entry. Reward divided by risk is 55 ÷ 25 = 2.2.
With the same $50 of risk, $50 ÷ 25 pips = $2.00 per pip, which is 0.20 lots. The wider stop means a smaller lot.
You get a worse price than in setup 1. In return, you skip the pullbacks that never slow down at the level.
When the golden ratio helps and when to leave it alone
It suits a market with a clear trend on a higher timeframe and a clean swing to measure. It fits traders who missed the first move and want a planned entry with a defined stop.
Leave it alone in a sideways range, right before major news, and when the move you measured is very small compared with the spread.
| Pros | Cons |
|---|---|
| Gives an entry price before price arrives | Price often turns before or after the level |
| Stop has a logical place beyond 78.6% | Two traders can pick different swings |
| Stop is small compared with the target | Deep pullbacks sometimes become reversals |
| Works the same on any pair or timeframe | No reason for a turn unless other traders act there |
Bullish and bearish golden ratio setups
Bullish: after an up move, price falls back to 61.8% and the level acts as support. You look for buys.
Bearish: after a down move, price rallies to 61.8% and the level acts as resistance. You look for sells, the stop goes above the 78.6% level and the target is the old swing low.
Tips for trading the 61.8% level
- Measure the same swing the higher timeframe shows. Small swings give small, noisy levels.
- Set the stop first, then the lot size. Never widen the stop after entry.
- If price reaches the old high, move the stop to entry or take part of the profit.
- Keep a record of how deep pullbacks go on your pair before you rely on the level.
Quick checklist before you place the order
- Clear, finished swing measured wick to wick?
- Pullback slower than the move?
- Price inside the 61.8-65% zone?
- Has a candle closed beyond 78.6%? If yes, no trade.
- Stop beyond 78.6% and lot size worked out from it?
FAQ
Can I use the golden ratio on gold (XAUUSD) charts?
Yes. The level is a percentage of a price move, so it is drawn the same way on gold, indices or any currency pair. Gold often has wider swings, so check the stop distance in money before choosing the lot size.
Which timeframe is best for the golden ratio?
No timeframe is best. Swings on the 4-hour and daily charts are watched by more traders and are less affected by spread. On the 1-minute chart the distance between levels can be only a few pips.
What if price turns at 50% and never reaches 61.8%?
Then there is no trade from this method. Cancel the limit order once price makes a new high, because the swing you measured has changed.