









Drop base drop
Also called DBD, Drop-base-drop pattern, Bearish continuation supply zone
Drop base drop (DBD) is a bearish supply pattern: price falls, pauses in a tight range called the base, then falls again. Traders treat the base as a supply zone and look to sell when price returns to it.
The base marks where large sellers were still building their position when price dropped away, so part of their order is left unfilled at that level. If you can tell a clean base from a messy one, you sell at a level with a clear stop. The alternative is chasing a candle that has already fallen.
How to spot a drop base drop: 6-step checklist
- Find the first drop. Look for two or more strong bearish candles with large bodies and small wicks. A slow slide of overlapping candles does not count.
- Find the base. Price pauses in a tight range of a few candles. These candles are small next to the drop before them.
- Mark the zone. Pick one of two methods. Method A (wide): draw from the highest high of the base to its lowest low. Method B (tight): use only the range of the last bullish candle in the base. This gives a tighter stop, but price more often turns before it reaches the zone. The tight zone sits inside the wider base, so price can turn at the base edge without touching your zone. Use Method A when you want fewer missed entries. Use Method B when the base is wide and Method A would put your stop too far away. The EURUSD example below uses Method B.
- Confirm the second drop. Price must leave the base fast, with strong bearish candles, and break a recent swing low.
- Check the zone is fresh. Price has not come back into it since the second drop.
- Check the room below. The next demand zone or key level should be at least twice your stop distance away.
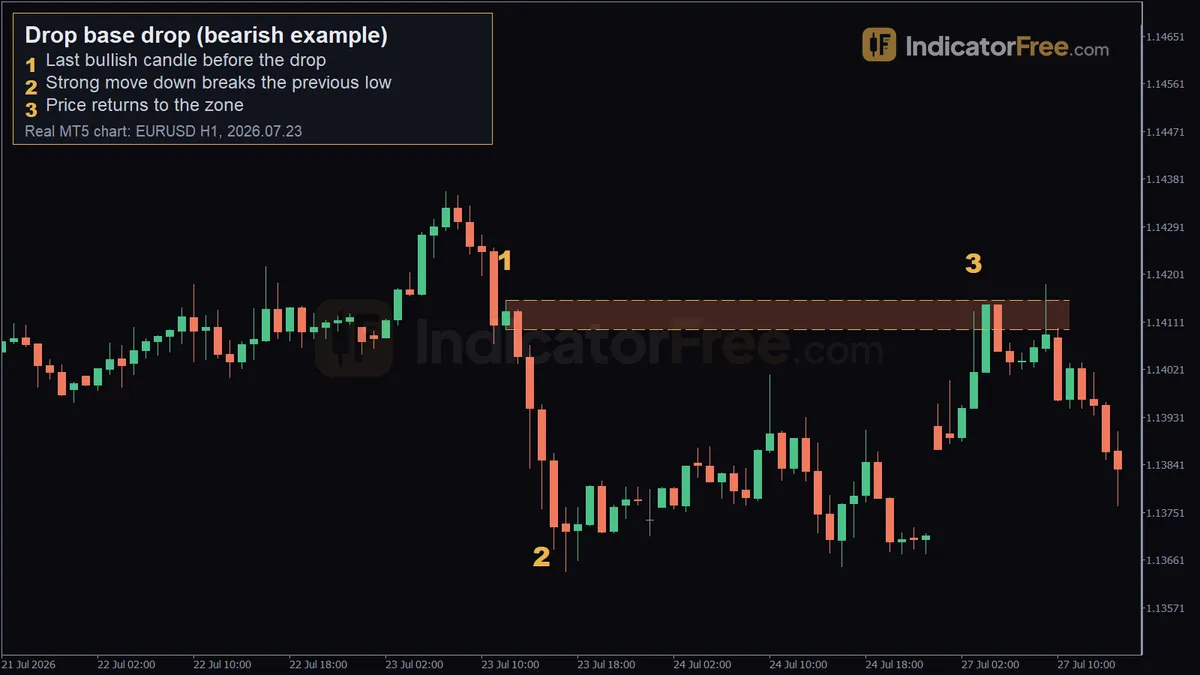
The chart below shows all four parts: the drop in, the base, the drop out and the return.
What makes a DBD zone strong, weak or broken
A strong zone has a short base and a fast exit. The faster price left, the more unfilled sell orders are likely to sit inside. A second drop that breaks a clear swing low adds weight, because it shows sellers controlling the structure, not just one candle.
A zone is weak when the base is long and wide, when the second drop is slow and overlapping, or when price has already come back once. Each return fills some of the waiting orders, so every later touch has less supply left behind it.
A zone is broken once a candle closes above the top of the base. The supply has been absorbed, and the old zone can act as support on later pullbacks.
A common misread is a base with one tall wick spike above it. Draw the zone up to that spike and your stop moves far away, so your reward-to-risk shrinks. If the spike was a single news candle, many traders draw the zone from the candle bodies and put the stop just above the wick.
Reading the EURUSD 1-hour chart above, marker by marker
The candle sketch below the checklist is an illustration of the full pattern. The chart at the top of the page is a real EURUSD 1-hour chart. The EURUSD chart does not show the leg into the base, so treat it as a supply-zone example. Its three markers show the last bullish candle before the drop, the drop out of the zone and the return to it. It is a past example, not a prediction.
- Marker 1, the last bullish candle in the base (2026.07.23 12:00, 1.14152). It is the last bullish candle before the drop, and its range sets the zone at 1.14097 to 1.14152. This is Method B from step 3.
- Marker 2, the drop out of the base (2026.07.23 15:00, 1.13758). Within three candles price fell 30 pips and broke the 10-bar low. That is the fast exit that breaks structure, which the checklist asks for.
- Marker 3, the return (2026.07.27 03:00, 1.1413). Price came back to 1.14130, inside the zone, then moved 19 pips down.
The retest came after a weekend. A fresh zone can wait days for price to come back, so keep it marked until a candle closes above it.
The markers cover the base, the exit and the retest. They do not show the leg into the base, so this chart cannot confirm that the example is a drop base drop and not a rally base drop. It is used here to show how to mark the supply zone and trade the return to it, because both patterns leave a supply zone that you sell the same way. On your own charts, scroll left of the base before you name the pattern. If price was falling into the base, it is DBD. If it was rising, it is a rally base drop - see the table below.
Selling the return to the base: entry, stop and target
This is an illustrative worked example. The zone prices come from the chart at the top of the page. The account size, stop buffer and risk are made up for the lesson.
Setup 1: sell limit inside the zone
Place a sell limit at 1.14130, inside the zone. The zone top is 1.14152. Put the stop a few pips above it, so a normal wick does not stop you out. In this example that is about 3 pips above the zone top, 5 pips above your entry. Set a first target at twice the risk, 10 pips below the entry, and a final target at the marker 2 level, 1.13758, where the drop broke the previous low.
In this past example, the 19-pip move down after the retest went past the 10-pip first target. Here is a simple rule: take part of the trade off at twice your risk, move the stop to entry, and let the rest run toward the marker 2 level.
A tight stop lets you trade a larger size for the same money at risk. The catch is that spread and slippage then eat a bigger share of that risk. If the spread is a large part of your stop, widen the stop and cut the size.
Setup 2: sell after a rejection candle
Wait for price to enter the zone and print a bearish candle that closes back below the zone bottom. On this chart, that means a close below 1.14097. Sell at that close, put the stop above the rejection wick or the zone top, and use the same targets. You will miss trades that turn from inside the zone without that candle. In return, you skip some zones that were about to break.
When drop base drop zones hold, and when to skip them
DBD zones tend to work best inside a clear downtrend on the higher timeframe, on the first return, and when the exit broke a swing low. Skip them when they go against a higher-timeframe uptrend, just before major news, when a demand zone sits just below your entry, or in a sideways market where every drop gets bought back.
| Pros | Cons |
|---|---|
| The stop has a clear place above the base | Limit orders miss when price stops just short of the zone |
| You sell in the direction of the trend | Tight stops are easy to hit with spread and news spikes |
The bullish twin and the reversal versions
Drop base drop is the bearish continuation version. Its bullish twin is rally base rally, and drop base rally and rally base drop are the two reversal versions. The reversal versions trade against the earlier move, so the higher-timeframe trend check matters more for them. The table shows how the four differ.
| Pattern | Move before base | Move after base | Zone left | Continuation or reversal |
|---|---|---|---|---|
| Drop base drop (DBD) | Down | Down | Supply | Continuation |
| Rally base rally (RBR) | Up | Up | Demand | Continuation |
| Drop base rally (DBR) | Down | Up | Demand | Reversal |
| Rally base drop (RBD) | Up | Down | Supply | Reversal |
The sketch below puts the four shapes side by side. The leg out of the base decides the zone type. The leg into it tells you whether the trend continues or turns.
Practical tips for trading DBD zones
- Mark zones on the 4-hour or daily chart, then fine-tune your entry on the 1-hour chart.
- Write the touch count next to each zone, and stop trading it after the first return.
- Set a price alert at the zone bottom instead of watching the chart for days.
- Never widen your stop when price pokes into the zone.
- Work out your size from your risk in money and your stop distance, not from a fixed lot.
FAQ
Is there an indicator that draws drop base drop zones automatically?
Many charting platforms have community supply and demand indicators, but each one uses its own rules for base length and exit strength. Before you trust one, check how it defines a base, and whether it repaints or deletes zones after they are touched.
Can I trade drop base drop on gold, indices or crypto?
Yes. The pattern comes from unfilled orders, not from anything specific to currencies, so it shows up in any liquid market. Size your stop buffer to the market's normal wick size, which is usually larger than on major forex pairs.