









Zone strength
Also called Zone quality, Supply and demand zone strength, Level strength
Zone strength is a grade of how likely a supply or demand zone is to hold when price comes back to it. You judge it by how fast price left the zone, whether that move broke structure, and how often the zone has been tested.
Grading a zone before you trade it keeps you from buying or selling every old rectangle on your chart. Buy a weak zone and price often slices through it, taking your stop with it. Strong zones let you use a tight stop and a clear target, so the grade tells you two things: whether to trade, and how much to risk.
How to grade zone strength: a 6-point checklist
Give the zone one point for each rule it passes. Grade it as soon as it forms, before price comes back. Re-check freshness each time price returns; a second visit loses that point.
- A clean base. The zone is the last opposite candle, or group of candles, right before a sharp move. Mark it from the base's high to its low. The base passes the clean-base rule when no wick from the neighbouring candles cuts into the zone, and the base candle's wick on the far edge is not far longer than its body. Base length is not part of this rule. Rule 5 scores it.
- A fast departure. Price leaves with large-bodied candles. Within a few candles it travels several times the zone's own width.
- A break of structure. The move takes out a recent swing high (for demand) or swing low (for supply). This shows real orders were behind it.
- Freshness. Price has not come back to the zone since it formed. Each return uses up some of the orders resting there.
- A short base. The base is one to three candles long. A short base means one side took over quickly. A long sideways base means buyers and sellers were balanced.
- Bigger-picture fit. The zone points the same way as the higher-timeframe trend, and there is room to the next opposing zone.
Decision rule: with 5–6 points, trade at your normal risk. With 3–4, wait for a confirming candle or use half size. With 0–2, skip it. Whatever the score, the stop must fit: if a stop beyond the far edge risks more than 1% even at your smallest position size, skip the trade.
For supply, flip every rule: base before a drop, break of a swing low, stop above the zone.
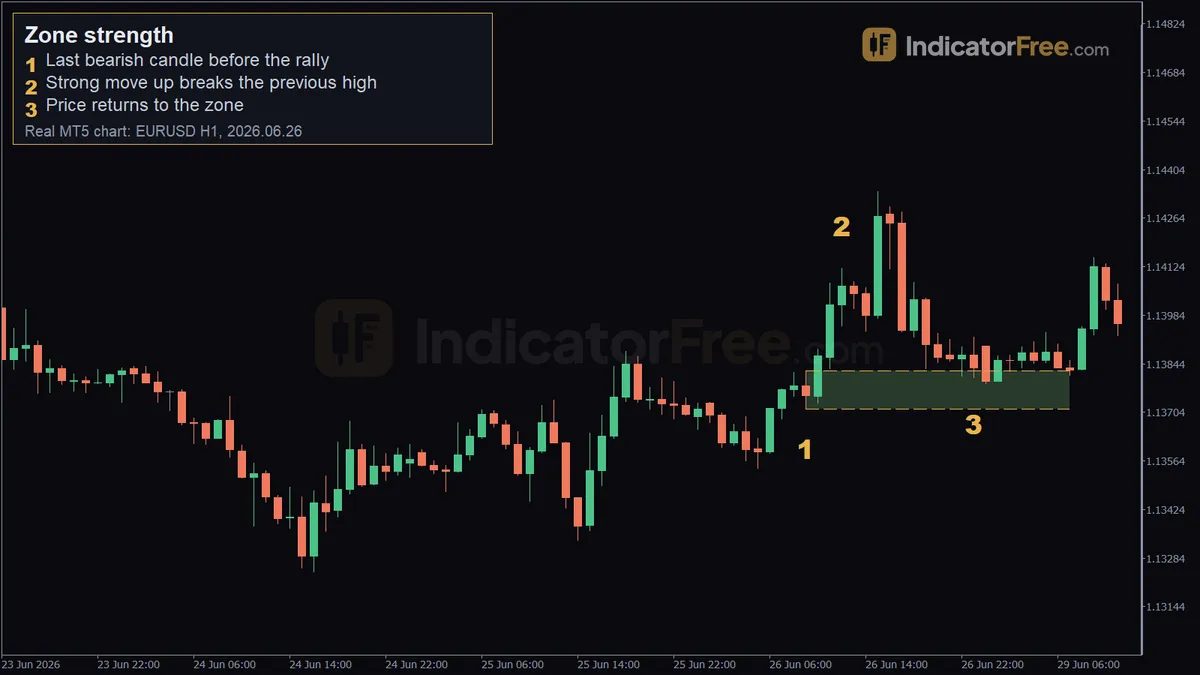
The chart below shows the shape you are looking for: one bearish base candle, a fast rally that clears the prior high, and a first return into the zone.
What makes a zone weak or broken
A zone is weak when the move away from it was slow, with small, overlapping candles. It is also weak when that move stalled below the last swing high instead of breaking it. A zone price has already visited two or three times is weaker too, because most of its orders have already been filled.
Width matters. If the zone is wide compared with the move it produced, your stop has to be wide too, and the trade rarely pays enough for the risk.
A zone is broken once a candle closes beyond its far edge, meaning below a demand zone or above a supply zone. Stop treating it as that zone. Broken demand often turns into resistance on the next rally, the same way broken support does.
Common misread: "It held three times, so it must be strong." Look at the bounces. If each one is smaller than the last, buyers are running out, and the next test is the one most likely to break.
The EURUSD 1-hour example, marker by marker
The chart at the top of the page is a past EURUSD 1-hour example, not a prediction.
Marker 1, the base. The last bearish candle before the rally closed at 2026.06.26 09:00. Its range sets the zone from 1.13714 to 1.13824, which is 11 pips wide. It is a single candle, so the base is short. One point. Check on your chart that no wick from the neighbouring candles cuts into the zone, and that this candle's lower wick is not far longer than its body. If either one happens, the base is not clean.
Marker 2, the departure. Over the next 3 candles price moved 35 pips and broke the 10-bar high, reaching 1.1412 at 12:00. That move is about three times the zone's width (35 ÷ 11 ≈ 3.2), and it broke structure. Two more points.
Marker 3, the return. At 2026.06.26 23:00 price came back to 1.13804, inside the zone. This was the first return, so the zone was still fresh. One more point. Price then moved 35 pips up.
That is 4 confirmed points: short base, departure, structure and freshness. You check the other two yourself: a clean base and higher-timeframe fit. On 4 points, the decision rule says to wait for a confirming candle or use half size. If both checks pass, the score reaches 6 and normal risk applies.
Trading a strong demand zone: entry, stop and target
Buying the first return to the EURUSD zone
The levels below come from the chart above. The stop placement, account size and risk are an illustrative example.
- Entry: a buy limit at 1.13804, where price came back into the zone.
- Stop loss: 1 pip below the zone's low of 1.13714, which puts it 10 pips from your entry. A wick to this level closes the trade. The zone itself only counts as broken once a candle closes below 1.13714.
- Target: 1.1412, the high the departure made. The move that created the zone gives you a natural first target.
- Size: the zone scores 4 points, so take this trade at half size (0.50 lot in the working below). Use full size only if the clean-base and higher-timeframe checks pass.
The working below takes those levels and turns them into a position size for a $10,000 account risking 1%. On EURUSD, one standard lot (100,000 units) is worth $10 per pip.
If price never comes back to the zone, you get no fill and no trade. That is fine. Chasing the move after the fact throws away the tight stop that made the zone worth trading.
When zone strength works and when to stand aside
Grading zones works best when the market is trending, swing highs and lows are easy to see, and the zone is fresh. It also helps when the zone lines up with the higher-timeframe trend, because orders on several timeframes then point the same way.
Stand aside just before major news releases, because spikes can run straight through any zone. Skip choppy ranges where every candle overlaps. Nothing departs fast there, so nothing scores well. Ignore zones far back on the chart that price has already traded through.
| Pros | Cons | |
|---|---|---|
| Risk | Stop sits just beyond a clear edge, so it stays small | Wide zones force wide stops |
| Decisions | A checklist score replaces gut feel | Some rules still need judgement ("fast", "clear") |
| Targets | The departure high or low gives a ready first target | Price may stall before the departure high |
| Selectivity | Filters out most weak rectangles | Strong zones are rare, so you trade less often |
Two habits that keep your zone scores honest
- Re-grade after news. A spike that pokes through the zone without a close beyond it still uses up orders. Count it as a touch.
- Keep a score log. Write down each zone's score and what happened. After a few dozen trades you will see which score you can actually trust.
FAQ
What is zone to zone trading?
You enter at one zone and aim for the next opposing zone: buy at demand, target the supply above it, or the reverse. Zone strength matters at both ends. Enter only at a well-scored zone, and take profit a little before a strong opposing zone, since that is where price is most likely to turn.
Should I draw zone edges with wicks or candle bodies?
Use the wick for the far edge, where your stop goes, so the whole rejection sits inside the zone. Some traders use the body for the near edge to get a tighter entry, but then some returns will miss the fill. The EURUSD example uses the full candle range, 1.13714 to 1.13824.
Does a 4-hour or daily zone beat a 1-hour zone?
Not on its own. A 4-hour or daily zone is usually wider, so it needs a wider stop, and you grade it by the same six rules as any other zone. When a 1-hour zone sits inside a daily zone that points the same way, use the 1-hour zone for entry and stop. The daily zone is what passes rule 6, bigger-picture fit. It does not add an extra point.