









Previous day high
Also called PDH, Prior day high, Yesterday's high
The previous day high is the highest price a market reached during the last completed daily session. Traders use it as a key level where price often stalls, reverses or breaks out the next day.
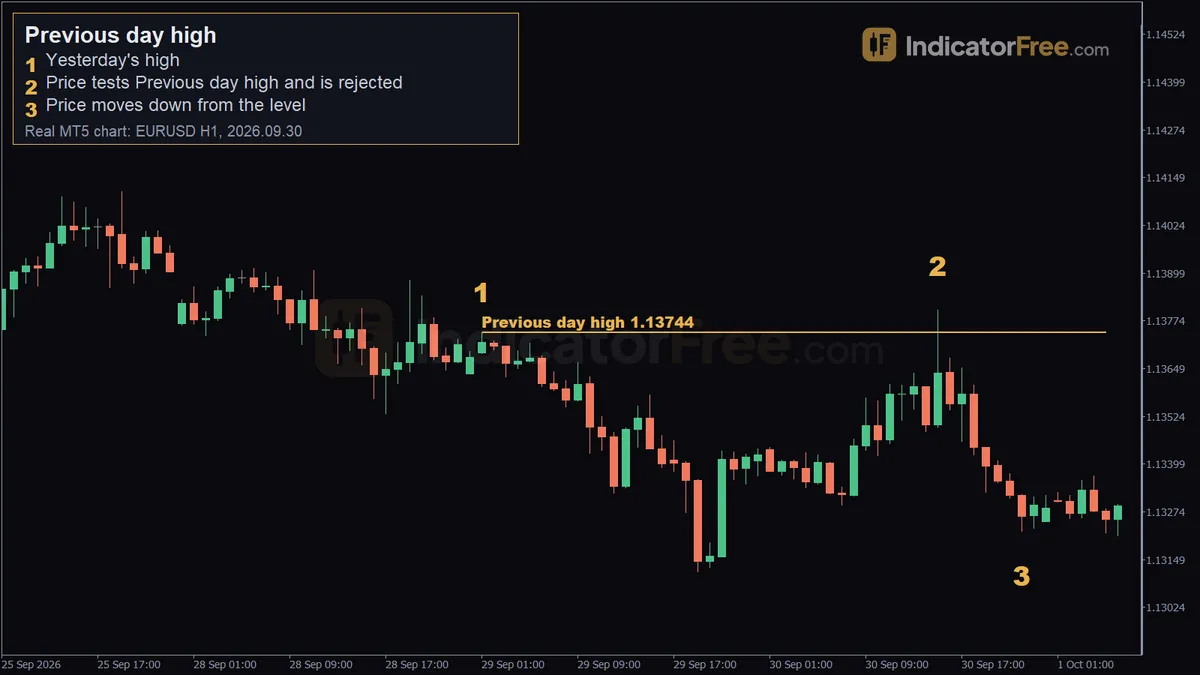
The previous day high is yesterday's top price. Because so many traders mark the same line, stop and breakout orders gather just above it. Where you put your entry and stop around it decides whether those orders work for you or against you.
How to mark the previous day high correctly
- Open the daily chart, or a chart that marks where each day starts.
- Find the last daily candle that has fully closed. The level is the tip of its upper wick. Do not use its close or the top of its body.
- Check which clock your chart uses, and use the same day boundary every day.
- If your chart prints a short Sunday candle, use Friday's high as Monday's previous day high. A few quiet Sunday hours rarely set a level that matters.
- Draw one horizontal line at the exact high and extend it across today's session only. Tomorrow you will draw a new one.
- Before you trade, note how far price is from the line. If it is far away, price may never reach it today.
What makes a previous day high strong, weak or broken
A strong previous day high was a clear turning point. Yesterday's candle left a long upper wick there, today is the first test, and the line sits on another level such as a weekly high, a round number or a supply zone. When several levels meet like this it is called confluence.
A weak previous day high comes from a narrow, quiet day. Its high is close to its low, so the level carries little information. It also weakens each time price touches it during today's session, because every touch uses up some of the orders sitting there.
A broken previous day high has hourly candles closing above it and holding above it. The clearest proof is price dropping back to the line and bouncing up from it, so old resistance is now acting as support.
The most common misread is treating a wick above the line as a breakout. If the candle closes back below the level, the high was only swept: price ran the stops above it and was rejected. That is closer to a sell signal than a buy signal.
The mirror level, the previous day low, follows the same logic in reverse.
Reading the EURUSD example: a sweep and rejection at 1.13744
The chart at the top of the page is a past 1-hour EURUSD example, not a prediction.
Marker 1 is yesterday's high at 1.13744, printed on 2026.09.29 at 01:00. On 30 September this was the previous day high.
Marker 2 is the test. At 15:00 on 2026.09.30, price pushed to 1.13803, about 6 pips above the level (1.13803 − 1.13744 = 0.00059, or 5.9 pips). Buyers could not hold it there, and price fell back under the line.
Marker 3 is the result. By 22:00 the same day price was at 1.13224. That is 58 pips below the 1.13803 peak.
This chart teaches the overshoot. If you had sold exactly at 1.13744 with a stop a few pips above, the spike would have stopped you out before the drop. If you had bought the push above the line as a breakout, you would have been trapped.
Trading setups at the previous day high
Setup 1: Sell the rejection (the EURUSD chart)
- Entry: wait for a 1-hour candle to close back below 1.13744 after the spike to 1.13803. Sell on that close, or on a small pullback up to the line.
- Stop loss: a few pips above the sweep high of 1.13803.
- Target: first the middle of yesterday's range, then the previous day low. On this past chart price reached 1.13224, 58 pips below the peak. Do not plan as if every rejection will travel that far.
Setup 2: Buy the break, retest and continuation
The chart below is an illustrative example. Two candles close above the previous day high. Price then pulls back, the retest dips just under the line but still closes above it, and the next bullish candle closes higher.
- Entry: on the close of the first bullish candle after the retest holds (the candle marked Entry).
- Stop loss: a few pips below the retest low. In this chart that puts the stop 24 pips below the entry, so the risk is 24 pips.
- Target: twice the risk: 24 × 2 = 48 pips above the entry, the line marked Target (2× risk).
Use this rule to choose between the two setups. If price closes back below the line within one or two candles of poking above it, trade Setup 1. If two candles close above it and a retest holds, trade Setup 2. If neither happens, stay out.
Sizing a trade when the stop sits beyond the wick
Set your size from the distance between your entry and your stop. The figures below are an illustrative example: a $10,000 account, 1% risk and a 20-pip stop on EURUSD, where one standard lot (100,000 units) is worth $10 per pip.
With the 24-pip stop from Setup 2, the same arithmetic gives $100 ÷ (24 × $10) = $100 ÷ $240, so the size drops to about 0.42 lots.
If the sweep makes your stop 30 pips instead of 20, cut the size. Do not move the stop closer to the line to keep the size.
When the previous day high works and when to skip it
The level tends to react best when the busy London and New York hours bring volume to the market. It also works better when the trade agrees with your higher timeframe bias: fade it in a daily downtrend, buy the break in a daily uptrend. The first test of the day is the cleanest.
Skip it in the minutes around high-impact news, when spreads widen and spikes ignore levels. Skip it after a narrow, quiet day, and on days when price reaches the level only after a long run that has already used up the day's normal movement.
Practical tips for previous day high trades
- Draw the line before the session opens, so you do not move it later to fit a trade you already want.
- After two failed tests in one session, stop trading that level for the day.
Quick checklist:
- Level taken from the wick of the last closed daily candle, using the same day boundary you chose in step 3
- First or second test today, with no high-impact news due
- Candle has closed: back below (sell) or holding above (buy)
- Stop beyond the wick: a few pips above the sweep high for a sell, a few pips below the retest low for a buy, size set from that distance
FAQ
Which time zone should I use for the previous day high?
Use the time zone where most of your market's volume settles its day. In forex, many traders use charts whose day ends at the New York close. Whatever you choose, use the same clock every day, because a different day boundary gives a different high.
Does the previous day high work on stocks, indices and crypto?
Yes. The logic is the same in any market where many traders watch the same daily candle. For stocks, overnight gaps can open the day above or below the level, so wait to see how price behaves when it comes back to the line.
Do I need an indicator to plot the previous day high and low?
No. You can draw both by hand in under a minute. An indicator saves time and removes misclicks if you trade many pairs. Check that it uses the same day boundary as your chart.