









Inside bar
Also called Inside candle, IB, Inside day
An inside bar is a candle whose high and low both stay within the high and low of the candle just before it, called the mother bar. It shows the market pausing and its range shrinking before the next move.
The pause gives you two exact prices: the inside bar's high and its low. When price breaks one of them, you see which side won the pause. The other side gives you a stop you can measure before you place the trade.
How to identify an inside bar: a 5-step check
- Find the mother bar. The mother bar is the candle right before the one you are checking. Its high and low set the box.
- Compare the highs. The new candle's high must be below the mother bar's high.
- Compare the lows. The new candle's low must be above the mother bar's low.
- Use the wicks, not just the bodies. If the body sits inside but a wick sticks out, the candle is not an inside bar. Comparing bodies only is a different pattern, the harami.
- Wait for the close. Until the candle closes, its high or low can still move outside the box.
The colour does not matter for this check. A red candle and a green candle pass or fail the same way.
Traders disagree on one edge case: a high or low that exactly equals the mother bar's. Choose one rule and apply it every time. If you don't, your trade record mixes two different patterns.
What makes an inside bar weak or broken
An inside bar is broken if any part of its wick crosses the mother bar's high or low. At that point it is not an inside bar, even if it looks like one at a glance.
A valid inside bar can still be weak:
- The mother bar is small, no bigger than the candles around it. The box is narrow, so normal noise causes the breaks.
- The market is flat. In a sideways range, inside bars appear all the time and their breakouts often reverse.
- There is little contraction. Decision rule: if the inside bar's range is more than two-thirds of the mother bar's range, treat it as weak. Skip it or cut your size.
- It formed in quiet hours. On an intraday chart, a candle printed while few people are trading shrinks because volume is thin, not because the market is pausing. Traders often misread this. Check the candle's time before you trust it.
- News is due. If a scheduled release lands during the setup, the release decides the break, not the pattern.
The drawing below puts a valid inside bar next to a broken one and a weak one.
The EURUSD 1-hour inside bar from 1 October 2026
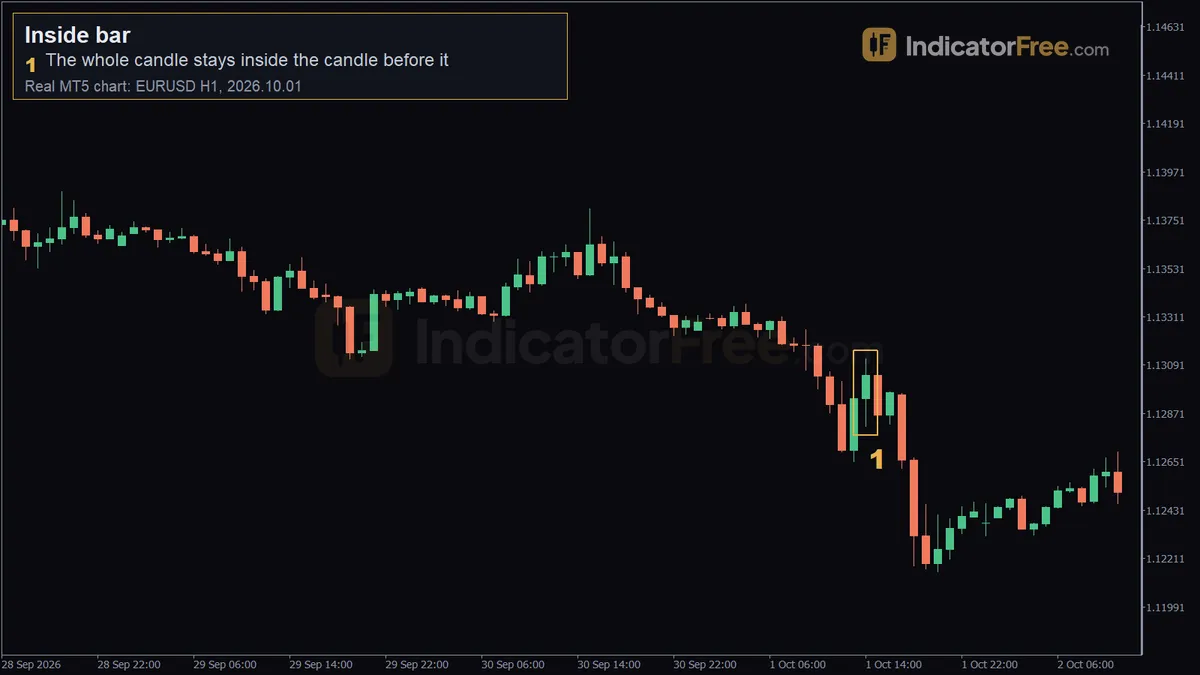
The chart at the top of the page is a past example, not a prediction. Marker 1 points to the 1-hour candle at 15:00 on 2026.10.01. It opened at 1.13045, rose to a high of 1.13072, fell to a low of 1.12844 and closed at 1.12863. The whole candle, wicks included, stays inside the candle before it.
Here is what those four prices tell you:
- Range: 1.13072 − 1.12844 = 0.00228, or 22.8 pips.
- Body: 1.13045 − 1.12863 = 0.00182, or 18.2 pips. Price closed lower than it opened.
- Close location: 1.12863 − 1.12844 = 1.9 pips above the low.
Sellers controlled the pause and closed it near its bottom edge. That leans toward a break lower, but a lean is not a signal. The trade signal comes only when price trades through 1.12844 or 1.13072.
Trading setups around an inside bar breakout
Setup 1: stop orders on both sides of the inside bar
Here are the orders a plan would have used on the EURUSD candle above. They show how to build the trade, not what price did afterwards.
- Entry: a sell stop just below the low of 1.12844, and a buy stop just above the high of 1.13072. Many traders leave a buffer of 1 pip plus the spread.
- Stop loss: the opposite edge. A short stops above 1.13072. A long stops below 1.12844. Your risk is the 22.8-pip range plus both buffers: with 1 pip on each side, 24.8 pips.
- Target: twice the risk, measured from your fill price. With the 24.8-pip stop, that is 49.6 pips.
- Management: when one order fills, cancel the other.
The chart below shows the same idea on a simple illustrative chart. It has a wide mother bar, a smaller inside bar and a breakout through the inside bar's high. The target is drawn at 1R so it fits on the chart.
Buffers are left out of the drawing to keep it clean.
Your position size comes from the stop distance, not from how sure you feel. Here is an illustrative example: a $10,000 account risks 1% on the 24.8-pip stop. EURUSD pays $10 per pip on a standard lot (100,000 units), so 0.10 lot pays $1 per pip.
Setup 2: wait for a close beyond the mother bar
Waiting for a close filters out wicks that poke through and snap back. The cost is a later entry and more distance to your stop.
- Entry: after a candle closes above the mother bar's high (long) or below its low (short).
- Stop loss: beyond the opposite edge of the inside bar. For a short on the EURUSD example, that is above 1.13072.
- Target: the mother bar's range, measured from the breakout level.
Read the mother bar's high and low from the candle before marker 1 on the chart at the top. They sit above 1.13072 and below 1.12844.
Decision rule: if the inside bar comes right after a strong move, use Setup 1 but place only the order in the direction of that move. If it sits in the middle of a range, use Setup 2 or skip it.
When inside bars work and when to skip them
Inside bars tend to be cleaner after a strong move, when the mother bar is clearly larger than recent candles. They also tend to be cleaner on 4-hour and daily charts, where each candle holds more trading. Skip them in sideways chop, just before scheduled news, and during thin hours on short timeframes.
| Pros | Cons |
|---|---|
| Gives exact entry and stop prices | Breakouts can fail and reverse through the other side |
| The stop is usually smaller than the mother bar's range | On short timeframes, the spread is a large share of a small range |
| Works on any market that has candles | Appears often in ranges, where it means little |
| Easy to check against fixed rules | Needs a trend or volatility filter to be useful |
Bullish and bearish inside bars
A bullish inside bar breaks above its high. It carries more weight in an uptrend and when it closes near its top. A bearish inside bar breaks below its low, and a close near the low leans that way, like the EURUSD candle above.
Practical tips for trading inside bars
- Mark the mother bar's high and low as well. A breakout often stalls at that next edge.
- Move your stop to breakeven only after price clears the mother bar's edge, not as soon as the order fills.
- Compare the inside bar's range to the Average True Range (ATR, the average size of recent candles). If it is far below average, the stop sits inside normal noise, so widen the buffer or skip the trade.
- Cancel unfilled orders after about three candles. By then the pause no longer tells you much.
- Include the spread in your entry buffer, especially on short timeframes.
- Log equal-high and equal-low cases separately, so you learn whether your rule for them helps.
Quick inside bar checklist
- High below and low above the mother bar, wicks included, candle closed.
- Mother bar larger than recent candles; no news due; not printed in quiet hours.
- Orders beyond both edges, stop on the far side, size worked out from the stop distance.
- Cancel the other order on a fill; cancel both after three candles.
FAQ
What happens if price breaks both sides of the inside bar?
If both orders are still working, you can be filled one way, stopped out, then filled the other way, taking two losses on one pattern. Some traders treat a failed break that reverses through the other side as a separate setup, with its own entry and stop.
Can I trade inside bars on stocks, gold or crypto?
Yes, the rules work on any candle chart. On markets that gap overnight, such as stocks on a daily chart, price can open beyond your stop. Your loss can then be bigger than planned, so size with that in mind.