









NR7
Also called Narrow Range 7, NR7 candle, NR7 bar, Narrow range bar
NR7 (narrow range 7) is a candle whose high-to-low range is the smallest of the last seven candles, counting itself. Traders read it as a sign that volatility has dried up and that a breakout may follow.
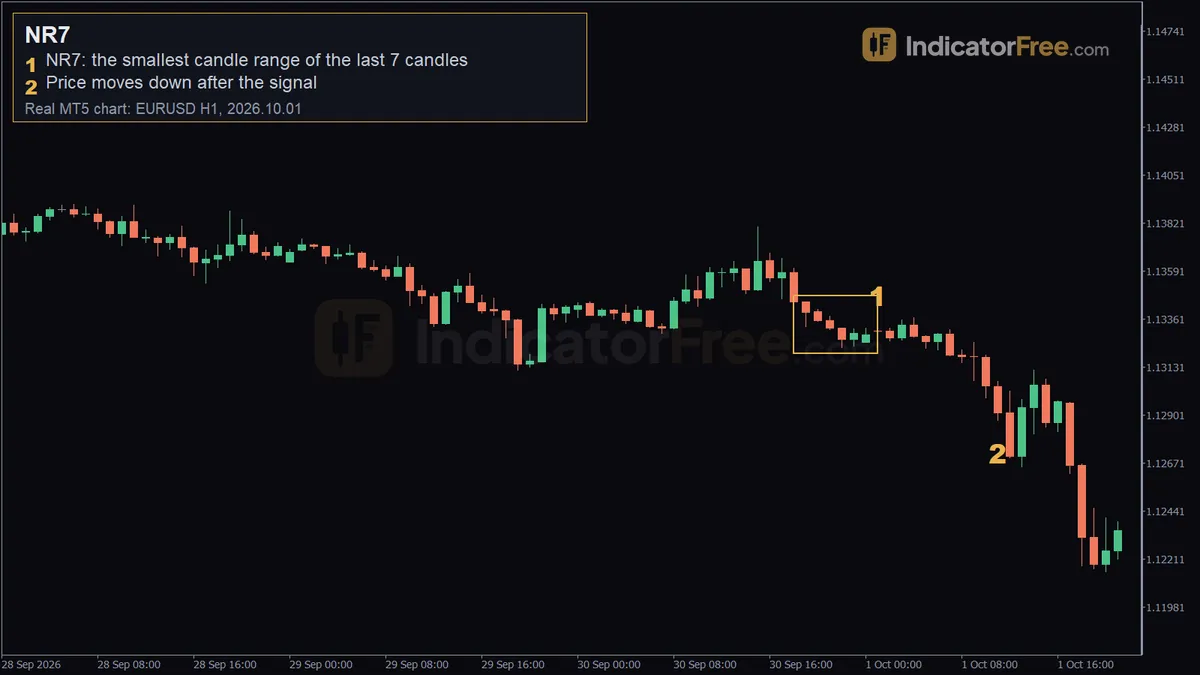
An NR7 tells you when a move may start. It does not tell you which way it will go. The narrow candle gives you a tight, clearly marked place for your entry and stop. If you trade it in one direction on a hunch, though, you are back to guessing.
How to spot an NR7 candle: a 5-step checklist
- Wait for the candle to close. A live candle can still stretch, so it does not count yet.
- Measure its full range: the high minus the low, wicks included. The body (open to close) is not the range.
- Measure the range of each of the six candles before it.
- Check that your candle's range is smaller than all six. If it ties with one of them, pick one rule (count ties or skip them) and keep to it.
- Draw horizontal lines at the candle's high and low. These are your trigger levels.
The same count works in any market and on any timeframe. In the stock market, traders mostly use NR7 on daily candles, where it marks the quietest session of the last seven. Forex traders use it on daily and intraday charts. The idea comes from trader Toby Crabel's research on range contraction.
The chart below shows the textbook shape. The ranges shrink across seven candles, the seventh is the narrowest, and the next candle breaks below its low.
What makes an NR7 strong, weak or broken
An NR7 carries more weight when it forms at a level the market already respects, such as a prior high, a prior low or a round number. It also counts for more after a strong trend has paused for several candles, and when it is an inside bar as well (its high below the previous high, its low above the previous low).
It is weak when narrow candles are normal anyway. That happens in the quietest hours of the day, around holidays and in the middle of a sideways chop where every candle is small. A narrow candle among narrow candles tells you very little.
It is broken when price clears one side and then a candle closes back inside the NR7 range. That breakout has failed. Exit at that close. If your stop sits beyond the whole seven-candle cluster, the minimum is to move it to just beyond the opposite side of the NR7 candle. Don't hold the trade hoping for a return.
Your opposite order was cancelled when the first one filled, so nothing flips you into the other direction automatically. If price later breaks the other side, treat it as a new setup and place a fresh order only if it still passes your rules. The chart below shows the sequence.
A common misread is mistaking a small body for a narrow range. A doji with long wicks can have a wide range. Always measure from high to low.
Use one decision rule for tiny candles. If your spread is more than about a third of the NR7 range, either set your stop beyond the whole seven-candle cluster and cut your position size, or skip the trade.
The EURUSD 1-hour NR7 from 1 October 2026, marker by marker
The chart at the top of the page is a past example, not a prediction.
Marker 1, the NR7 (2026.10.01 01:00). The candle opened at 1.13303, reached a high of 1.13325, dipped to a low of 1.13300 and closed at 1.13302. Its range is 1.13325 − 1.13300 = 0.00025, or 2.5 pips. That is the smallest range of the last seven candles. The open and close are almost equal, so neither buyers nor sellers took control in that hour.
Marker 2, the move that followed (2026.10.01 11:00). Ten candles later, price had fallen about 43 pips, to 1.12874. Measured from the NR7 low: 1.13300 − 1.12874 = 0.00426, or 42.6 pips.
The move was about 17 times the NR7's own range (42.6 ÷ 2.5 = 17.04), which shows contraction turning into expansion. But a 2.5-pip candle is so narrow that normal hourly noise can touch both sides. At 2.5 pips, any spread above about 0.8 pip breaks the one-third rule, so here you would use the cluster stop or skip the trade.
Trading the NR7 breakout: entry, stop loss and target
Two-sided stop orders around the NR7 candle
On the top chart, you would place a buy stop just above 1.13325 and a sell stop just below 1.13300. When one fills, cancel the other. The facts here show the drop; on a 2.5-pip candle, check whether price touched the buy stop first, because that is exactly the both-sides risk.
The stop loss for the sell goes above the NR7 high at 1.13325, which risks about 2.5 pips plus your buffer. For the target, use a fixed multiple of your risk or the next support level below. In this past example, price reached 1.12874 within ten candles.
Set a time stop as well. If neither side triggers within three candles, cancel both orders. The squeeze has not paid off. The facts for this chart do not show when the sell would have filled, so don't assume this example passed that rule.
Waiting for a close outside the NR7 range
If stop orders catch you on false breaks, wait for a candle to close below 1.13300 and then sell at that close. Put the stop above 1.13325, or above the breakout candle's high if that is higher. Use the same target logic as above.
The two entry methods trade off like this:
| Stop orders on both sides | Waiting for a close outside | |
|---|---|---|
| Entry price | Right at the trigger level | At the breakout candle's close, often further from the NR7 |
| False-break exposure | Any poke through the level fills you | Pokes that close back inside are filtered out |
| Stop distance | NR7 range plus your buffers | Often wider, if the stop goes beyond the breakout candle |
| Screen time | Low once placed, but the unfilled order must be cancelled | You must be there when the candle closes |
Sizing the trade from the NR7 range
In this illustrative example, only the EURUSD candle's high and low are real. Your account is $10,000 and you risk 1% per trade. You place the sell stop 1 pip below the 1.13300 low and the stop loss 1 pip above the 1.13325 high. On a USD-quoted pair, one standard lot (100,000 units) is worth $10 per pip.
That is more than two standard lots on a $10,000 account, only because the stop is tiny. On that size, a slightly wider spread or a few pips of slippage eats a large share of your planned $100. This is why the one-third rule matters on very narrow NR7 candles.
When NR7 works well and when to skip it
NR7 works best when a known source of activity is coming, such as a major session opening, and when the higher-timeframe trend points the same way as the likely break. Daily candles give a cleaner reading than very short timeframes, where narrow candles appear all the time.
Skip it right before high-impact news, because a spike can fill both orders and add slippage. Skip it late on a Friday, and skip it when you can't watch the trade to cancel the unfilled order.
NR7 trading tips
- Compare the NR7 range with the Average True Range (ATR), the average high-to-low range over recent candles, usually 14. A candle far below the average range shows a deeper squeeze than one just under it.
- If a second NR7 forms before any break, move both orders to the newer, tighter candle.
- Write down the spread when you place the orders. Over many trades, this shows you which hours make NR7 setups too costly.
- Use a time stop so an order you forgot about doesn't fill hours later in a different market.
Quick NR7 checklist
- Is the candle closed, with a full range smaller than each of the previous six?
- Is there no high-impact news due in the next few candles?
- Are the orders placed above the high and below the low, one-cancels-the-other, with a time stop?
FAQ
Can I find NR7 candles automatically instead of counting by eye?
Yes. Many charting platforms have scripts or screeners that mark NR7 candles. Before you trust one, check that it measures the full high-to-low range and only counts closed candles.
What does it mean when a candle is both NR4 and NR7?
Every NR7 is automatically an NR4 too: if a candle is the narrowest of the last seven, it is also the narrowest of the last four. When traders talk about NR4/NR7 setups, the NR7 is the stricter, rarer filter. NR4 and ID/NR4 each have their own glossary entry.
Which side breaks more often after an NR7?
The candle itself has no built-in side. It only marks a pause, and the direction comes from context such as the higher-timeframe trend and nearby support or resistance. If your own trade records show one side failing more often on a given pair and timeframe, use that data rather than a general rule.