









Donchian Channel
Also called Donchian Channels, Donchian bands, Price channel, DC
The Donchian Channel is a volatility indicator with three lines: the highest high and the lowest low of the last N candles, plus a middle line halfway between them. A close outside the channel shows a breakout to a new high or low.
The channel turns a vague feeling that "price is breaking out" into a yes-or-no test you can check on every candle. That one test can set your entry, your stop and your exit. Those three decisions are what protect your account in a breakout trade.
How the three Donchian lines are built
The upper line is the highest high of the last N candles. The lower line is the lowest low of the same candles. The middle line is the average of the two: (upper + lower) ÷ 2.
The distance between the upper and lower lines is the full price range of the period. That makes the channel's width a simple way to measure volatility, meaning how far price is moving. A wide channel means big swings. A narrow one means price is quiet.
The lines move in steps, not smooth curves. The upper line rises only when price makes a new high. It falls only when the old high gets too old and drops out of the lookback window. The drawing below shows both kinds of step.
Here is a rule most guides skip. To find out when the upper line will drop, count back N candles to the candle that set the high. When that candle leaves the window, the line steps down to the next-highest high. A breakout then gets easier even though price has not moved. Know that date before you treat a breakout as unusual.
Donchian Channel inputs and what each one changes
Different charting tools label these inputs in slightly different ways, but the maths is the same everywhere.
| Input | What it sets | What changing it does |
|---|---|---|
| Period (lookback) | How many candles the high and low are taken from | A shorter period keeps the lines close to price, so you get more signals and more false breaks. A longer period gives fewer signals that point to bigger moves. |
| Price source | Highs and lows, or closing prices | Lines built from closes ignore wicks. They react a little later, but one spike candle cannot shift them. |
| Shift (offset) | Whether the current candle counts in the window | With a shift of 1, the live candle is measured against the previous N candles, so a close above the line is possible. With 0, the line moves up with price and a close above it can never happen. |
| Middle line | Shows or hides the midpoint | Only a display setting; it does not change the upper or lower line. Turn it on if you use it for stops or exits. |
Donchian Channel signals, one by one
Close above the upper line: bullish breakout
A candle closes higher than the highest high of the previous N candles. Price has done something it has not done in the whole lookback period. Breakout traders read this as a buy signal.
Close below the lower line: bearish breakdown
This is the mirror image. A close under the lowest low of the window is a signal to sell, or to close a long trade you are still holding.
Price crossing back through the middle line: momentum fading
After a breakout, a strong trend usually stays in the outer half of the channel. A close back through the middle line means the push has lost force. Many traders tighten their stop or take partial profit here.
A narrow, flat channel: a volatility squeeze
When both lines stay flat and close together for many candles, the market is coiling. This is not a signal to trade. It tells you a breakout from this range may travel further, because quiet periods can end in a larger move.
Touching a shorter opposite channel: the exit signal
Many systems exit with a second, shorter channel. If you are long from a 20-candle breakout, you sell when price closes below the 10-candle low. The exit channel sits closer to price, so you keep part of the trend without waiting for a full reversal.
The common misread: "price is touching the upper line"
On many charts, the channel includes the current candle. Every new high then lifts the upper line with it, so price seems to "ride" the line all the time. That is not a signal. The real test is a close above the line as it stood before this candle, which is what a shift of 1 shows.
Wicks cause a second trap. In the illustrative chart below, one candle's wick pokes above the prior 20-candle high, but the candle closes back below it. There is no signal. However, that wick sets a new high, so the next breakout must close above the top of that wick, not above the old line.
If the candle has not closed, you have no signal. If it closed back inside after a wick above, check where the upper line now sits before you plan the next entry.
Trading a Donchian breakout on a real EURUSD chart
Setup: close above the 20-candle high, EURUSD 1-hour, 14 August 2026
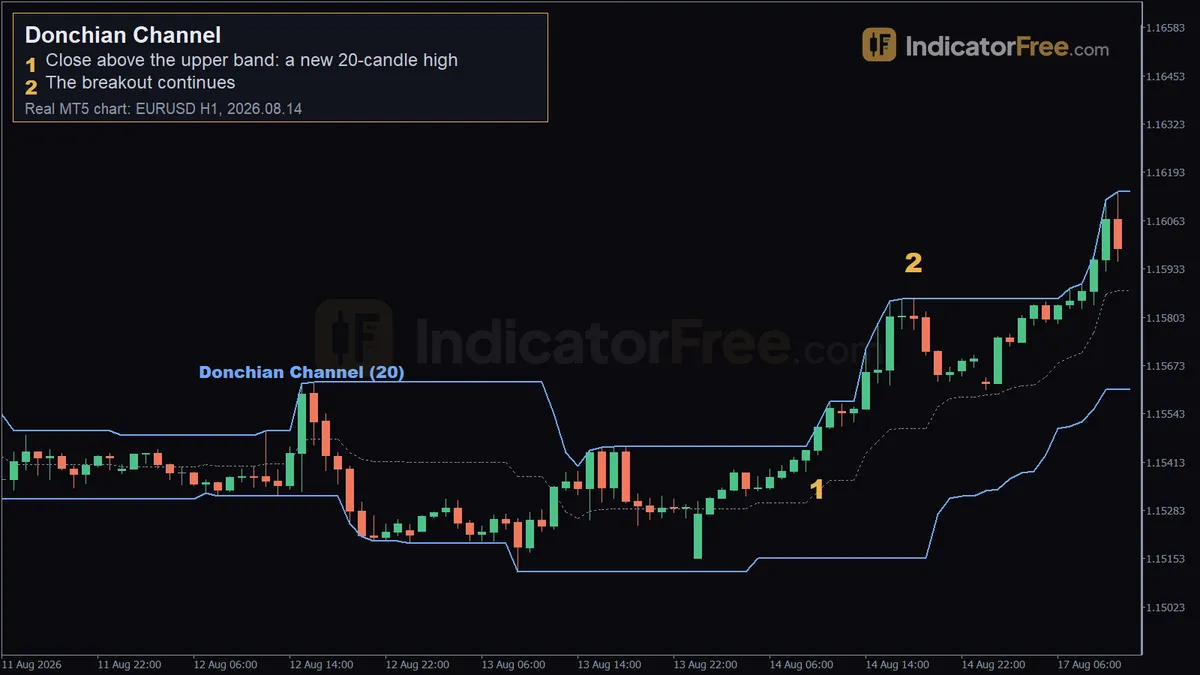
The chart at the top of this page is a past example, not a prediction. On 14 August 2026, the 10:00 candle on the EURUSD 1-hour chart closed at 1.15508. The upper Donchian line was at 1.15454, so the close was above it. Marker 1 shows this candle: a new 20-candle high.
- Entry trigger: the 10:00 close above 1.15454. You enter at the next candle's open, close to 1.15508. You do not buy while the candle is still forming.
- Stop loss: a tight stop goes a few pips under the broken line at 1.15454, on the logic that a breakout which falls back inside has failed. A wider stop goes under the middle line, which gives the trade more room but means you trade a smaller size.
- Exit: trail the stop with a shorter channel, such as the 10-candle low, and exit on a close below it. Price rose 35 pips over the next 15 candles. Marker 2 shows the move still running at 18:00, near 1.15853. The chart does not show an exit, so the trade stays open until a candle closes below the 10-candle low.
By 18:00, 8 candles later, price was already 1.15853 − 1.15508 = 0.00345, about 35 pips above the signal close. The tight stop sat 1.15508 − 1.15454 = 0.00054 below the entry, about 5 pips plus your buffer. The trade-off: a stop that close gets hit more often by a normal pullback to the broken line.
Donchian Channel turtle trading rules
The channel is named after Richard Donchian, an early trend-following fund manager. It became widely known through the "Turtle" traders of the 1980s, who used it as the core of a full trading system on daily charts:
- System 1: enter on a 20-day breakout, exit on a 10-day breakout in the opposite direction.
- System 2: enter on a 55-day breakout, exit on a 20-day opposite breakout.
The Turtles set stops from the market's recent average daily range and sized every position so that each trade risked a small, fixed slice of the account. You can copy that habit even if you trade other timeframes.
Choosing a Donchian period for your trading style
| Trading style | Chart | Entry channel | Exit channel |
|---|---|---|---|
| Day and swing trading | 15-minute to daily | 20 | 10 |
| Position trading | Daily | 55 | 20 |
The period counts candles, not hours, so the same 20/10 pair fits both day and swing trading. Changing the chart timeframe is what changes how much time the channel covers.
Gold usually swings more than major pairs like EURUSD in the same time. Its channels are wider, so stops based on the channel are further away. Keep the same period, but trade a smaller size on gold, so the money at risk stays the same.
Whatever period you pick, size each trade from the stop distance. Here is an illustrative example. You have a $10,000 account and you risk 1%. You buy EURUSD on a breakout and put the stop on the middle line, 50 pips below your entry. On EURUSD, one standard lot of 100,000 units is worth $10 per pip.
Filtering Donchian breakouts with ATR
Average True Range (ATR) measures the average size of a candle over a set number of candles. It pairs well with the Donchian Channel, because it tells you whether a breakout is ordinary or stretched.
Use two rules:
- If the breakout candle's range is more than about twice the ATR, the move may already be spent and your stop is far away. Skip the trade, or wait for a pullback toward the broken line.
- If the channel width is under about 3 ATR (an illustrative threshold) and has been flat for a while, treat the next close outside it as a squeeze breakout. Place your stop about 2 ATR from your entry instead of at the far side of a narrow channel.
When the Donchian Channel works and when to avoid it
Works well:
- Markets that trend for days or weeks after a news shock or a central bank shift
- Breakouts after a long, narrow, flat channel
- Higher timeframes, where one stray wick matters less
Avoid it:
- Sideways markets that bounce between the lines, where each breakout reverses
- The minutes around major news, when spikes set new highs and lows that do not hold
- Thin trading hours, when a single wick can move the line
Donchian Channel pros and cons
| Pros | Cons |
|---|---|
| Simple rule: a close is either outside the channel or it is not | Many false breakouts in ranging markets |
| Gives entry, stop and exit levels from one tool | Trend-following exits give back part of the profit |
| Channel width shows volatility at a glance | Lines jump when a single wick sets a new extreme |
| Works on any market and any timeframe | Long losing streaks between big trends test your discipline |
Donchian Channel vs Bollinger Bands
Both draw bands around price, so traders often mix them up. Bollinger Bands are a moving average plus and minus standard deviations, so they curve, and price often closes outside them. Donchian lines mark the actual highest high and lowest low, so a close outside always means a new extreme for the period. A close outside a Bollinger Band means price has stretched. A close outside a Donchian Channel means price has broken out.
Practical tips for Donchian Channel trading
- Expect several small losses in a row in sideways markets, and size each trade so a run of them is survivable.
- Look one timeframe higher. A 1-hour breakout in the direction of the daily trend deserves more trust than one against it.
Quick checklist:
- Has a candle closed beyond the prior upper or lower line?
- Is the breakout candle no bigger than about twice the ATR?
- Is the stop set, with the lot size calculated from its distance?
- Do you know your exit line, such as the shorter opposite channel?
FAQ
Can I use the Donchian Channel for take-profit targets?
Not directly, because in a breakout trade price is already outside the channel. Most traders do not set a fixed target. They trail the stop with a shorter channel or the middle line and let the market decide when the trade ends.
Should I enter on the close or on a stop order above the line?
A buy stop order above the upper line fills as soon as price trades there, even on a wick that later closes back inside the channel. That is the false signal from the wick chart above. Entering after the close is slower and can cost you a worse price, but you only act on breakouts that actually closed outside the channel.