









Chandelier exit
Also called Chandelier stop, Chandelier exit indicator, Chandelier trailing stop, CE
The Chandelier exit is a trailing stop placed a set number of ATRs below the highest high of recent candles (above the lowest low for a short). It moves up with the trend and closes the trade when price falls back by more than normal volatility.
The hardest decision in a trade is often when to get out of a winner, not when to get in. If your stop is too tight, normal noise knocks you out. If it never moves, you can give back the whole gain. The Chandelier exit sets the gap from how much the market is actually moving, and in its usual ratcheted form it only ever tightens. That is why traders use it to protect open profit.
How the Chandelier exit is calculated
For a buy trade the formula is: long stop = highest high of the last N candles − (multiplier × ATR). ATR (Average True Range) is the average size of a candle's full range, gaps included. The most common textbook setting is 22 candles and a multiplier of 3, and the example on this page uses exactly that.
For a sell trade: short stop = lowest low of the last N candles + (multiplier × ATR).
The stop hangs from the highest point of the move, like a chandelier from a ceiling. As price makes new highs, the anchor rises and the stop follows it up. The stop rises when price makes a new high or when ATR shrinks. With a ratchet it never falls.
The raw formula has one trap. The stop can slip lower when an old high drops out of the 22-candle window, or when ATR grows after a volatile candle. That is why many versions add the ratchet: each new value is used only if it is higher than the current stop. The drawing below shows the ratcheted version.
Checklist: drawing a Chandelier stop correctly
- Choose the lookback, for example 22 candles, on the timeframe you trade.
- Find the highest high of those candles. Use closed candles only.
- Work out ATR over the same number of candles.
- Multiply ATR by your multiplier, for example 3.
- Subtract that buffer from the highest high. The result is your stop.
- On each new closed candle, recalculate. Move the stop up if the new value is higher. Leave it where it is if the new value is lower.
- Close the trade when price trades through the stop. A real stop order at that price is the cleanest way to do it.
What makes a Chandelier stop valid, weak or broken
A valid Chandelier stop sits under a market that is making higher highs, uses closed candles, and only moves in your favour. In that case each step up locks in more of the move.
A weak one is technically correct but standing on bad ground. In a sideways range the highest high stops rising, but the stop does not have to stand still. As volatility contracts, ATR shrinks, the buffer gets smaller and the stop creeps up toward the range low. That is often what takes you out: a drop just below the range low reaches a stop that has climbed to meet it, when the earlier, lower stop would have survived it. A news spike that inflates ATR cannot lower a ratcheted stop, but it can freeze it: the stop stays flat for several candles while price keeps climbing.
A broken one has lost its logic. The usual causes:
- Lowering the stop to give a losing trade "more room".
- Using a lookback so short (a handful of candles) that the stop tracks every wiggle and stops being a volatility stop at all.
A common misread is treating the line as support. It is not a level the market respects. It is your exit, set by your own settings.
Reading the EURUSD example: the stop locked in 46 pips
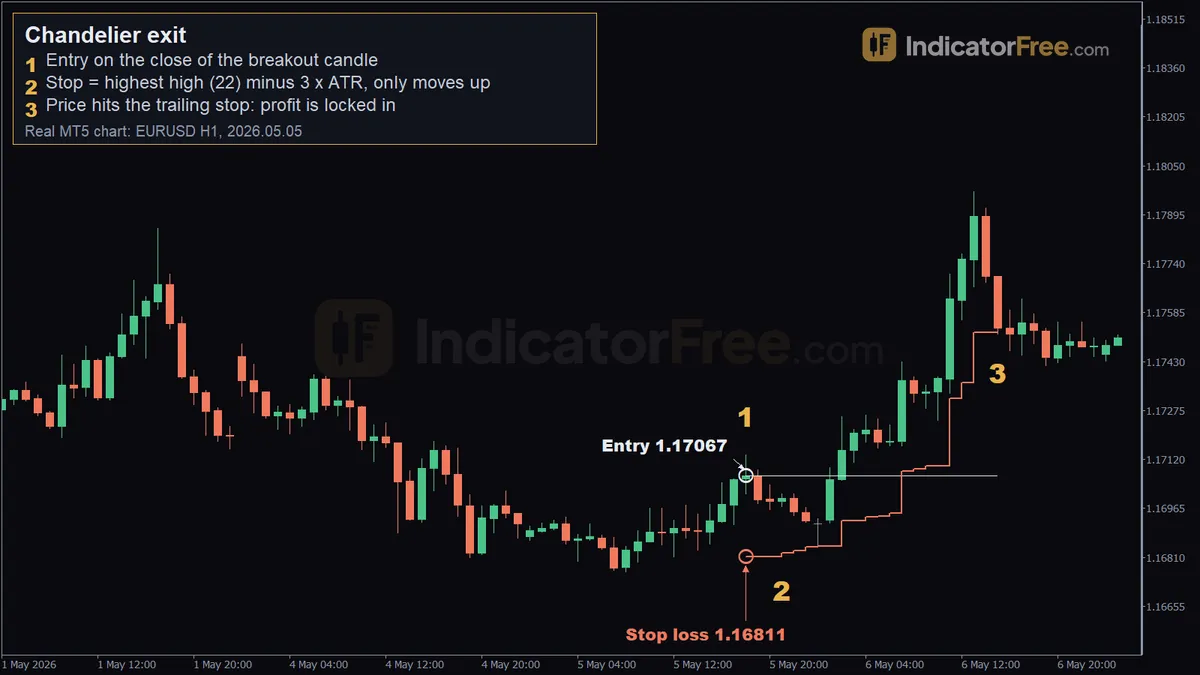
The chart at the top of the page is a past trade on EURUSD on the 1-hour chart. It is not a prediction. The stop used the highest high of 22 candles minus 3 ATR.
Marker 1, the entry. The breakout candle closed at 18:00 on 5 May 2026. The marker sits on the breakout candle. The recorded entry price was 1.17067, and every number below uses it. The first Chandelier stop was at 1.16811. That puts the starting risk at 1.17067 − 1.16811 = 25.6 pips.
Marker 2, the stop moving up. By 21:00 the same evening, the stop had climbed to 1.16823. It only moved up, never down.
Marker 3, the exit. At 15:00 on 6 May 2026, price fell back to the trailing stop at 1.17523 and the trade closed. Profit: 1.17523 − 1.17067 = 45.6 pips, rounded to 46. That is about 1.8 times the starting risk (45.6 ÷ 25.6).
Notice the price you pay for this. The exit came after the top, not at it. A Chandelier exit always gives back the gap between the high and the stop. That gap is what keeps you in the trade during normal pullbacks.
Trading setups that use the Chandelier exit
Trailing a breakout trade
This is the setup in the example. You enter on the close of a breakout candle, set the first stop at the Chandelier value, then let the stop do the managing. You don't need a fixed target. The trend runs until a pullback bigger than 3 ATR ends it.
If you also want a target, use a partial exit. Take half off at a fixed multiple of your starting risk, and trail the rest with the Chandelier stop.
Using the line as a trend filter
Plot both the long stop (below price) and the short stop (above price). Stay long while candles close above the long stop. When a candle closes below it, close the long. Only then may you go short, with the short stop as your exit. Stay short until a candle closes above the short stop. You are always on one side, and the side changes only when a candle closes through the stop of the trade you hold. This version waits for a close, not a touch. See the tip on touch vs close.
The drawing below shows both lines and the single flip from buying to selling.
Sizing the position from the first stop
The Chandelier stop gives you a stop distance before you enter. That means you can set your lot size from it. Here is an illustrative example on a USD-quoted pair, where 1 standard lot (100,000 units) is worth $10 per pip. The highest high is 20 pips above your entry, ATR is 20 pips, and you want to risk $100.
When ATR is large, the stop sits farther away and the same $100 risk buys a smaller position. That is the point: the size of your loss stays the same in money even when volatility changes.
When the Chandelier exit works and when to switch it off
It works best in clean trends with steady volatility, where pullbacks stay smaller than 3 ATR. It also suits traders who can't watch every candle, because the rule decides the exit for you.
Skip it in tight ranges. Before major news or in thin market hours, either stay out or choose a bigger multiplier before you enter.
| Pros | Cons |
|---|---|
| Stop distance comes from the market's volatility, not a guess | Always exits after the top, so you give back part of the move |
| Only tightens, so open profit is locked in step by step | Gets hit repeatedly in sideways markets |
| Gives a stop distance before entry, so you can size the position | After a volatility spike the stop can stay frozen while price rises |
| One rule for every pair and timeframe |
Practical tips for Chandelier stops
- Decide in advance whether the exit is a touch or a candle close, and write it down. A stop order means touch. A close rule gives fewer false exits but more slippage on fast drops.
- Test the multiplier on your own pair and timeframe before you change it. Going below 3 ATR tightens the stop sharply. Going above it makes you sit through deeper pullbacks.
- Keep the lookback and the ATR period the same, unless you have a tested reason to split them.
- If ATR has jumped after news, expect the stop to stay flat for a while. Don't read that as the trend failing.
- Write down the exact settings for every trade. A 22/3 stop and a 10/2 stop are different strategies.
FAQ
What Chandelier exit settings should I use on a 15-minute chart?
Start with the same 22 and 3. These settings count candles, so they adjust to any timeframe on their own. Shorter charts are noisier, so check on past charts how often a 3 ATR stop got hit by ordinary pullbacks before you change the multiplier in either direction.
Can I use the Chandelier exit on gold, indices or crypto?
Yes. The formula only needs highs, lows and ATR, so it works on any market. Faster-moving markets just produce wider stops in price terms, which a smaller position size makes up for.
Where do I put the first Chandelier stop if the breakout candle is the highest high?
Use that candle's high as the anchor and subtract 3 ATR from it, as usual. You buy at the close, which sits below the high, so your real risk from entry is less than 3 ATR. The longer the candle's upper wick, the closer the first stop sits to your entry. Measure the stop distance from your entry price, not from the high, before you size the trade.