









Inside bar pattern
Also called Inside bar, Inside candle, Inside day, IB
An inside bar pattern is a two-candle pattern where the second candle's high and low both stay within the range of the candle before it, which shows the market pausing before its next move.
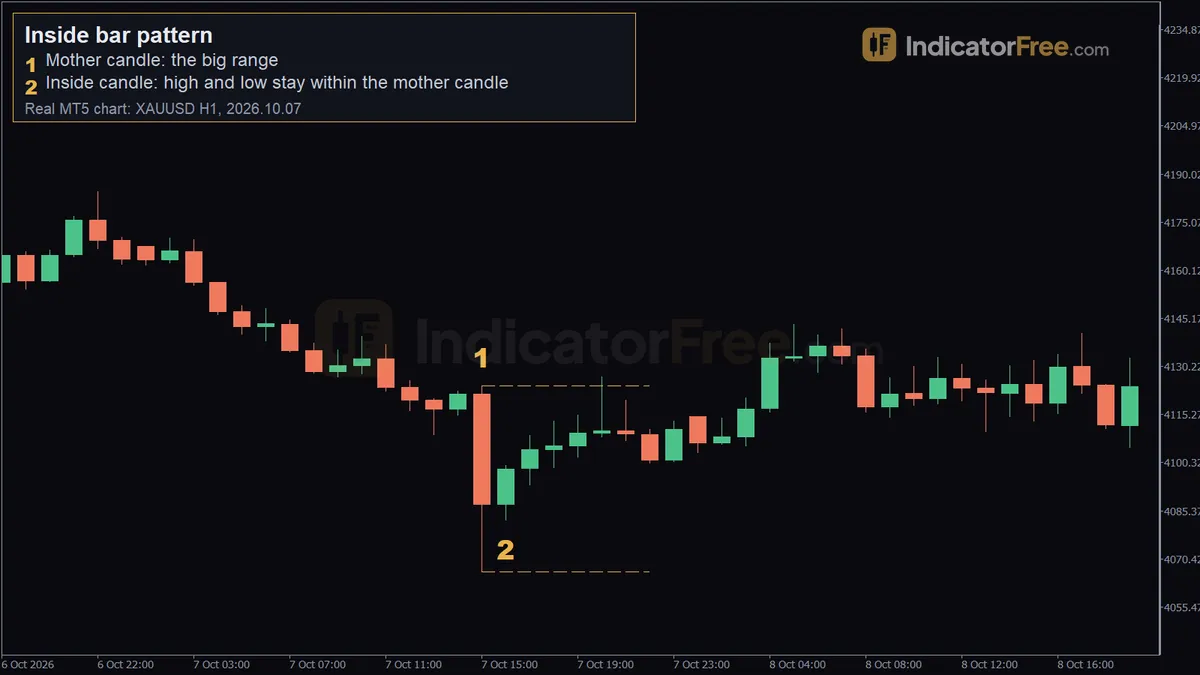
An inside bar does not tell you which way price will go. Its value is that it shows you where to act and where you are wrong before you risk anything. That gives you a small, defined stop on one side and a clear trigger on the other.
How to spot an inside bar: a 5-point checklist
- Find the mother bar, which is the candle right before the pattern. It should be clearly larger than the few candles around it.
- Check that the next candle's high is at or below the mother bar's high.
- Check that its low is at or above the mother bar's low.
- Measure with the wicks, not only the bodies. If only the body fits inside the mother bar, it fails this checklist.
- Note where it sits: the trend direction, the nearest support or resistance, whether a news release is coming, and whether there is room for a target at least as far away as your stop.
What makes an inside bar weak or broken
A strong inside bar shows real compression: a wide mother bar followed by a much smaller candle. The tighter the squeeze, the closer your stop can sit to your entry.
Here is a decision rule you can copy. Divide the inside bar's range by the mother bar's range. Under one half is a tight squeeze. One half to two-thirds is acceptable. Above two-thirds, there is almost no compression, so skip it.
An inside bar is weak when the mother bar is just an ordinary candle, when both candles sit in the middle of a sideways range, or when a big news release is due within the next candle or two. On very short charts, like the 1-minute, the spread can take up a large part of the candle's range, so the pattern means little there.
The pattern is broken when price breaks out of the inside bar but the breakout candle closes back inside the inside bar's range. That failed breakout is often called a fakey. It traps the traders who bought or sold the break, and it can become a setup of its own (see Setup 2 below).
Reading the EURUSD 1-hour example at the top of the page
The chart at the top shows a past EURUSD 1-hour example, not a prediction. The inside bar is the candle of 2026.09.30 16:00: open 1.13640, high 1.13677, low 1.13542, close 1.13557.
Marker 1 sits at 1.13542, the candle's low. It shows that the whole candle, wicks included, stayed inside the candle before it. Even its lowest point never left the mother bar's range.
Now measure the candle the way you would before trading it:
- Range: 1.13677 − 1.13542 = 0.00135, or 13.5 pips.
- Body: 1.13640 − 1.13557 = 0.00083, an 8.3-pip bearish body.
- Upper wick: 1.13677 − 1.13640 = 3.7 pips. Lower wick: 1.13557 − 1.13542 = 1.5 pips.
The close came only 1.5 pips above the low, so sellers had the last word during the pause. That is a hint, not a signal. The trade triggers only when price leaves the range: below 1.13542 for a sell, or above 1.13677 for a buy. Either way, the candle's own range gives you a 13.5-pip stop distance before you add any buffer.
Trading the inside bar breakout: two setups
Both setups use the real candle from the top of the page: high 1.13677, low 1.13542, a 13.5-pip range. It is a past example, so treat the levels as practice, not a forecast.
The chart below is an illustrative sketch of the same idea in an uptrend. Its mother bar spans 50 pips and the inside bar 21 pips, which is 42% of the mother bar, a tight squeeze under the rule above. It shows the breakout order just above the inside bar, the stop just below it, and a target at twice the risk.
Setup 1: breakout of the inside bar's range
The example candle alone does not tell you the direction. Take it from your own read of the trend or of a level you had already marked.
- Entry: a buy stop at 1.13677, the inside bar's high, if the trend points up. In a downtrend, a sell stop at 1.13542, its low. The order fills only if price leaves the squeeze.
- Stop loss: the opposite edge of the inside bar: 1.13542 for the buy, 1.13677 for the sell. Risk = 1.13677 − 1.13542 = 13.5 pips. Add a small buffer for the spread if you like.
- Target: twice the risk. 2 × 13.5 = 27 pips from your entry.
If the mother bar's edge sits close beyond your entry, expect some selling or buying there. If price breaks the other side before your order fills, cancel it. Do the same if nothing triggers within about three candles.
To size the trade, here is an illustrative example: a $10,000 account risking 1%.
Setup 2: the failed break (fakey)
Now suppose the candle after the inside bar spikes above 1.13677, then closes back inside the inside bar's range, below 1.13677. The buyers who chased the break are now stuck in a losing trade.
- Entry: sell at that candle's close.
- Stop loss: just above the spike high.
- Target: first the inside bar's low at 1.13542, then the mother bar's low.
Take this setup only when the failed break happens at clear resistance. If the first target is closer than your stop, skip it.
When inside bars work and when to skip them
Inside bars do best right after a strong move in a clear trend, where the pause is just the market catching its breath. They also do well at a level you had already marked, on 4-hour or daily charts, during active trading hours.
Also skip them during quiet hours, outside the main trading sessions.
| Pros | Cons | |
|---|---|---|
| Risk | Stop is small and defined before entry | A tight stop gets hit by normal noise |
| Clarity | Easy to spot with fixed rules | Common enough that many are low quality |
| Timing | Pending order triggers on its own | False breakouts happen often |
| Flexibility | Works on any market and timeframe | Needs context to choose a direction |
Bullish and bearish inside bars
A bullish inside bar forms in an uptrend or at support. You trade a break above its high. A bearish inside bar forms in a downtrend or at resistance. You trade a break below its low.
The candle's colour does not set the direction; the context does. The reverse shape, where the second candle swallows the first, is the engulfing pattern.
Practical tips for trading inside bars
- Mark the mother bar's high and low as well as the inside bar's. The mother bar's edges are the first hurdles after the breakout.
- Use the mother bar for your stop when the inside bar is so small that ordinary noise would reach it.
- Place orders on both sides only if you have no directional bias, and cancel the unfilled side as soon as one fills.
- Record every inside bar trade with its range ratio. After a few dozen, you will see which ratios worked for you.
- Read the daily chart first. An inside bar against the daily trend needs a stronger reason to take.
FAQ
Should I enter as soon as price touches the high, or wait for a candle to close beyond it?
A stop order on the touch gets you in early with the smallest stop, but it fills on false breaks too. Waiting for a close filters some false breaks, but your entry sits further from the stop, so your position must be smaller.
What do I do when two or three inside bars form in a row?
Keep the first mother bar as the outer frame. Use the last, smallest inside bar for your trigger and stop. That gives you a tighter trigger and stop.
Where do I put my stop if the mother bar is huge?
Put it beyond the inside bar's opposite edge, not the mother bar's. That keeps the stop small. If even that distance makes your position size too small to be worth it, skip the trade.