









Range expansion
Also called Expanding range, Range extension, Wide-range bar, WRB
Range expansion is when candles suddenly get clearly bigger than their recent average, so price covers more distance per bar. It usually follows a quiet, narrow phase and marks the market switching from rest to active movement.
Range expansion matters because it changes the size of everything on your chart. A stop that was safe while candles moved 9 pips can be hit by ordinary noise once they move 14. A breakout with no expansion behind it is often a trap.
How to identify range expansion: a 6-point checklist
You need one measuring tool. Average True Range (ATR) is the average size of recent candles, gaps included. Most traders use the last 14 candles, written ATR(14).
- Find the quiet phase first. Look for a run of small candles, a flat or falling ATR, and price boxed between a clear high and low.
- Measure the new candle against normal. Divide its high-to-low range by the ATR(14) value just before it. A ratio of 1.5 or more counts as expansion. A ratio of 2 or more is strong.
- Check where it closes. The candle should close near its extreme, in the outer quarter of its range. A big candle that closes in the middle is not expansion.
- Check that it leaves the quiet box. The close should be beyond the high or low of the quiet phase, not just poke through with a wick.
- Look for follow-through. The next one or two candles should also be bigger than the quiet ones, and ATR should start to turn up.
- Compare with the session's normal size. A candle can look huge next to the night before and still be ordinary for the time of day. The next section shows how to check.
Real expansion vs a weak or broken one
A valid range expansion has a wide body, a close near the extreme and price staying outside the old box. It says one side took control and the other did not fight back.
A weak one has long wicks on both ends, or a close back near the middle of the candle. Buyers and sellers both pushed hard, and neither won. Treat it as noise, not a signal.
A broken one closes back inside the quiet box within a few candles. Traders who bought or sold the breakout are now trapped. Their stops often fuel a move the other way, so a failed expansion is a reason to step aside or think about the opposite side, not to add.
The most common misread is session timing. On EURUSD 1-hour, the IndicatorFree Lab measured the average candle range by session from 2025-10-02 to 2026-10-02 (6,222 candles of broker demo data, server time; past data, not a forecast). The chart below shows how much candle size changes by time of day alone.
The rule: if a candle is big only compared with the Asian hours but normal for the overlap, it is not expansion. It is the clock. Gold behaves differently. On XAUUSD 1-hour over the same period, Asian-hour candles averaged 21.3 $, slightly larger than London morning at 18.9 $, while the overlap averaged 30.9 $. Check the pair you trade. Do not assume.
Reading the EURUSD 1-hour expansion of June 2026
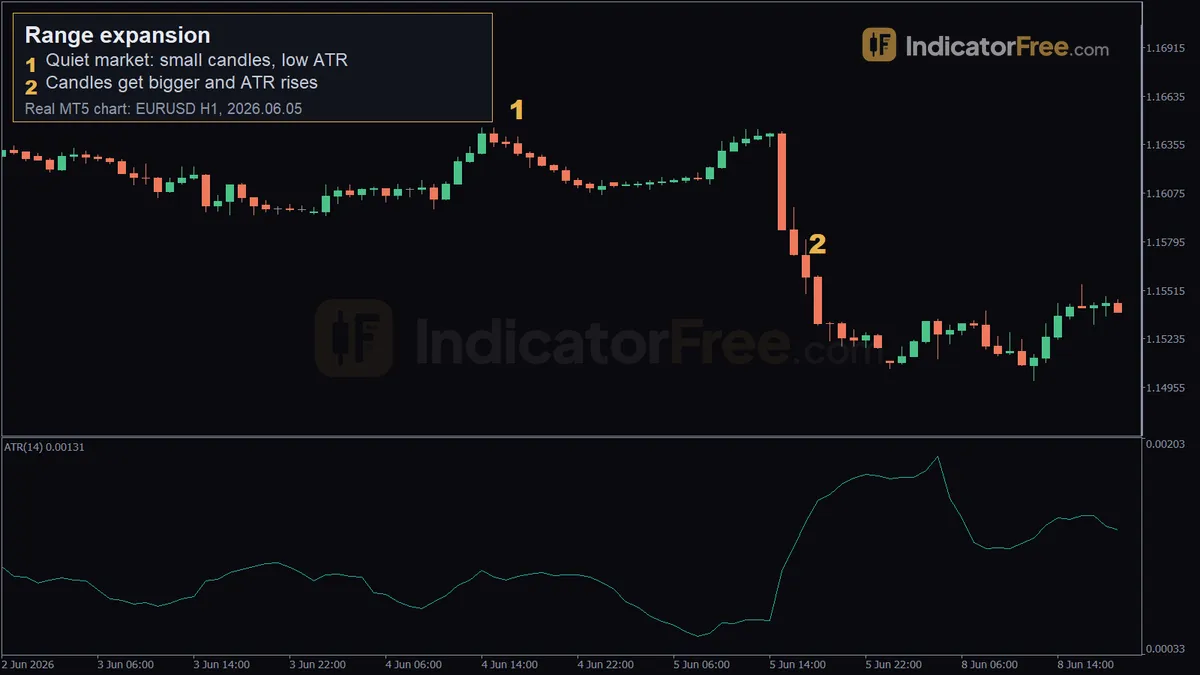
The chart at the top of this page is a past EURUSD 1-hour example, not a prediction.
Marker 1 (2026.06.04 17:00, 1.16399): the quiet phase. Candles are small and ATR(14) averaged about 9 pips. That is below the Lab's EURUSD 1-hour median of 10.9 pips, so the market was quieter than it was on half of the candles in the measured year.
Marker 2 (2026.06.05 18:00, 1.156): the expansion. Candles grow and ATR rises to 14 pips. Price is now about 80 pips below marker 1 (1.16399 minus 1.156), so this expansion ran to the downside.
Two details make this a useful lesson. First, 14 pips sits between the median (10.9) and the top-10% level (16.2 pips), so it was clearly active but not yet extreme. Second, 18:00 falls in the overlap window, where big candles are normal. What confirms a real shift is not one large candle. It is ATR climbing over many candles.
Two ways to trade a range expansion
The chart below is an illustrative example on a EURUSD-style chart, not real quotes. Eight quiet candles stay inside a 12-pip box, each 8 to 9 pips tall. Then one candle runs 28 pips from low to high and closes 3 pips below its high. The chart shows both setups.
Setup 1: enter on the close of the expansion candle
- Entry: buy at the close of the expansion candle.
- Stop loss: 2 pips below the expansion candle's low. Risk is 27 pips.
- Target: add the candle's 28-pip range to its close, shown as the target line.
Reward roughly equals risk here. The benefit is that you never miss the move. The cost is a worse price. In this example the target is reached only on the last candle, after a pullback that came within 15 pips of the stop.
Setup 2: buy the pullback to the middle of the expansion candle
- Entry: limit buy at the candle's midpoint, half of its 28-pip range (14 pips) below its high.
- Stop loss: the same level as setup 1, 2 pips below the expansion candle's low. Risk is 16 pips.
- Target: the same target line. Reward is 39 pips, about 2.4 times the risk.
The first pullback candle stops 2 pips short of the entry and misses. The next one dips 1 pip below it and fills. That is the trade-off: better reward for the risk, but in strong moves the order often never fills. Cancel it if any candle closes back inside the quiet box, below its top.
The calculation below checks the expansion ratio and sizes setup 2 for a $10,000 account risking 1%. It assumes ATR(14) was 10 pips before the big candle and uses the standard $10 per pip for 1.00 lot (100,000 units) of EURUSD.
A ratio of 2.8 passes the checklist's "strong" bar of 2. Always round lots down, never up.
When range expansion works and when to skip it
It tends to be most readable after a long quiet phase, when ATR has been below its usual level. It also reads well at session handovers and when it points the same way as the trend on a higher timeframe.
Skip it when ATR is already stretched, because you are probably late. In the Lab's past data (2025-10-02 to 2026-10-02; not a forecast), the top 10% of ATR(14) readings started above 16.2 pips on EURUSD 1-hour, 32.9 pips on EURUSD 4-hour, 32 $ on XAUUSD 1-hour and 67.9 $ on XAUUSD 4-hour. Also skip the minutes around scheduled news, when one spike can expand and fully reverse inside a single candle.
| Pros | Cons |
|---|---|
| Uses only candle size, so it works on any market and timeframe | Wider candles mean wider stops and smaller positions |
| Gives a clear invalidation level (back inside the box) | Many expansions fail and close back inside the range |
| Warns you to resize stops before noise hits them | Easy to confuse with the normal busy-session candle size |
| Pairs with any entry method you already use | Entering on the close often means a poor price |
Bullish and bearish range expansion
Bullish range expansion is a wide candle closing near its high and above the quiet box. It favours buy setups like the two above.
Bearish range expansion is the mirror: a wide candle closing near its low, below the box, like the June 2026 EURUSD example. The quiet phase that comes before it is covered in the volatility contraction entry. The indicator-based view of the same shift is covered under volatility expansion and Average True Range.
Practical tips for trading range expansion
- Write down the ATR value before the big candle. The ratio, not your eyes, decides whether it counts.
- Resize your stop the moment ATR rises. A stop sized for 9-pip candles is too tight for 14-pip candles.
- Cut your lot size when you widen a stop, so the money at risk stays the same.
- Judge the candle against its own session's normal size, not against the quiet night before.
- After a failed expansion, wait for a new quiet phase before trying again.
Quick checklist:
- Quiet box first, then a candle at least 1.5 times ATR(14).
- Close in the outer quarter of the candle, beyond the box.
- Bigger than normal for this session, not just bigger than last night.
- Stop beyond the expansion candle, lots resized to your fixed risk.
FAQ
How is range expansion different from range trading?
Range trading means buying near the bottom of a sideways box and selling near the top. Range expansion is usually what ends that box. If you range trade, a candle 1.5 times ATR that closes outside your box is a signal to exit, not to fade it.
What is the Range Expansion Index?
It is an oscillator, separate from the price concept here. It compares each candle's high and low with those of two candles earlier and swings above and below zero. You can use it as a second opinion, but the candle-size checks above work on any chart without it.
Does range expansion work on the 4-hour chart?
Yes, the same ratio rule applies. Only the numbers scale. On EURUSD 4-hour, the Lab measured an average ATR(14) of 24.1 pips, with half the candles below 22.7 pips (2025-10-02 to 2026-10-02, 1,556 candles; past data, not a forecast). Expansion on a higher timeframe covers more ground, so expect wider stops and fewer signals.