Distribution Zone Finder
Distribution Zone Finder is a free MT5 indicator. 0 of 2 signals changed in our repaint test. Free download, 24 inputs.
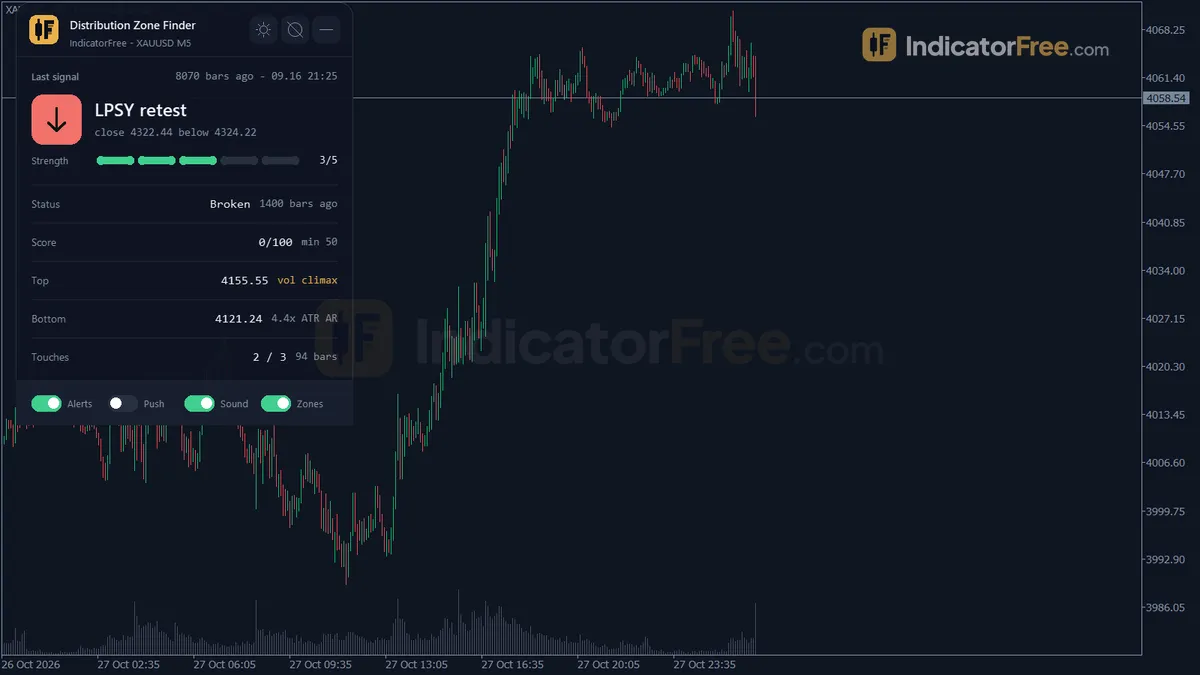
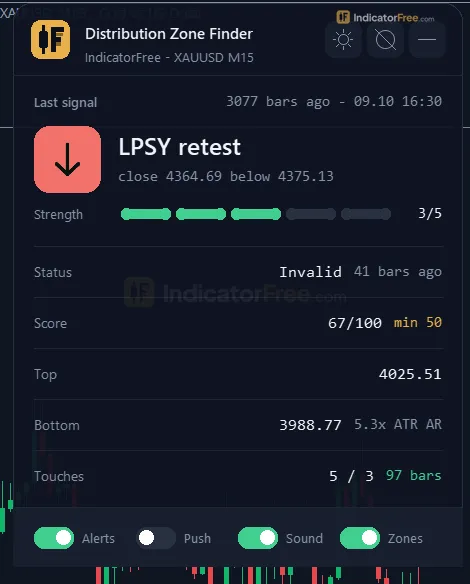
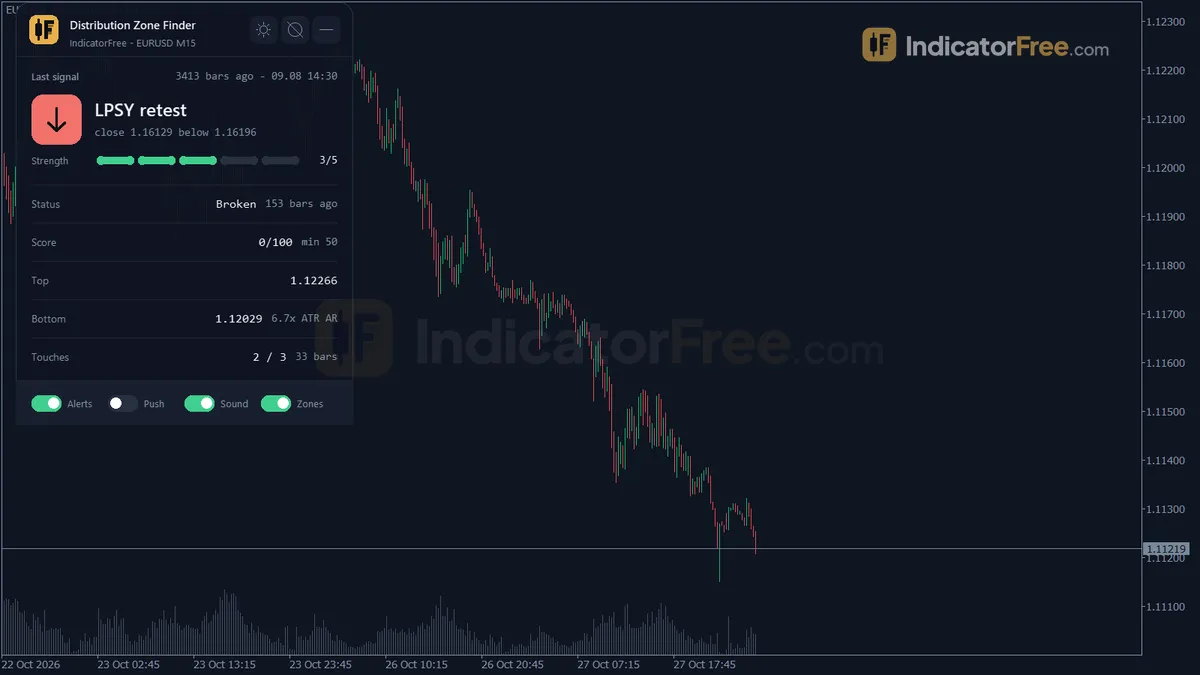
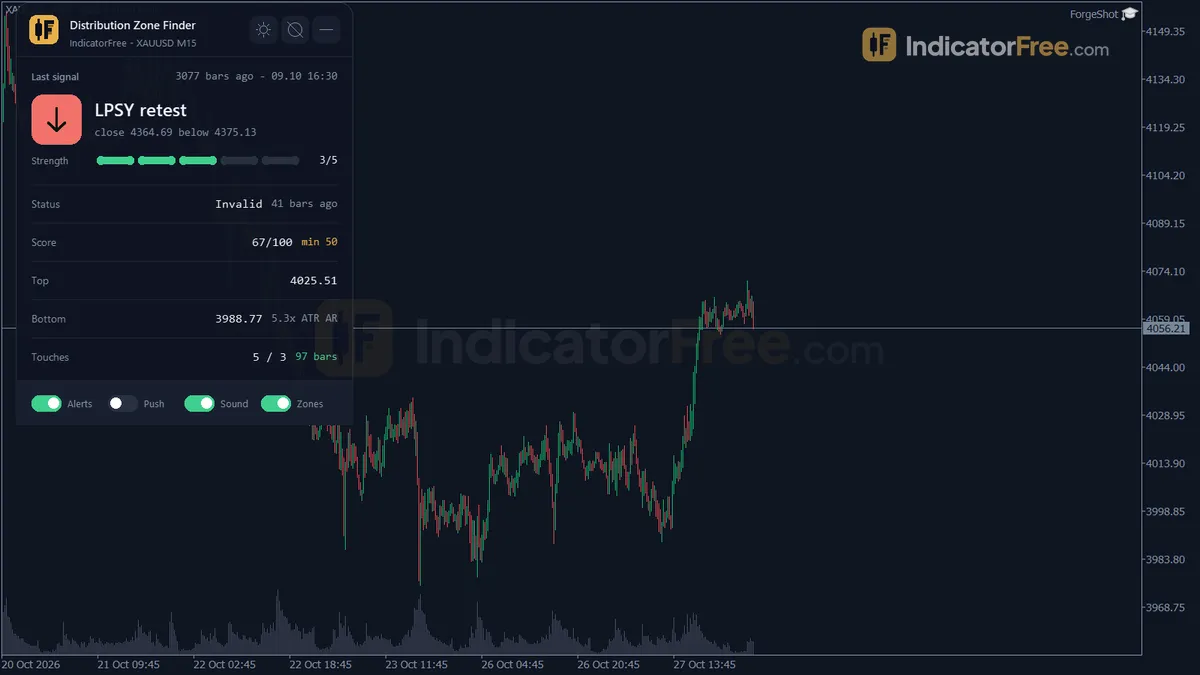
- Repainted
- 0 / 2
- Signals / week
- ≈ 0.2
- Tested on
- EURUSD M15
- Tested
- 2026-10-09
Overview
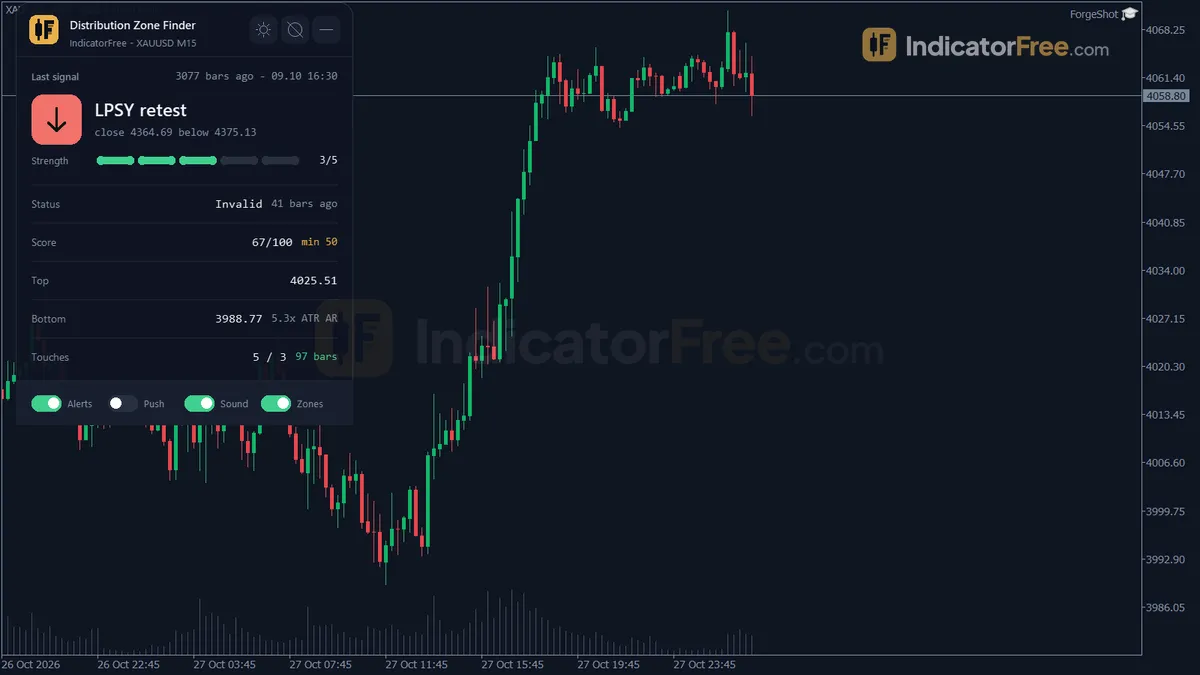
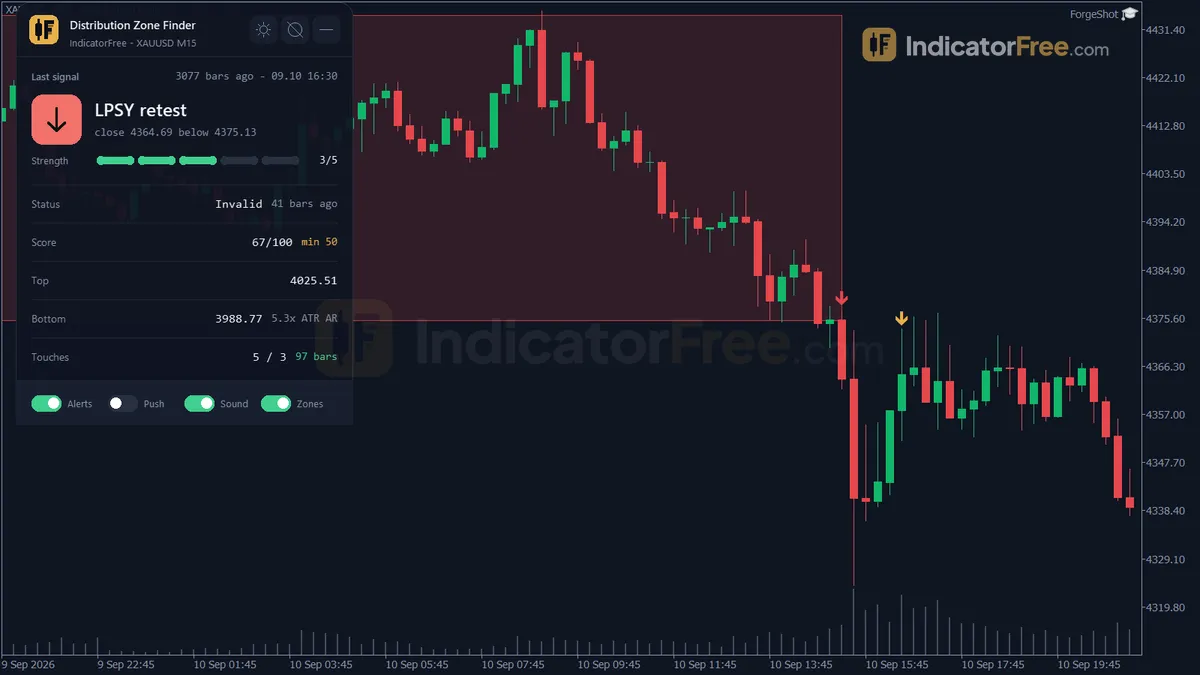
Free for MT5, Distribution Zone Finder draws distribution breakdown and LPSY retest arrows, distribution zones and an on-chart panel on the main price chart. When a Distribution Breakdown arrow prints, it can send pop-up, push and sound alerts. We logged 2 of its signals at bar close on EURUSD M15 and re-read them after the test: none had changed. Start with MinScoreToSignal, default 50 — minimum Distribution Score (0-100) for a breakdown signal.
How it works
- 1Finds swing highs and swing lows using the swing length on each side, and keeps ATR and cumulative volume.
Swing High: High above SwingLength bars on both sidesInputs: SwingLength, ATRPeriod - 2After a new swing high, tries to start a zone with a top and bottom, extended until expiry.
Zone ends after MaxZoneBars barsInputs: MaxZoneBars, TrendMinATRMult, VolumeClimaxMult, ClimaxVolumeLookback - 3A zone qualifies when its height, touches and length are large enough and most closes stay inside the range.
Height >= MinRangeATRMult x ATR | touches >= MinTouches | bars >= MinRangeBarsInputs: MinRangeATRMult, MinTouches, MinRangeBars, ToleranceATRMult - 4Scores the zone 0 to 100 from low volume on top tests, upthrusts, weakness and rejection at the top.
Score = 25 x volume + 25 x upthrust + 25 x weakness + 25 x rejection partsInputs: MinScoreToSignal - 5Signals a breakdown on a close below the bottom with enough volume and score, then watches for retest or failure.
Breakdown volume >= VolumeBreakdownMult x average volume since zone startInputs: VolumeBreakdownMult, RetestWindowBars, MaxConfirmedZones
Specifications
- Platform
- MetaTrader 5
- Version
- 1.30
- Type
- Indicator
- Window
- Main chart
- Draws
- 2 arrows, 2 zones, 1 panel
- Alerts
- popup, push, sound
- Repaints
- No (0 of 2 signals changed)
- Inputs
- 24
- Tested on
- MT5 build 6230 · 2026-10-09
Repaint test
No repaint detected. In a 9 Jul 2026 – 8 Oct 2026 test on EURUSD M15 (Raw Trading Ltd real ticks), 2 signals were logged at bar close and re-read at the end of the test: 0 changed. Arrows print on the bar that closes the signal, with no delay.
IndicatorFree — tested 2026-10-09 · MT5 build 6230 · Raw Trading Ltd real ticks. Results come from historical data, not live trading, and do not guarantee future results.
Signal statistics
Over 9 Jul 2026 – 8 Oct 2026 on EURUSD M15, the indicator printed 2 arrows. After 100% of them, price moved 1×ATR(14) in the arrow's direction before moving 1×ATR against it (median 1 bars). 0% reached neither level within 20 bars.
This measures price movement after the arrow, not a trading result. It includes no spread, commission, stop loss or position sizing.
Small sample — not enough to draw a conclusion.
What it draws
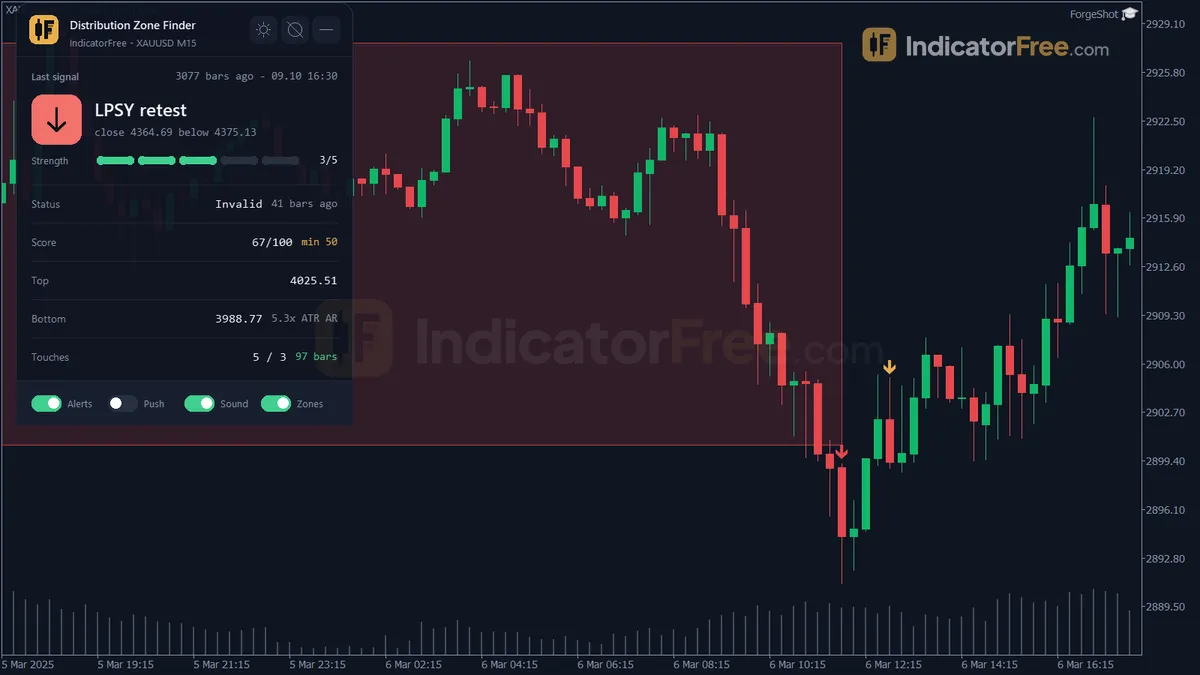
- Arrows (Distribution Breakdown) from buffer 0, drawn on the closed bar.
- Arrows (LPSY Retest) from buffer 1, drawn on the closed bar.
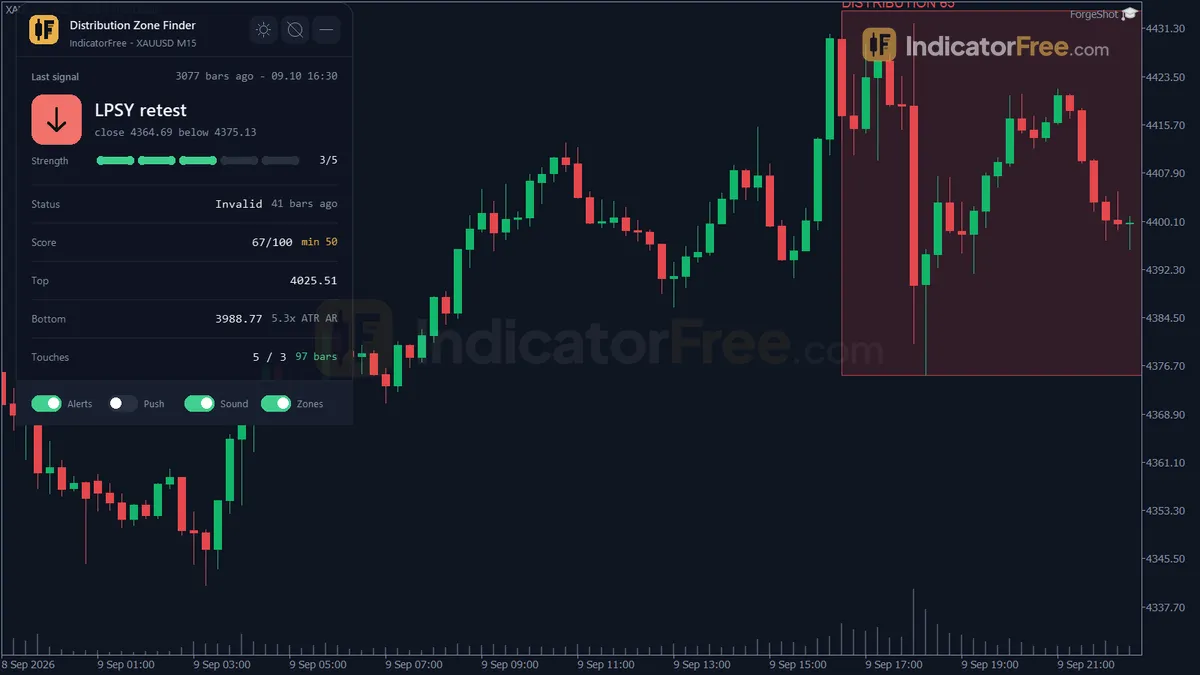
- Rectangles (Distribution Zone) drawn as chart objects, not buffers — they are not readable by iCustom() in an EA.
- Rectangles (Zone Score Tag) drawn as chart objects, not buffers — they are not readable by iCustom() in an EA.
- An on-chart panel (Distribution Score); values shown in the panel are not exposed as buffers.
Inputs
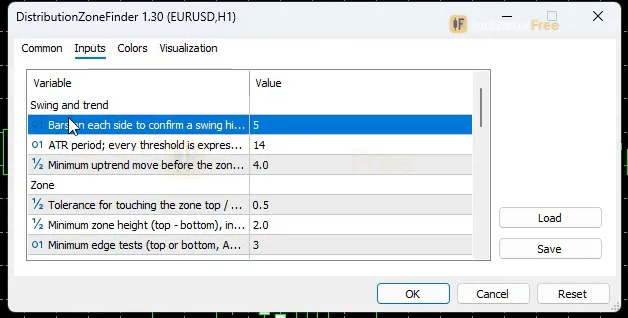
| Input | Default | What it does |
|---|---|---|
| SwingLength | 5 | Bars on each side to confirm a swing high / low (confirmation delay) |
| ATRPeriod | 14 | ATR period; every threshold is expressed in ATR |
| TrendMinATRMult | 4 | Minimum uptrend move before the zone, in ATR (climax top minus first swing low) |
| ToleranceATRMult | 0.5 | Tolerance for touching the zone top / bottom, in ATR |
| MinRangeATRMult | 2 | Minimum zone height (top - bottom), in ATR |
| MinTouches | 3 | Minimum edge tests (top or bottom, AR included) for the zone to be valid |
| MinRangeBars | 15 | Minimum bars since the Climax for the zone to be valid |
| VolumeClimaxMult | 1.5 | Climax tick volume vs its average to mark a volume climax (shown on the panel) |
| ClimaxVolumeLookback | 20 | Bars before the Climax used for the average tick volume |
| MaxZoneBars | 300 | A forming zone without breakdown is removed after this many bars (0 = never) |
| VolumeBreakdownMult | 1.2 | Breakdown bar tick volume vs zone average tick volume (0 = no volume filter) |
| MinScoreToSignal | 50 | Minimum Distribution Score (0-100) for a breakdown signal |
| EnableRetestAlert | true | Detect and alert the LPSY retest after a breakdown |
| RetestWindowBars | 20 | Bars after the breakdown watched for the LPSY retest or a failed breakdown |
| ShowZones | true | Show zone boxes and score tags (also a panel toggle) |
| MaxConfirmedZones | 10 | Confirmed zones kept on the chart; the oldest is deleted first |
| AlertPopup | true | Popup alert on a new signal (also a panel toggle) |
| AlertPush | false | Push notification to the MT5 mobile app (also a panel toggle) |
| AlertSound | true | Play a sound on a new signal (also a panel toggle) |
| SoundFile | alert.wav | Sound file played by the sound alert |
| Theme | Dark | Chart color theme applied on load |
| RestoreTheme | true | Restore the original chart colors when the indicator is removed |
| ShowScorePanel | true | Show the Distribution Score panel |
| PanelScale | 1 | Panel size multiplier (DPI is handled automatically) |
How to read it
A Distribution Breakdown arrow (buffer 0) prints when a valid forming distribution zone exists (bottom anchored at the Automatic Reaction low, enough edge tests, at least 70% of closes since the AR inside the range), the bar closes below the zone bottom minus ToleranceATRMult x ATR, its tick volume is at least the zone average tick volume x VolumeBreakdownMult and the Distribution Score is at least MinScoreToSignal. With the default MinScoreToSignal=50, expect roughly 0.1 of these arrows per week on EURUSD M15.
A LPSY Retest arrow (buffer 1) prints when within RetestWindowBars bars after a breakdown, at least 3 bars after it and after an earlier bar's low went at least 1 x ATR below the zone bottom, the bar high reaches the zone bottom minus tolerance and the bar closes below the zone bottom minus 0.3 x tolerance. With the default RetestWindowBars=20, expect roughly 0.1 of these arrows per week on EURUSD M15.
Distribution Zones are removed when a forming zone is deleted when a bar closes above the zone top plus tolerance, when a bar closes below the zone bottom minus tolerance without a breakdown signal, or when it is older than MaxZoneBars without a breakdown (input MaxConfirmedZones, default 10).
Zone Score Tag zones are removed when deleted together with its zone box (input MaxConfirmedZones, default 10).
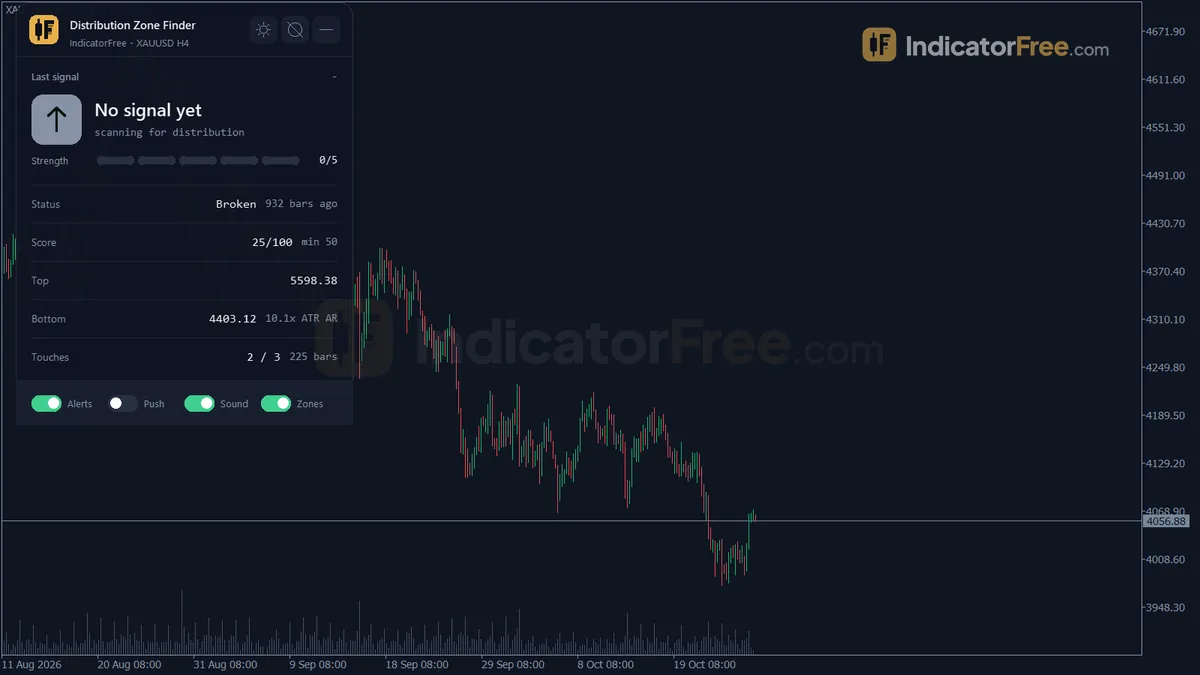
The Distribution Score panel shows last breakdown or retest signal, zone status (including Failed breakdown), Distribution Score, zone top and bottom, edge touches and bars since the last signal.
Installation
- 1Download DistributionZoneFinder.ex5 from the button above (Google Drive).
- 2In MetaTrader 5: File → Open Data Folder → MQL5 → Indicators. Copy DistributionZoneFinder.ex5 there.
- 3Restart MT5 or right-click Indicators in Navigator → Refresh.
- 4Drag Distribution Zone Finder onto a chart. For push alerts, enable "Allow push notifications" under Tools → Options → Notifications.
- Tested on MT5 build 6230.
Key terms and guides
- Candle Close
- A candle close is the last price a candlestick records before its time period ends, such as the final price at the end of a 1-hour candle. Once it prints, it is fixed and no longer changes.
- MetaTrader 5
- MetaTrader 5 (MT5) is a trading platform made by MetaQuotes that brokers give to clients for reading charts, placing orders and running automated strategies in forex, metals, indices, stocks and whatever other markets that broker offers.
- Alerts
- Alerts are notifications your trading platform sends when a condition you set is met, such as price reaching a level or an indicator crossing a line. An alert only tells you something happened; it does not open or close a trade.
More on this subject: Supply, demand & key levels guide, terms and tools
User reviews
No reviews yet. Members who download the tool can review it here.
Sign in and download the tool to review it.
Build a checklist with it
Distribution Zone Finder does one job on the chart: zone / level. Put it on the same chart as the tools below and the IndicatorFree panels merge into one checklist card, ordered trend, zone, signal, risk.
- Trend / contextADXAdds the trend side: which way the market leans before you act on Distribution Zone Finder.
- Entry signalCenterline CrossAdds the entry signal: the moment to act once Distribution Zone Finder has set the scene.
The Lab has not tested these combinations. Each tool is tested on its own; the card only lines up what each one says. Free members get 2 new tools a day. If one has to wait until tomorrow, install BlackBox to raise the limit to 5 a day (20 on a live account).
FAQ
Does Distribution Zone Finder repaint?
No repaint detected. In a 9 Jul 2026 – 8 Oct 2026 test on EURUSD M15 (Raw Trading Ltd real ticks), 2 signals were logged at bar close and re-read at the end of the test: 0 changed. Arrows print on the bar that closes the signal, with no delay.
Can I use Distribution Zone Finder in an EA?
Yes. Read buffer 0 (Distribution Breakdown) with iCustom() on bar 1 — the last closed bar.
Why can’t my EA read the zones?
Zones and the panel are chart objects, not indicator buffers, so iCustom() does not return them.
How do I get alerts on my phone?
Enter your MetaQuotes ID under Tools → Options → Notifications, tick "Enable push notifications", and keep the push alert input on.
Does it work on other pairs?
Tested on EURUSD only; other symbols not tested.
Changelog
- 1.30The LPSY Retest is now a real retest. Price must first leave the zone (a low at least 1 ATR below the broken bottom), and the retest can come no earlier than 3 bars after the breakdown. · 2026-10-09
- 1.20Distribution Score rebuilt so it separates real distribution ranges from a sharp top followed by a drop. · 2026-10-09
- 1.10Zone geometry fixed: the zone bottom is now anchored at the Automatic Reaction (the first swing low after the Climax) and frozen, instead of trailing every new low. · 2026-10-09
- 1.00Initial release: Wyckoff distribution zone detection with a 0-100 Distribution Score (volume dry-up, upthrusts, sign-of-weakness, failed breakouts), dual-gated breakdown signal (tick volume + score), optional LPSY. · 2026-10-09
Final verdict
Pick Distribution Zone Finder if you want signals that stay put once the bar closes: all 2 it printed in our test did. The test produced only 2 arrows, too few to judge them. Distribution Zone Finder was tested on EURUSD only; other symbols were not tested.