









On-balance volume
Also called OBV, OBV indicator, On balance volume indicator
On-balance volume (OBV) is a running total. It adds a candle's volume when the candle closes higher and subtracts it when the candle closes lower, so you can see whether buying or selling pressure is building behind a price move.
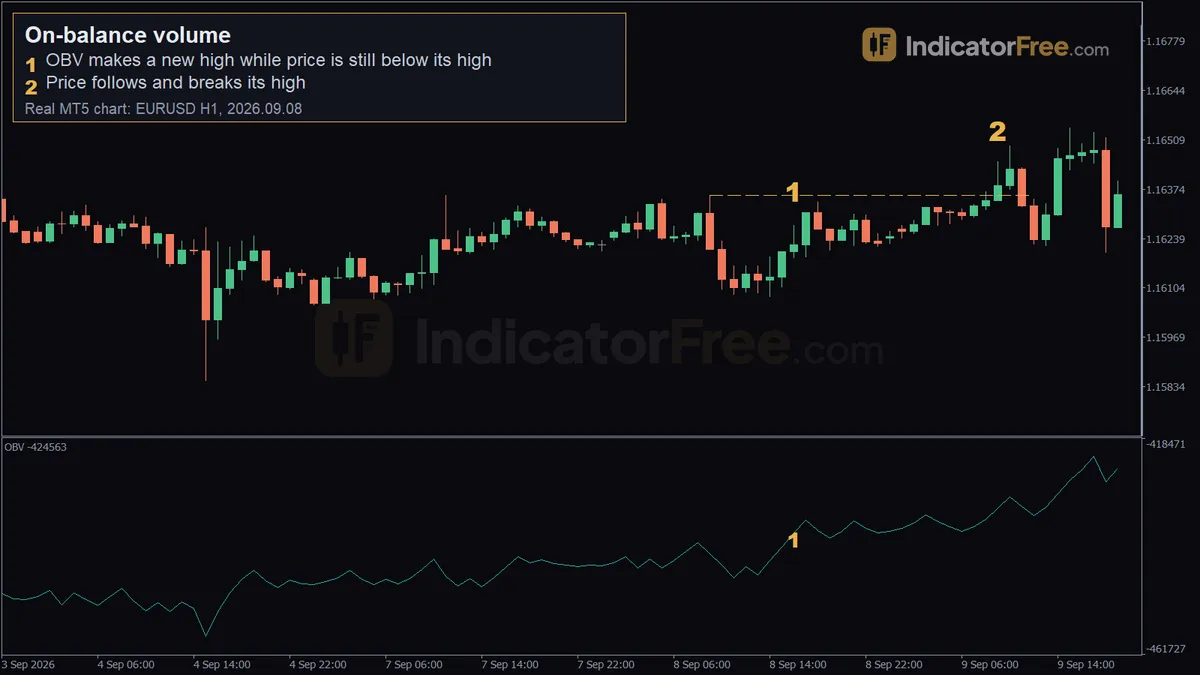
OBV is most useful when it disagrees with price. If OBV rises while price stays under its high, a breakout may be getting ready. If OBV falls while price keeps rising, that is a warning not to buy the last part of the rally.
How the OBV running total is built
On each candle, compare the close with the previous close:
If close > previous close:  OBV = previous OBV + volume
If close < previous close:  OBV = previous OBV − volume
If close = previous close:  OBV = previous OBV
The balance in the name is this running balance: volume on up candles minus volume on down candles. The size of the candle does not count. A candle that closes one pip higher adds all of its volume, just like a candle that closes 50 pips higher.
In the illustrative example below, four candles move OBV from a starting value of 10,000:
In stocks, volume is the real number of shares traded on the exchange. Spot forex has no central exchange, so OBV uses tick volume instead. Tick volume is the number of price changes inside each candle. It shows how busy the market was, not how much money changed hands. So read forex OBV as a measure of activity, not of order size.
Reading OBV: watch the slope and the highs, not the number
The OBV value depends on how much chart history was loaded when the count started. The number on its own means nothing. Read these three things instead:
- Slope. OBV rising along with price means the move has activity behind it.
- Highs and lows compared with price. OBV breaking its earlier high while price is still below its own high means activity on up candles is outpacing down candles even though price has not broken out yet. Price often follows, but not always.
- Divergence. Price makes a new high but OBV makes a lower high. The rally is running on thinner activity.
A common misread is a big OBV jump on a single candle. One news spike can add more tick volume than a whole quiet session. If a new OBV high comes from one candle, check whether that candle was a scheduled release. If it was, treat the jump as noise, not as buyers building up.
The chart below shows the lead signal. OBV clears its earlier high while price is still under its own high. Price breaks out a few candles later.
Choosing the lookback for OBV highs and lows
OBV has no period, so there is nothing to optimise in the formula itself. What you set is the lookback for deciding what counts as a "new high", plus an optional moving average on the OBV line to smooth it.
| Trading style | Chart | Lookback for OBV highs/lows | Optional OBV average |
|---|---|---|---|
| Day trading | 1-hour | 50 candles | 20 |
| Swing trading | 4-hour / daily | 50–100 candles | 20–50 |
MT5 default: On Balance Volume uses tick volume and has no period setting.
Trading the OBV lead into a breakout
EURUSD 1-hour: OBV made the new high first
The chart at the top of this page is a past example, not a prediction. At 16:00 on 2026.09.08, OBV made a new 50-candle high (marker 1). Price closed at 1.16221, still below its 50-candle high of 1.16358. At 09:00 on 2026.09.09, price closed at 1.16383, above that high (marker 2).
Here is an illustrative trade plan built on those prices:
- Setup: OBV makes a new 50-candle high while price is still below its own high. Mark that high at 1.16358. Do not buy yet.
- Entry trigger: wait for a candle to close above 1.16358. Here that candle closed at 1.16383, so you buy at 1.16383.
- Stop loss: place it at 1.16221, the close of the candle where OBV took the lead. That is the price at the moment the lead appeared, so if price falls back below it, the head start OBV gave has been undone and the setup is void. The candles between the two markers are not listed here, so check them on your chart: if price traded below 1.16221 during those 17 hours, put the stop under that lower swing low instead and recompute your risk and target. With the stop at 1.16221, risk = 1.16383 − 1.16221 = 0.00162, which is 16.2 pips.
- Exit: aim for twice your risk. 16.2 × 2 = 32.4 pips, so your target sits 32.4 pips above the 1.16383 entry.
If price closes back under 1.16358 within a few candles, the lead has failed and you exit. If price makes a new high but OBV does not, tighten your stop.
When OBV helps and when to ignore it
Works well:
- Price pressing against a clear high or low, or a steady trend
- 1-hour charts and longer, where each candle has enough ticks to count
- Busy session hours, when tick volume reflects real participation
Avoid or discount it:
- Major news release candles (see the misread above)
- Holiday trading and the quiet late session
- Tight sideways chop, where closes flip up and down and OBV zig-zags without meaning
OBV pre-trade checklist
- Are you comparing OBV and price over the same lookback, for example 50 candles for both?
- Does OBV agree on the next higher timeframe before you take a trade on a lower one?
- Are your stop, target and exit-on-failure level written down before you enter?
FAQ
Does the OBV line change after a candle closes?
Partly. The value on the current candle moves until it closes, because both the close and the volume can still change. Once the candle closes, the step it adds or subtracts is fixed. The level of the whole line is not: it can shift up or down when more chart history loads or the feed's history is revised, because the count then starts from a different point. Only act on closed candles.
Why does my OBV look different from another trader's on the same pair?
Tick volume comes from each broker's own price feed, so the counts differ from one feed to the next. Compare the shape and the highs and lows, never the raw numbers.