









VWAP
Also called Volume-weighted average price, Volume weighted average price, Session VWAP, Anchored VWAP
VWAP (volume-weighted average price) is the average price traded since the session opened. Each price is weighted by the volume traded at it. The line resets every session and is widely used as the day's fair-value reference.
Many large traders judge their fills against VWAP, so orders tend to gather around this line. If you buy far above it, you are paying more than the average buyer paid today. As an illustrative number: buy 20 pips above it, and your stop has to be at least that wide to sit beyond the line.
How the VWAP line is calculated
Each candle gives a typical price, which is the average of its high, low and close. VWAP multiplies each typical price by that candle's volume. It adds the results and divides by the total volume since the session began:
Typical price = (High + Low + Close) ÷ 3
VWAP = Σ (Typical price × Volume) ÷ Σ Volume   (summed from the session start)
A simple moving average gives every candle the same vote. VWAP gives a busy candle more weight than a quiet one. The illustrative example below uses round prices so the arithmetic is easy to follow. Three 1-hour candles have typical prices of 100, 103 and 106. The first candle traded twice the volume of each of the others.
A plain average of the three prices would be 103. VWAP comes out lower, at 102.25, because the heavy first candle pulls the line toward its price. That pull is the whole point of the indicator. It shows where most of the trading actually happened.
Forex has one twist. Spot currencies have no central exchange, so there is no single total volume figure. Charts use tick volume instead, which counts how many times the price changed. It works as a rough stand-in for activity, but it is not the real traded amount. On stocks and futures, VWAP uses the real exchange volume.
Reading price against VWAP on the chart
- Price above a rising VWAP: buyers have paid up all session. Look for longs and treat VWAP as the floor.
- Price below a falling VWAP: sellers are in control. Look for shorts and treat VWAP as the ceiling.
- Price crossing a flat VWAP again and again: nobody is in control. VWAP is just the middle of a range, not a signal.
The most common misread is taking every cross as an entry. On a range day the line goes flat and price swings back and forth across it, so each "cross" signal reverses within a few candles. The illustrative chart below shows that pattern.
To spot it, look at the slope before you look at the cross. If the line is flat and price has already crossed it twice this session, stop treating crosses as signals.
By afternoon the volume total is so large that each new candle barely moves VWAP, so a flat line late in the day does not mean the market is ranging.
Trading a pullback to VWAP
Buying the VWAP retest on EURUSD 1-hour
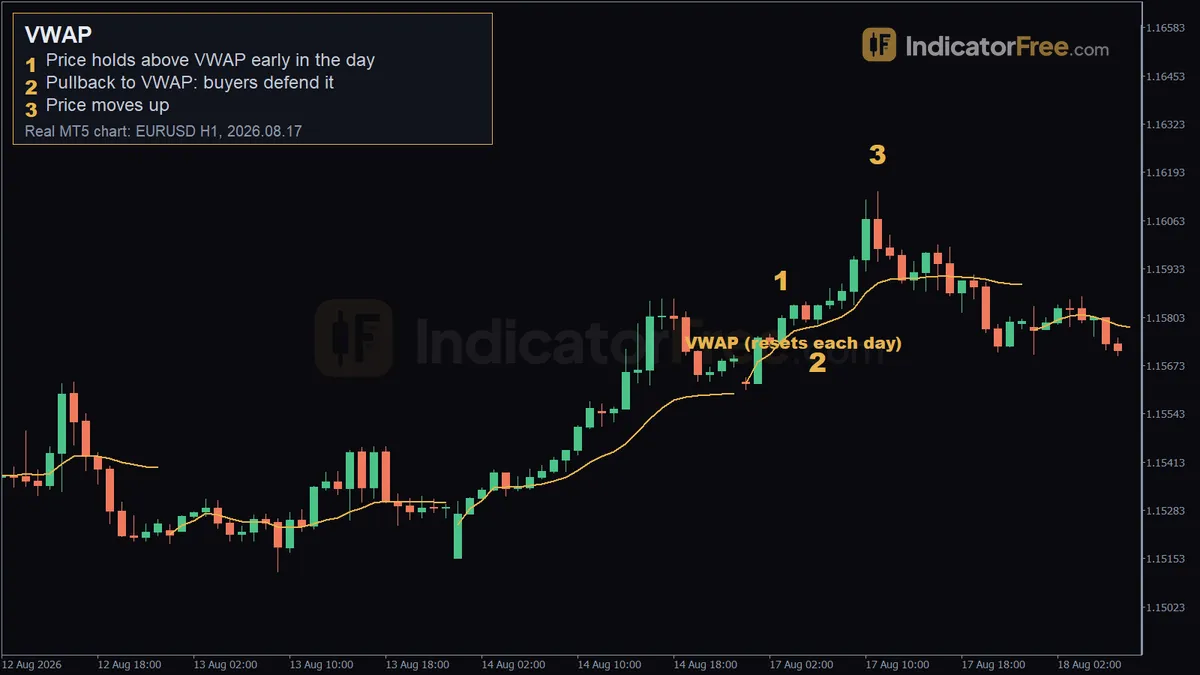
The chart at the top of this page is a past example, not a prediction. On EURUSD 1-hour, price held above the day's VWAP for the first 6 candles. At 2026.08.17 03:00 it was trading at 1.15809, still above the line.
- Entry trigger: wait for a candle to touch VWAP and close back above it. At 2026.08.17 06:00 the low (1.15785) touched VWAP (1.15780) and the candle closed above the line. Buyers defended it, and you buy at that close. The chart data does not give the exact closing price, only that it sat above VWAP (1.15780).
- Stop loss: place it below VWAP (1.15780) plus a buffer you set in advance. Your stop width is the distance from your entry down to VWAP, plus that buffer. Check that width against the decision rule below before you enter.
- Exit: leave the trade if an hourly candle closes below VWAP, or close it before the session ends. In total, price gained 31 pips over the 10 candles after the touch. The chart data does not give the exact start and end prices of that move. The 11:00 marker, 5 candles after the touch, shows price at 1.16141 as part of that move.
Use this decision rule before every VWAP entry: if price is further from VWAP than the stop you are willing to take, do not enter. Wait for a pullback. Your stop belongs beyond the line, so the further price has stretched from VWAP, the wider that stop has to be. Chasing a stretched move makes your risk wider without improving the setup.
When VWAP helps and when to switch it off
Works well:
- Liquid sessions with steady activity, such as London and New York for majors and gold
- Trending days where the line slopes clearly in one direction
- Intraday charts from 1-minute to 1-hour
Avoid or reduce size:
- The first candles after the reset, when too little volume has built up to steady the line
- Quiet hours and holiday sessions, when thin tick volume distorts the line
- Around major news, which can blow through VWAP in one candle
- Daily charts with a session VWAP, because the line just follows each candle
Choosing the VWAP reset for your trading style
VWAP has no length setting like a moving average. What you choose is the anchor, meaning the point where the sum restarts. An anchored VWAP starts from a point you pick, such as a swing low or a news candle.
| Style | Chart | Anchor to use |
|---|---|---|
| Scalping | 5-minute / 15-minute | Daily session VWAP, or anchored at the London or New York open |
| Day trading | 1-hour | Daily session VWAP, with the previous day's final VWAP as a reference level |
| Swing trading | 4-hour / daily | Weekly or monthly VWAP, or anchored at a major swing high or low |
Gold trades most actively in the London and New York sessions, so anchoring at the London open often gives a cleaner line than a midnight reset. Major FX pairs trade around the clock, so check what time your chart's "day" starts. That reset hour decides where your VWAP sits.
Checklist before a VWAP trade
- Is VWAP sloping in my trade direction?
- Did price touch the line and close back on my side?
- Is my stop beyond VWAP and no wider than I accept?
- Is this retest happening in London or New York hours, with no major news due during the trade?
- Where is the previous session's final VWAP? Price often reacts there the next day.
FAQ
What are the bands above and below VWAP?
They are standard-deviation bands, usually drawn at one, two or three standard deviations from the VWAP line. They show how far price has stretched from the session average. Price near an outer band is far from fair value, which under the decision rule above means waiting for a pullback rather than chasing.
Does VWAP repaint?
The value on the current candle moves until that candle closes, because volume is still coming in. Once a candle closes, its VWAP value stays fixed for the rest of the session.
Can VWAP give me a profit target?
Not on its own. VWAP gives you a bias and a place for your stop, but it does not mark where to take profit. You need a separate target, such as a band level or the previous session's high or low.