









Volume weighted average
Also called VWAP, Volume weighted average price, Volume-weighted average, Volume weighted average trading price
A volume weighted average is a price average where each price counts in proportion to the volume traded at it. Its best-known form, VWAP, restarts every session and shows the average price paid so far that day.
The line marks roughly where the day's average trade broke even. Buy far above it and you pay more than the average price traded today. A return to the average can then wipe out your trade before it gets going.
How the volume weighted average price is calculated
Each candle adds its typical price, which is the average of its high, low and close, multiplied by its volume. The products are added up from the start of the session. Then the total is divided by all the volume traded so far.
VWAP = Σ (typical price × volume) ÷ Σ volume
typical price = (high + low + close) ÷ 3
Both sums keep growing through the day. That is why the line moves quickly in the first hours and steadies later, when one new candle barely changes it. At the next session start, both sums go back to zero.
Spot forex has no central exchange, so most forex charts use tick volume in the formula. Tick volume counts how many times the price changed during a candle, using your broker's feed. It tracks activity well enough for weighting, but two brokers can draw slightly different lines.
The calculation below uses three candles whose typical prices are round numbers, 100, 101 and 102, as an illustrative example. The busy first candle pulls the result below the simple average of the three prices, which is 101.
When the VWAP session starts in forex
Spot forex trades around the clock, so there is no single opening bell. The session start is a setting you choose, and the three common choices are broker server midnight, the London open and the New York close. Each one starts the sums from different candles, so the same pair can show three different VWAP lines on the same day.
Use this rule: anchor VWAP at the start of the session you actually trade. If you trade the London morning, anchor at the London open, not at server midnight. Otherwise the quiet Asian hours stay in the sums and pull the line toward prices London traders never dealt at. If you hold trades through the whole day, pick one daily reset, such as the New York close, and keep it the same every day so the levels stay comparable.
VWAP vs volume weighted moving average
The volume weighted moving average (VWMA) uses the same weighting, but only over a fixed number of recent candles, such as the last 20. It never resets. It just slides forward one candle at a time. VWAP is tied to the session start instead.
This changes what each line tells you. VWAP shows where today's average trade sits. VWMA shows where the recent volume-weighted trend sits. The drawing below shows both lines across two days.
A common mistake is to put a daily-reset VWAP on a daily chart. There, each candle is a whole session, so the line only repeats that candle's typical price.
Reading price against the VWAP line
- Price above a rising VWAP: buyers are in control, and the average buyer today is in profit. Look for buys on pullbacks to the line.
- Price below a falling VWAP: the mirror case. Look for sells on rallies up to it.
- Price far from the line: the move is stretched. To judge "far", compare the distance to the size of a typical candle that day: several candles' worth away means stretched. Wait for a pullback instead of chasing.
- Price crossing back and forth: neither side is in control. Here is a rule: if price has closed on both sides of VWAP three or more times this session, stop trading off the line for the day.
When VWAP helps and when to ignore it
| Situation | What the line does | What you do |
|---|---|---|
| Pullback after the first few hours | Has enough volume behind it to hold steady | Use the touch as your entry area, with a defined stop just beyond the wick |
| First candles after a session reset | Only a few candles feed it | Wait for at least the first 3 candles of your session before trusting the level (a suggested minimum, not a tested figure) |
| Big news release | One spike candle drags the average | Stand aside until the spike candle has closed and price settles |
| Thin, quiet hours | Drifts, because broker tick volume is low | Treat the level as a rough zone, not an exact price |
| Late in the session | Each new candle barely moves it | Skip fresh entries near the end of your session, since a late touch leaves little time for the move to play out |
Trading the first pullback to VWAP
EURUSD 1-hour: buyers defend VWAP on 6 May 2026
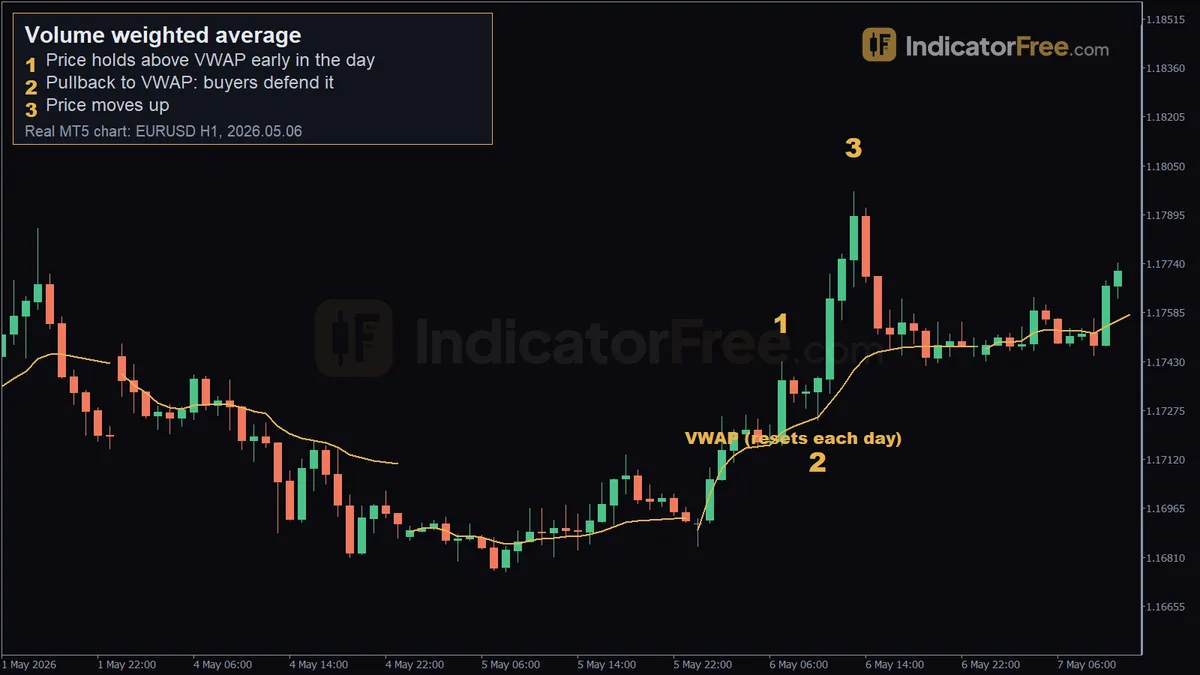
The chart at the top of this page is a past example, not a prediction. VWAP here resets at server midnight (00:00 chart time), so you can rebuild the same line, and price stayed above it for the first 10 candles. At 07:00 the candle pushed up to a high of 1.17429, then closed lower at 1.1737, still above the line (marker 1). That told you buyers were in charge, so only buy setups were worth considering. Favour the first or second pullback of the session: each later touch has more of the day's volume already behind the line and fewer fresh buyers waiting.
- Entry trigger: at 10:00 the low reached 1.17243, touching VWAP at 1.17253, and the candle closed above the line (marker 2). Enter when that candle closes, or at the open of the next one.
- Stop loss: below 1.17243, plus a buffer the size of your spread. This puts it beyond both the wick and the line. A close below VWAP would cancel the idea anyway. Entering at the 10:00 close of 1.17376, that is a risk of about 13 pips plus the spread.
- Exit: trail the stop and exit on the first 1-hour close back below VWAP. As an alternative, take profit at a prior high you marked before entry. In the 10 candles after the touch, price reached 59 pips above the entry close at its 13:00 high of 1.17968 (marker 3), about four and a half times the risk. By the tenth candle (20:00) it had closed at 1.17482, only about 11 pips above entry, so do not expect a trailing exit to capture the full peak.
Choosing the VWAP session or VWMA length for your style
| Style | Chart | Line to use | Why |
|---|---|---|---|
| Scalping | 5- and 15-minute | Daily VWAP | Fresh reference each session |
| Day trading | 1-hour | Daily VWAP, plus yesterday's final VWAP level | Shows today's balance and a nearby reference |
| Swing | 4-hour | Weekly VWAP | A daily reset is too short |
| Swing | Daily | 20-candle VWMA | A weekly VWAP would be built from too few candles |
Quick VWAP checklist
- Is VWAP anchored at the start of the session you trade, rather than left at server midnight by default?
- Is price clearly on one side of VWAP, with the line sloping that way rather than flat?
- Is this the first or second pullback of the session?
- Did the touch candle close back on the trend side?
- Is the stop placed beyond the wick, and is no major news due?
- Does your usual entry signal agree with the side of VWAP price is on?
- Is your trade size set from the distance between entry and stop, not from a fixed lot size?
FAQ
Should I use yesterday's final VWAP as a level today?
Yes, as a reference zone. Yesterday's final VWAP is the average price of all of yesterday's volume, so it shows where yesterday's traders broke even overall. Mark it as a horizontal line at the VWAP value of yesterday's last closed candle, using the same session reset you use today. Give it more weight when today's price is trading near it than when price has already moved far away.
Does VWAP repaint during the day?
The value on the current candle moves until that candle closes, because its price and volume are still changing. Once a candle closes, its VWAP value stays fixed. Judge touches and closes on finished candles only.