









Volume spike
Also called Volume surge, High-volume candle, Volume burst
A volume spike is a candle whose traded volume is far above its recent average, often two to three times or more. It shows that activity suddenly jumped at that price, which can confirm a breakout or mark the end of a move.
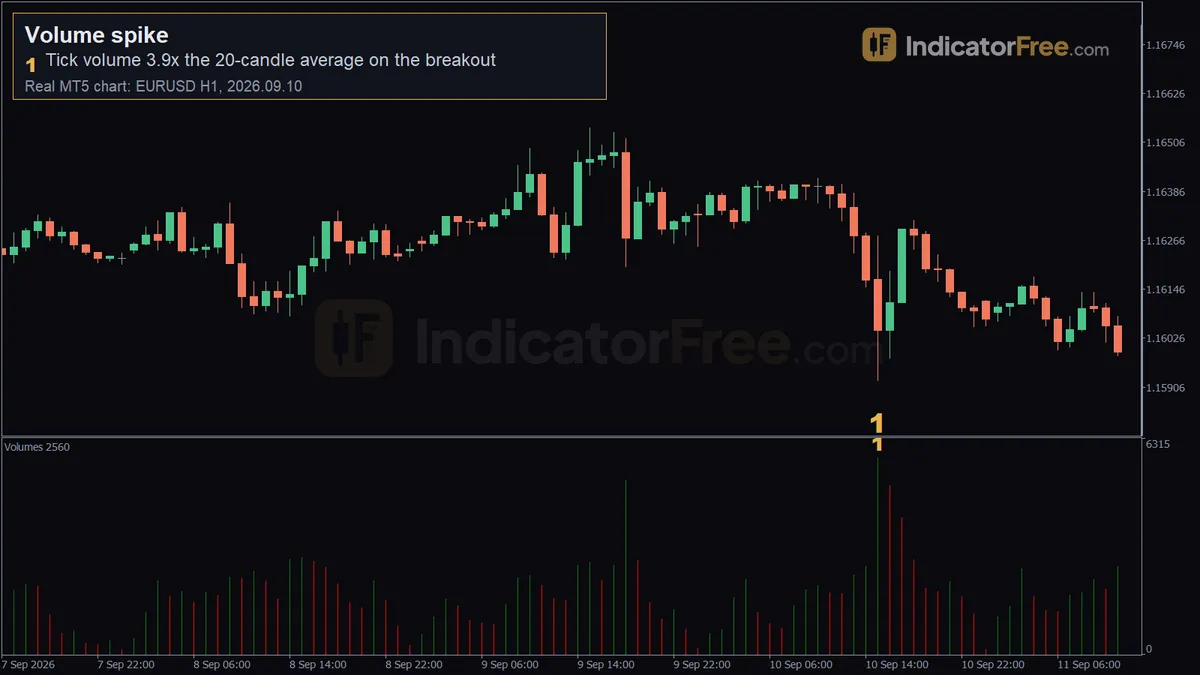
In spot forex there is no central exchange, so the volume on your chart is usually tick volume: a count of price changes, not the money traded. A spike tells you activity jumped, not who won. If you read it well, it can confirm a breakout before you risk money on it. If you read it badly, you will sell into a routine burst of activity at a session open.
How to spot a volume spike, step by step
- Set a baseline. Average the volume of the last 20 candles on the timeframe you trade.
- Work out the ratio. Divide the current candle's volume by that average. A useful working rule is to call 2x a spike and 3x or more a strong spike.
- Compare like with like. Look at the same hour on the previous few days. If that hour is always busy, the jump is routine and not a signal.
- Wait for the candle to close. Volume builds through the candle, so a candle that is still forming can look ordinary or extreme before it settles.
- Note the location. Spikes matter at a range edge, at a prior high or low, or after a long run. A spike in the middle of a range tells you little.
- Read the close. A close near the candle's extreme, beyond the level, means the market accepted the move. A long wick back inside means it rejected it.
The illustrative chart below shows what you are looking for. Price drifts sideways while volume stays near its average, then one candle breaks the range floor on more than three times normal volume.
Bullish and bearish volume spikes
A bullish volume spike is heavy volume on a candle that closes up through resistance, showing buyers absorbed the available selling. A bearish volume spike is the mirror: heavy volume on a candle that closes down through support, like the EURUSD example below.
When volume rises but price fails to follow, see volume divergence. A sudden price jump looked at on its own, without the volume reading, is covered under spike.
Strong spike or false alarm: what makes one weak
A valid spike has three things together: an unusual ratio, a meaningful level, and a close that shows which side won. Take away any one of them and the signal weakens.
The most common misread is the session-open spike. Volume jumps at the same hours every day as new traders come in. If the spike is less than about 1.5x the average for that same hour on previous days, treat it as routine.
The two tests measure different things. The 2x test compares the candle with the last 20 candles, and the 1.5x test compares it with the same hour on earlier days. A real spike must pass both.
A spike with a small body and long wicks on both sides is a different case. Heavy two-way trading that goes nowhere shows indecision, not a breakout. Wait for the next candle to pick a side.
The first candle of a scheduled news release also breaks the rules. Volume is always extreme there, and price often swings both ways inside that candle. The spike only tells you that news arrived.
Past example: a 3.9x volume spike on a EURUSD breakdown
The chart at the top of the page is a past example, not a prediction. It shows EURUSD on the 1-hour chart.
Marker 1 sits on the candle of 2026.09.10 15:00, at 1.15922. That candle printed 5,729 ticks against a 20-candle average of 1,484. The ratio is 5,729 ÷ 1,484 = 3.86, which rounds to 3.9x. That is well above the 3x strong-spike line.
The candle also closed below the low of the previous 20 candles. So it passes the ratio test, the location test and the close test from the checklist. That combination is what a valid breakdown spike looks like.
Two checks still apply before you act. First, is that hour normally busy on your chart? Second, does the next candle stay below the broken low, or does it climb back inside?
Two ways to trade a volume spike
Breakout continuation after the spike
Use this when the spike candle closes beyond a level, as in the EURUSD example.
- Entry: sell at the close of the spike candle, or wait for a retest of the broken low from below.
- Stop loss: a few pips above the spike candle's high. If price gets back above that high, the heavy selling has been fully absorbed.
- Target: the next support level, or at least twice your risk.
- Early exit: if the candle after the spike closes back inside the range, exit. The spike has failed.
Mark the spike level on your chart either way. Price often returns to test the area where heavy volume traded.
Here is an illustrative example with round numbers, not taken from the EURUSD chart: say the spike candle's high left your stop 25 pips above entry. A target of twice the risk is then 50 pips below entry. On a $10,000 account risking 1%, the size works out as shown below, using $10 per pip for one standard lot (100,000 units) of EURUSD.
Exhaustion fade after a long run
Use this when a spike arrives after many candles in one direction, and the spike candle closes back away from its extreme with a long wick.
- Entry: wait for the next candle to break the spike candle's opposite end. After an up-run, that means selling below the spike candle's low.
- Stop loss: beyond the spike candle's extreme. That extreme is where the last buyers (or sellers) were trapped.
- Target: the middle of the prior run, or the last swing level price broke on the way up or down.
The illustrative chart below shows the shape. A steady run of up candles ends in a tall spike candle that leaves a long upper wick, and the next candle breaks its low. The stop sits above the top of the wick.
If the next candle closes beyond the spike's extreme instead, the move is still alive. Skip the fade.
When volume spikes help and when to stand aside
Spikes are most useful after a quiet, tight range with clear edges. A burst of volume through one edge shows that real participation arrived. They also help during the liquid hours of the pair you trade.
Stand aside in thin holiday or end-of-day trading, and on very short charts such as 1-minute, where a single burst of quotes can fake a ratio. On those charts, check the 15-minute or 1-hour view first.
| Pros | Cons | |
|---|---|---|
| Signal | Easy to measure with a simple ratio | Tick volume counts activity, not size |
| Timing | Shows when participation arrives | Spike candles are often large, so stops get wide |
| Context | Separates real breakouts from quiet drifts | Session opens and news create routine spikes |
| Use | Works for breakouts and exhaustion | The close decides: beyond the level = continuation, long wick back inside = exhaustion |
Quick volume spike checklist
- Ratio at least 2x the 20-candle average, and above the normal for that hour?
- At a range edge, prior high or low, or after a long run?
- Closed beyond the level (continuation) or back inside with a long wick (exhaustion)?
- No scheduled news on this candle, and stop sized from the spike's extreme?
FAQ
How do I set up a volume spike alert or screener?
The rule is the same on any charting tool: current volume is greater than 2 times the 20-period moving average of volume. Most platforms let you set an alert or screen a list of symbols on that condition. Have it trigger on candle close only.
Is tick volume good enough to spot spikes in forex?
For spikes, yes, in practice. Busy periods produce more price changes, so tick volume rises and falls with real activity even though it does not measure size. On exchange-traded markets such as futures and stocks, use the real traded volume instead.
What ratio counts as high volume on a daily chart?
Use the same ratio method. Because each daily candle already covers every session, a 2x day stands out more than a 2x hour. Use a 20-day baseline, and also compare the day with the same weekday in earlier weeks, since some weekdays are routinely busier than others.