









Point of control
Also called POC, VPOC, Volume point of control
The point of control (POC) is the single price where the most volume traded during a chosen period. It is the longest bar on a volume profile, and traders watch how price reacts when it comes back to it.
Many traders treat the POC as a hard support line and put their stop right on it. Price likes to chop at the POC, so a stop there is easy to hit.
Seeing the point of control on a volume profile
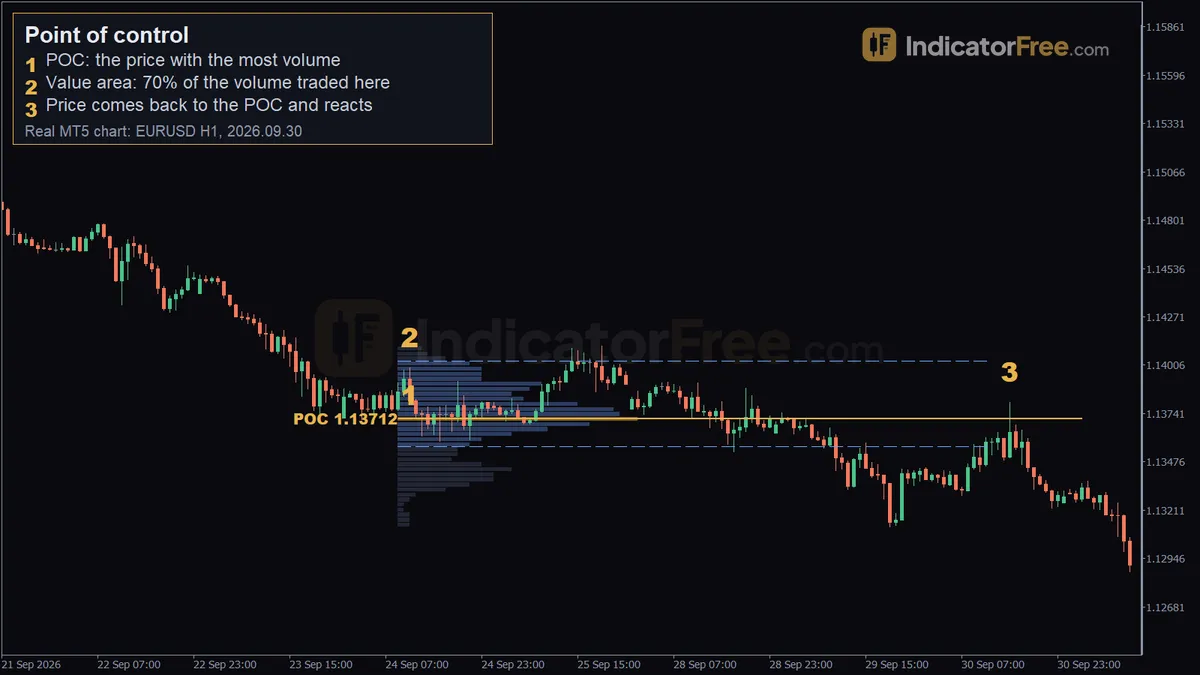
A volume profile stacks volume sideways, with one bar for each price level. The POC is the longest bar. The value area is the band of prices around the POC where 70% of the volume traded. You build it by adding the next-busiest prices on either side of the POC until you reach 70%. The figure below shows both.
A POC that price has not touched since its range closed is called a naked POC. The first return to a naked POC usually gets the clearest reaction. Day traders mark the previous session's POC before the open and plan around it.
How to identify a point of control
- Choose one closed range: a session, a day, a week, or the move between two clear swings.
- Build the volume profile for that range only.
- Find the longest bar. That price is the POC.
- Mark the value area, the prices that hold 70% of the range's volume around the POC.
- Check the shape. One clear peak is usable. Two peaks of similar size give you two POC candidates, so lower your confidence.
- Check whether price has come back to it since the range closed. Untested is better.
- Note where current price sits: above the POC, below it, or inside the value area.
Strong, weak and broken points of control
A strong POC is a single bar clearly longer than its neighbours. It was built over many candles and nothing has tested it yet. It means many traders accepted that price over time.
A POC is weak in four cases. The profile is flat, with several bars almost the same length. One news spike built most of the volume in a few minutes. Price has already passed through it several times. Or the range is so short that a handful of candles decide the result.
A POC is broken when price accepts beyond it. That means several candles close on the other side and new volume builds there. A wick through the POC that closes back is a rejection, not a break. Here is a rule you can apply: if price closes past the POC and stays there for two or more candles, stop trading it as a turning point and look to the next value area edge instead.
Past EURUSD 1-hour example, 24–30 September 2026
The chart at the top of the page is a past example, not a prediction. The profile covers 100 one-hour candles from 2026.09.24 09:00 to 2026.09.30 12:00 and uses tick volume.
- Marker 1, the POC at 1.13712. This price collected the most tick volume in those 100 candles. The line is drawn from 2026.09.24 11:00.
- Marker 2, the value area. 70% of the volume traded between 1.13560 and 1.14029. The marker sits on the upper edge, 1.14029.
- Marker 3, the return. At 2026.09.30 15:00, price came back to the POC area. The marker is at 1.13803, just above the POC. Price then moved 49 pips down.
Price reached this POC for the first time after the range closed, and it reacted there. That is the naked-POC behaviour from the first section, seen in one past case.
Two point of control trading setups
Both setups apply the rules to the levels of the past EURUSD range above. They show how you would plan each trade, not a record of a real trade.
Setup 1: selling the return to the EURUSD POC
On 2026.09.30 15:00 price came back to the POC area at 1.13803. What you want to see: price reaches the POC area from below, fails to hold above it, and the candle closes back down. Only then do you act.
- Entry: sell near 1.13803 (the marker level), or at the close of that rejection candle. The entry price is approximate.
- Stop loss: above the value area high, 1.14029, not on the POC. That is 22.6 pips of risk.
- Target: the value area low, 1.13560. That is 24.3 pips of reward.
The reward is only about 1.1 times the risk, under the 1.5 in the checklist below. By that rule you would skip this trade, even though this past move went 49 pips down.
Below is the position size as an illustrative example: a $10,000 account risking at most 1%, on a USD-quoted pair where a standard lot (100,000 units) is worth $10 per pip.
Setup 2: fading the value area high back to the POC
In the same range, the value area high is 1.14029 and the POC is 1.13712. If price pushes above 1.14029 and a candle then closes back inside, price was rejected above value. A move back toward the POC is the common next step.
- Entry: sell on the close back below 1.14029.
- Stop loss: above the high of the spike that poked out of the value area.
- Target: the POC at 1.13712, 31.7 pips below the value area high.
If price closes back above 1.14029 before reaching the target, close the trade. Value is moving up, and the setup no longer holds.
When POC trades work and when to avoid them
POC trades work best when the market rotates inside or around a prior range, during the busiest trading hours, and on the first touch of a naked POC. Avoid them on strong trend days, when price leaves value and never looks back. Also avoid them just before scheduled high-impact news and in thin hours, when a few ticks can build a misleading peak.
| Pros | Cons |
|---|---|
| Gives an objective level built from where trading actually happened | Depends on the range you pick; a different range gives a different POC |
| Works on any market and timeframe | Price often chops at the POC before choosing a side |
| Pairs well with value area edges for clear targets | Gets run over on strong trend days |
| Untested POCs from past ranges can still matter in later sessions, as the EURUSD POC built from 24 September did on 30 September | Two peaks of similar size make the POC unclear |
Bullish and bearish point of control reactions
Bullish: price trades above the POC and pulls back to it from above. If a candle closes back above the POC, you can buy, with the stop below the reaction wick.
Bearish: the mirror case. Price reaches the POC from below, fails to hold above it and closes back under it, as in Setup 1; the sell stop goes above the reaction wick.
Tips for trading the point of control
- Treat the POC as a zone, not an exact price. Put stops beyond the reaction wick.
- Match the range to your trade: session profiles for intraday trades, weekly profiles for swing trades.
- Use the opposite value area edge or the next naked POC as your target, not a fixed number of pips.
Quick POC checklist
- One clear peak, built over a full closed range?
- Untested since that range closed?
- Rejection candle closed back on your side?
- Stop beyond the wick, with at least 1.5 times the risk available to the target?
FAQ
Does the point of control move during the trading day?
Yes. While a range is still open, the developing POC shifts as new volume comes in. Once the range closes, its POC is fixed. Base your levels on closed ranges, and use the developing POC only to see where today's value is forming.
Is a POC on forex charts reliable without central volume?
Spot forex has no central exchange, so forex profiles use tick volume, which counts price changes instead of traded amounts. Different data feeds can put the POC a few points apart. Treat it as a zone, and check that it lines up with a visible price shelf on the chart.
What is the difference between the POC and the value area high or low as a target?
From a value area edge, the POC is the nearer target: in Setup 2 it sits 31.7 pips below 1.14029. The opposite edge is further, and price has to pass through the POC on the way, where it often stalls, as in Setup 1. If you aim for the far edge, decide in advance what you will do with your stop when price reaches the POC.