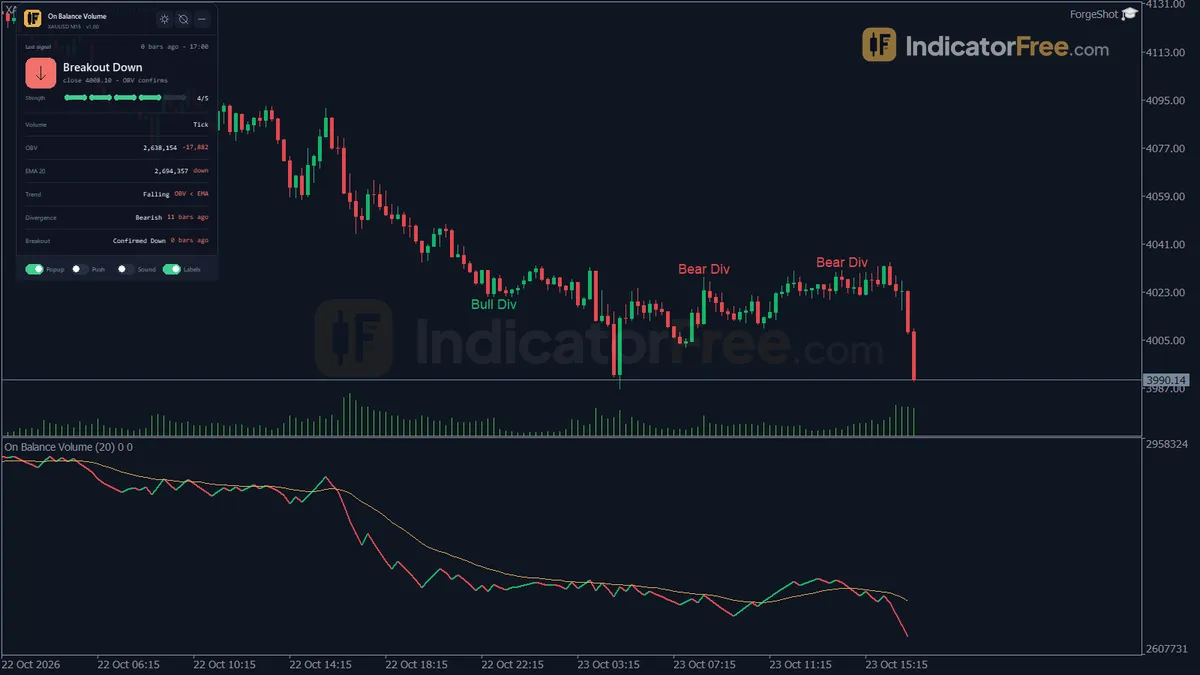
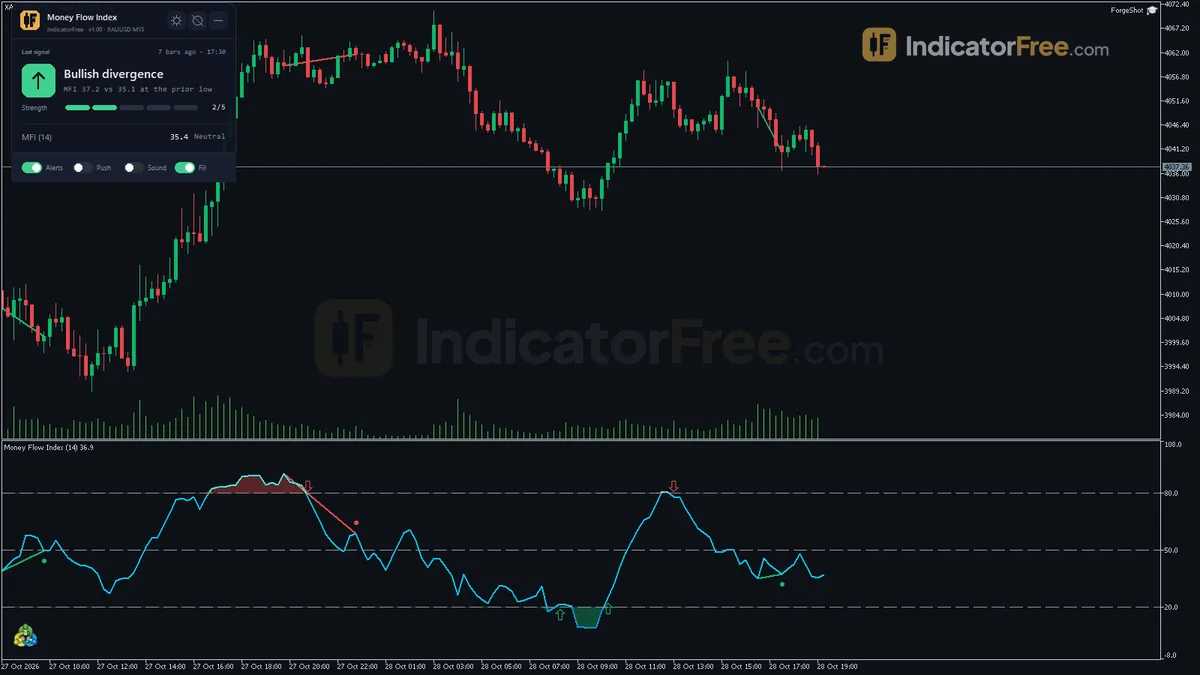
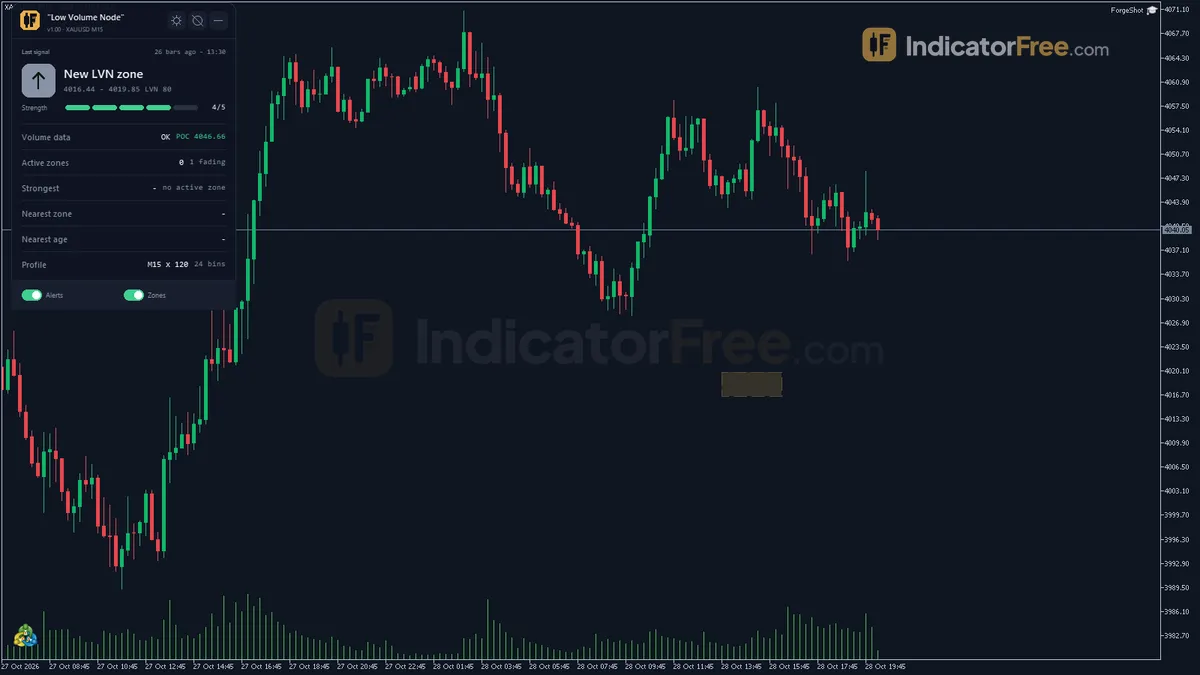
Session Volume Profile
Free Session Volume Profile indicator for MT5: daily, weekly or monthly POC, value area and HVN/LVN lines with alerts. Lab-checked on MT5 build 6230.
- Repainted
- Not tested
- Signals / week
- —
- Tested on
- —
- Tested
- 2026-10-09
Overview
What Session Volume Profile draws on your MT5 chart
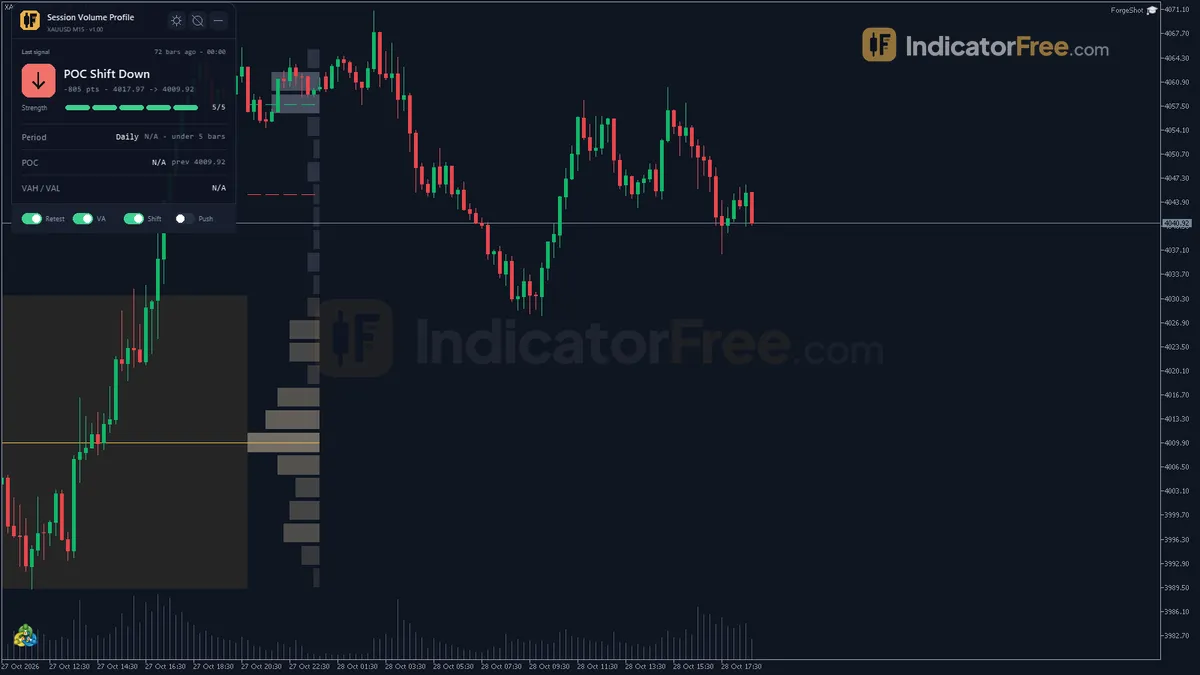
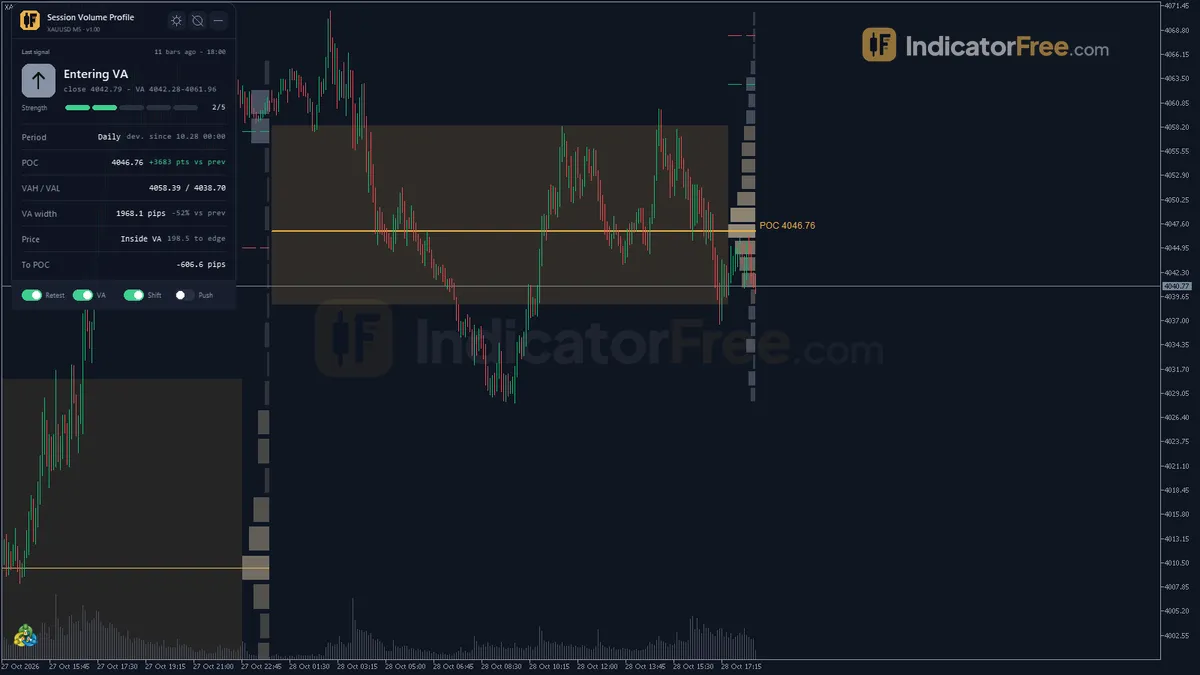
Session Volume Profile is a free MT5 indicator for intraday and swing traders who trade levels. It draws each day's, week's or month's volume histogram, Point of Control (POC), 70% value area and HVN/LVN lines, and it sends alerts on closed bars. The Lab ran version 1.00 on MT5 build 6230 (2026-10-09), and the file is 165 KB. Everything is drawn on the main price chart, not in a separate subwindow, and a rolling-bar period mode is also available.
A volume profile shows how much volume traded at each price instead of at each time. The POC is the price row with the most volume, and the value area is the band around it that holds a set share of that volume. The glossary covers both terms in more depth.
What you get on the chart
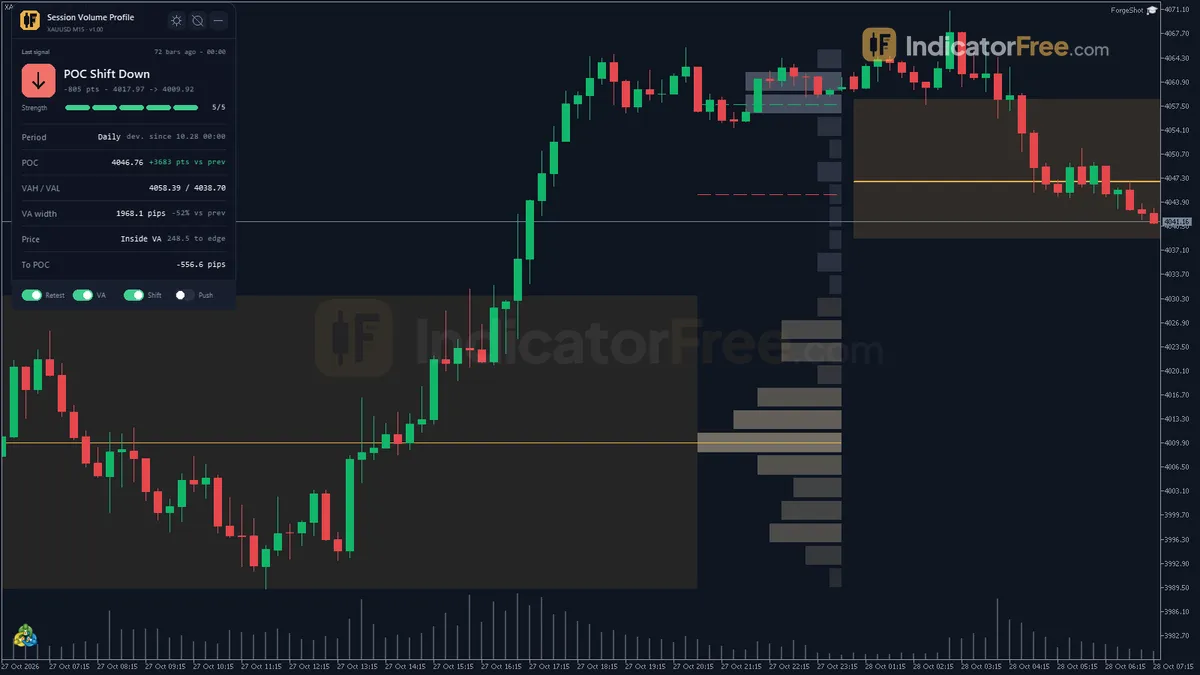
- Volume Histogram: rectangles kept inside each period, with the longest row
HistogramMaxWidthBars(12) bars long. Each row's shade is mixed with the chart background according to its volume, so heavy rows stand out. - Value Area: a box covering the rows that hold
ValueAreaPercent(70% by default) of the period's volume. - POC / HVN / LVN lines: one POC line per period, plus
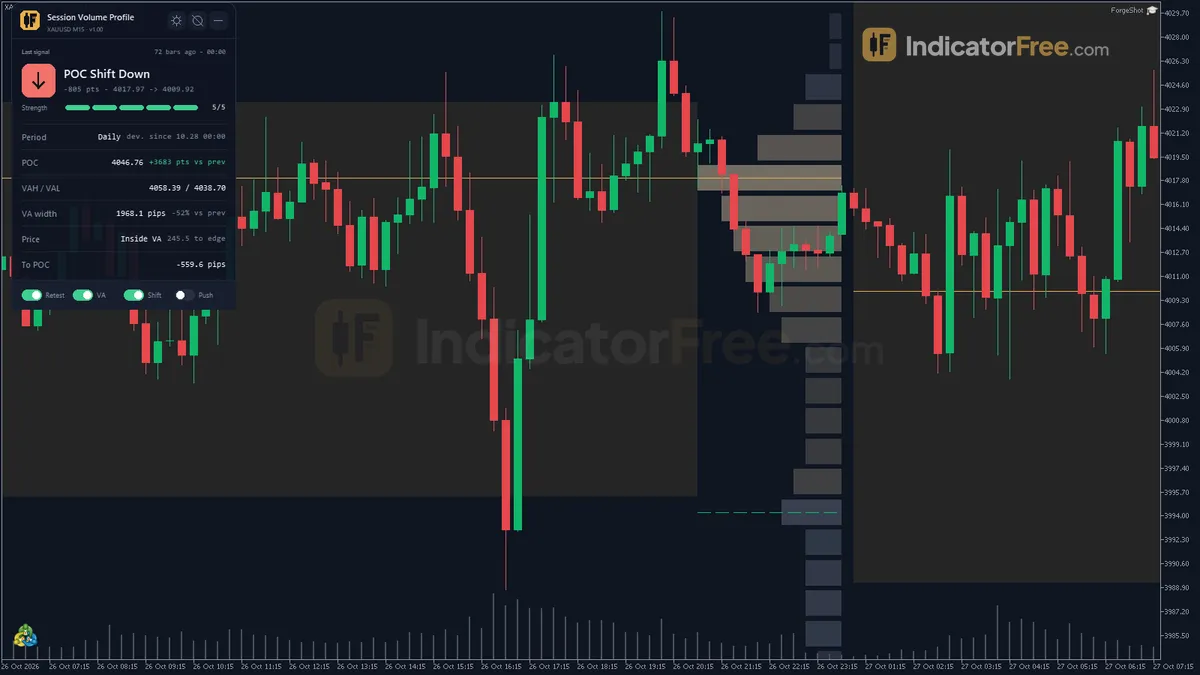
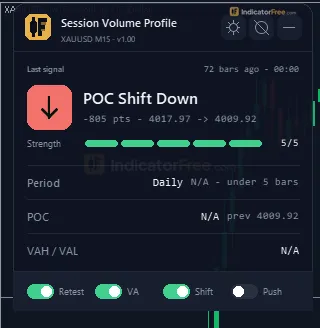
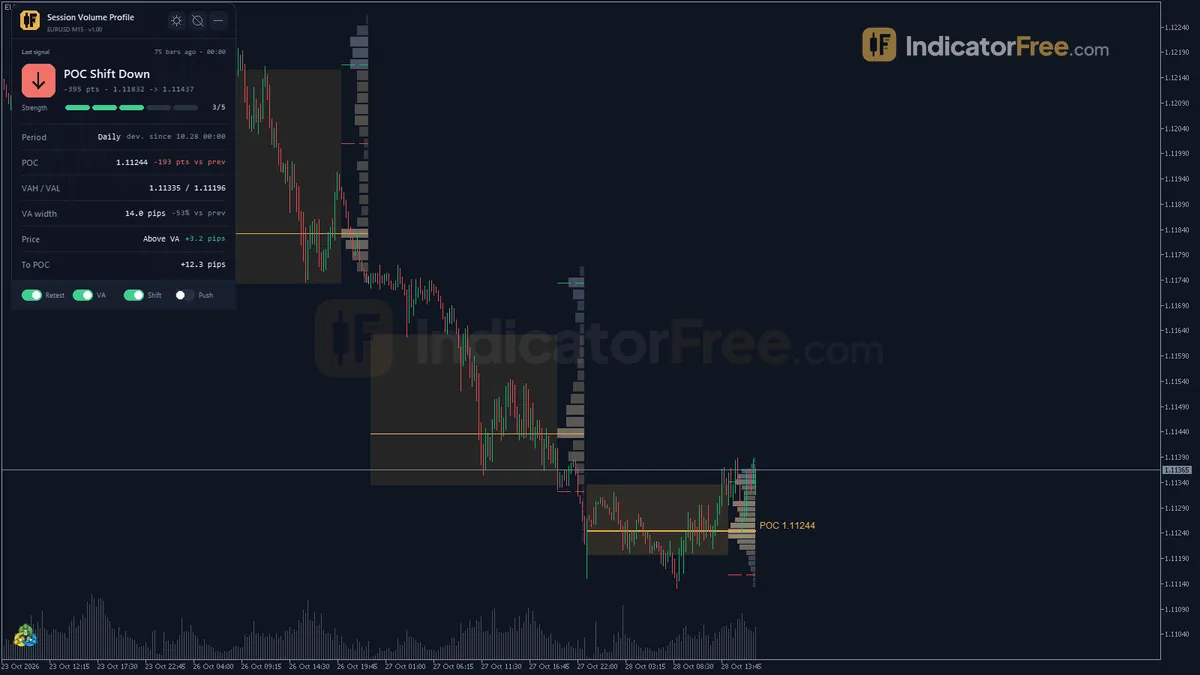
HVNCountsecondary high volume nodes (the busiest rows outside the value area) andLVNCountlow volume nodes (the quietest rows, not counting the top and bottom rows). - Session panel: shows the last POC or value area event, the developing POC, VAH and VAL, how far the POC moved and how the value area width changed against the previous period, and where price sits against the value area and POC in pips.
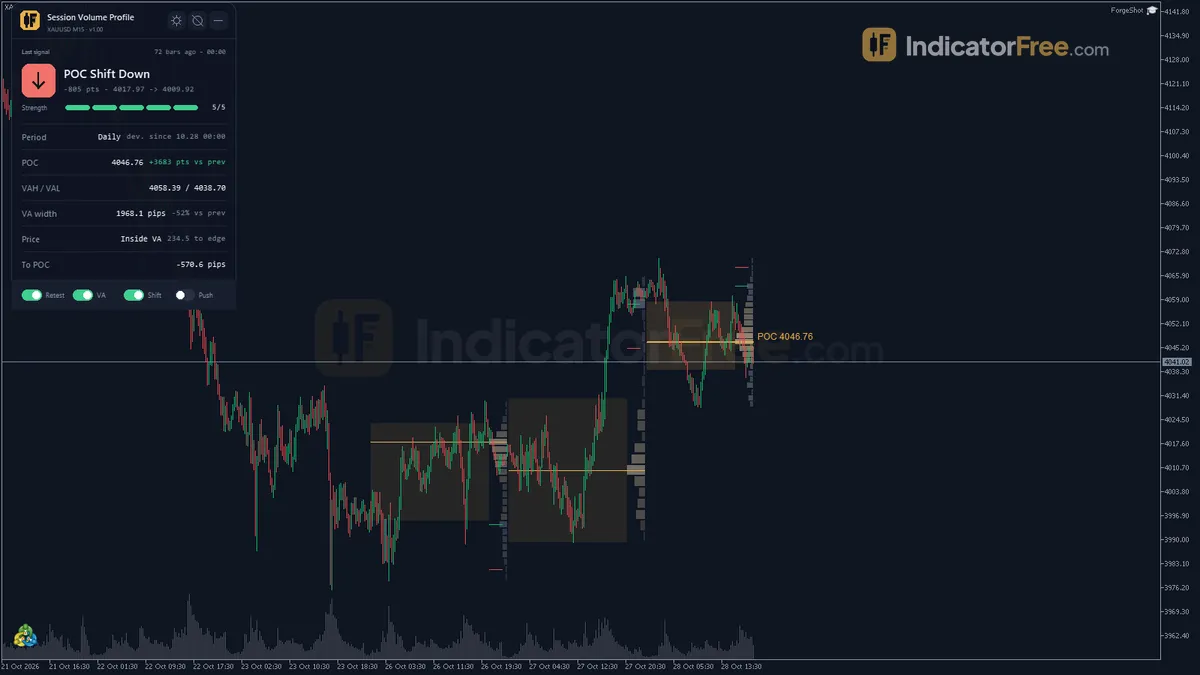
By default you see the newest 3 periods side by side, including the one still forming. You can show 1 to 8 with PeriodsToShow.
What the Lab checked, and what it did not
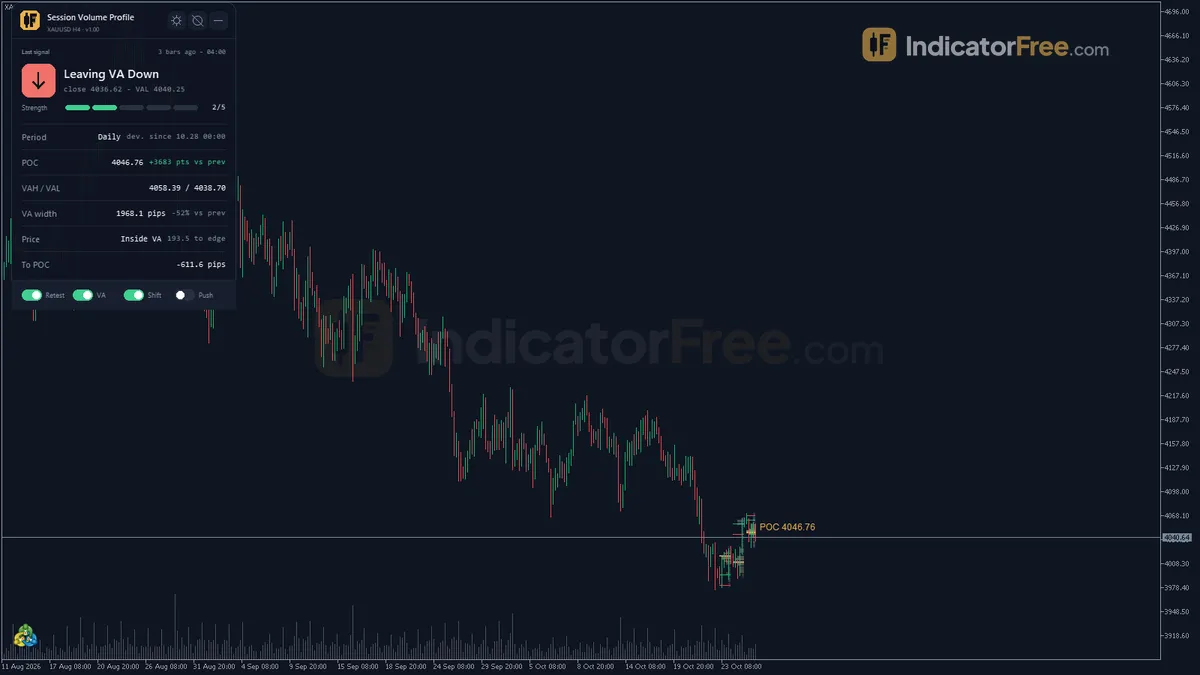
The Lab ran the 165 KB file on MT5 build 6230 and checked install, load and visual inspection on the H4 and M5 timeframes, on EURUSD, and zoomed out over several weeks of history. The Lab did not count alerts, measure repaint or backtest any rule. Having no repaint count does not mean the tool never repaints: the developing period redraws by design, as explained in how it works. For that reason this page gives no hit rate, and you should not read the alerts as tested trade signals.
How it works
- 1Splits history into daily, weekly, monthly or rolling-bar periods and loads bars of the chosen source timeframe for each.Inputs: PeriodMode, RollingBarsPerPeriod, ProfileSourceTF, PeriodsToShow
- 2Builds a volume profile per period with equal price rows, then finds the point of control and value area.
Value area holds ValueAreaPercent of period volume around the POCInputs: NumRows, UseRealVolumeIfAvailable, ValueAreaPercent - 3Marks high and low volume nodes and draws each period's histogram, with the current period updating on closed source bars.Inputs: HVNCount, LVNCount, HistogramMaxWidthBars
- 4Alerts when a close enters or leaves the value area, or lands within a buffer of the point of control.
Retest: abs(Close - POC) <= RetestBufferPoints x pointInputs: RetestBufferPoints, EnableRetestAlert, EnableVAEnterExitAlert - 5Compares the point of control of the last finished period with the one before, alerting on a large enough move.
Shift = (POC now - POC previous period) / point, alert if abs(Shift) >= POCShiftAlertPointsInputs: POCShiftAlertPoints, EnablePOCShiftAlert
Specifications
- Platform
- MetaTrader 5
- Version
- 1.00
- Type
- Indicator
- Window
- Main chart
- Draws
- 3 zones, 1 panel
- Alerts
- popup, push, sound
- Repaints
- not tested
- Inputs
- 27
- Tested on
- MT5 build 6230 · 2026-10-09
Repaint test
Repaint: not tested. This indicator draws zone, panel, which the IndicatorFree harness cannot read through iCustom().
IndicatorFree — tested 2026-10-09 · MT5 build 6230. Results come from historical data, not live trading, and do not guarantee future results.
What it draws
- Rectangles (Volume Histogram) drawn as chart objects, not buffers — they are not readable by iCustom() in an EA.
- Rectangles (Value Area) drawn as chart objects, not buffers — they are not readable by iCustom() in an EA.
- Rectangles (POC / HVN / LVN) drawn as chart objects, not buffers — they are not readable by iCustom() in an EA.
- An on-chart panel (Session); values shown in the panel are not exposed as buffers.
Inputs
| Input | Default | What it does |
|---|---|---|
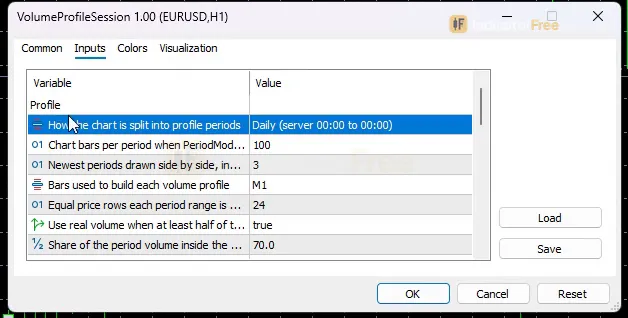
| PeriodMode | Daily (server 00:00 to 00:00) | How the chart is split into profile periods |
| RollingBarsPerPeriod | 100 | Chart bars per period when PeriodMode = Rolling bars (20-1000) |
| PeriodsToShow | 3 | Newest periods drawn side by side, incl. the developing one (1-8) |
| ProfileSourceTF | M1 | Bars used to build each volume profile |
| NumRows | 24 | Equal price rows each period range is split into (10-100) |
| UseRealVolumeIfAvailable | true | Use real volume when at least half of the bars have it, else tick volume |
| ValueAreaPercent | 70 | Share of the period volume inside the value area, in % (50-90) |
| HVNCount | 1 | Highest-volume rows outside the value area marked per period (0-5) |
| LVNCount | 1 | Lowest-volume rows marked per period, the two outer rows excluded (0-5) |
| HistogramMaxWidthBars | 12 | Length in chart bars of the longest histogram row, kept inside its period (5-40) |
| EnableRetestAlert | true | Alert when a closed bar comes back to the developing POC from outside |
| RetestBufferPoints | 20 | Distance from the POC in points that counts as a retest (5-200) |
| EnableVAEnterExitAlert | true | Alert when a closed bar enters or leaves the developing value area |
| EnablePOCShiftAlert | true | Alert when a period closes with its POC far from the previous period POC |
| POCShiftAlertPoints | 150 | POC distance in points between two periods that triggers the shift alert (20-2000) |
| AlertPopup | true | Show a popup Alert() window |
| AlertPush | false | Send a push notification to MetaTrader mobile |
| AlertSound | true | Play a sound |
| AlertSoundFile | alert.wav | Sound file from the MT5 Sounds folder |
| ColorHistogram | C'135,146,166' | Histogram rows (shade mixed with the chart background by row volume) |
| ColorPOC | C'232,176,75' | POC lines and the developing POC price label |
| ColorValueArea | C'232,176,75' | Value area box (mixed 85% into the chart background) |
| ColorHVN | C'18,183,106' | Secondary high volume node lines |
| ColorLVN | C'229,72,77' | Low volume node lines |
| Theme | Dark | Chart color theme |
| RestoreTheme | true | Restore the original chart colors when the indicator is removed |
| PanelScale | 1 | Panel size multiplier (0.6-2.0), DPI is applied automatically |
How to read it
Install
Copy the .ex5 file into MQL5/Indicators, refresh the Navigator and drag Session Volume Profile onto a chart.
How one period's profile is built
The indicator first splits history into periods with PeriodMode. The default is Daily (server 00:00 to 00:00), so a "session" means your broker's server day, not a London or New York session. For each period it loads bars from ProfileSourceTF (M1 by default) and splits the period's high-to-low range into NumRows equal price rows (24 by default). It then adds each bar's volume to those rows.
If at least half of the bars carry real volume and UseRealVolumeIfAvailable is on, it uses real volume. Otherwise it uses tick volume. The row with the most volume becomes the POC. The value area then grows out from the POC until it holds ValueAreaPercent of the period volume.
The drawing below labels each part of one finished profile.
The developing period changes, finished periods do not
The current period is rebuilt as new bars arrive. Its rows are deleted and redrawn on each new source bar or chart bar, and its value area and lines are redrawn with them. This means the developing POC, VAH and VAL can move until the period ends, and early in a day they rest on only a few bars.
A common misread is treating the developing POC at 02:00 server time as the day's POC. Check the panel's developing values and remember they are not final until the period closes.
The three alerts and how to read them
All three alerts check closed bars against the developing levels:
- POC retest (
EnableRetestAlert): a closed bar comes back from outside to withinRetestBufferPointsof the developing POC. The rule is abs(Close - POC) <= RetestBufferPoints x point, and the default is 20 points, which is 2 pips on a 5-digit pair. - Value area enter / exit (
EnableVAEnterExitAlert): a closed bar moves into the developing value area or out of it. - POC shift (
EnablePOCShiftAlert): when a period closes, its POC is compared with the previous period's POC. It alerts if the gap is at leastPOCShiftAlertPoints(150 points by default).
Alerts can show as a popup window (AlertPopup), a sound (AlertSound with AlertSoundFile) or a push notification to MetaTrader mobile (AlertPush, off by default). The panel also shows the last event.
The chart below shows where each alert would fire during one developing day.
Decision rules to try
The Lab has not tested these rules. They are a structured way to act on the alerts.
- Value area exit: count it as acceptance outside value only if the next closed bar also stays outside. A single close outside that is followed by a re-entry alert means the move was rejected.
- Accepted exit that re-enters: if price stays outside for several closed bars and then a re-entry alert fires, as at bars 6 to 9 in the chart above, treat it as a failed breakout and watch the developing POC as the next level inside the box.
- Value area re-entry: after a rejected exit, the developing POC is the first price to watch inside the box. If the bar that re-enters is already within the retest buffer, there is no room left, so skip it.
- POC retest: use it as a place to look for your own entry trigger, never as an entry by itself. Skip retests in the first hours of a daily period, when the developing POC is still moving with almost every bar.
- POC shift: a large shift says value has moved. Bias your next period toward the side the POC moved to, and treat the old POC as a reference level, not a magnet.
Inputs to change first
PeriodMode: Daily for intraday charts, Weekly or Monthly for H4 and above. Rolling bars usesRollingBarsPerPeriodchart bars per period (20-1000) when you want a profile that ignores calendar boundaries.NumRows(10-100): more rows give finer price levels but a noisier POC. Fewer rows give broader, steadier zones.RetestBufferPointsandPOCShiftAlertPointsare in points, so the same number means very different distances on EURUSD, a JPY pair or gold. Check them for every symbol you attach it to.HVNCount/LVNCount(0-5): set either to 0 if the extra lines clutter the chart.Themerecolors the chart (Dark by default).RestoreThemebrings your original colors back when you remove the indicator.
Installation
- 1Download VolumeProfileSession.ex5 from the button above (Google Drive).
- 2In MetaTrader 5: File → Open Data Folder → MQL5 → Indicators. Copy VolumeProfileSession.ex5 there.
- 3Restart MT5 or right-click Indicators in Navigator → Refresh.
- 4Drag Session Volume Profile onto a chart. For push alerts, enable "Allow push notifications" under Tools → Options → Notifications.
- Tested on MT5 build 6230.
Key terms and guides
- Value area
- The value area is the price range where about 70% of a period's volume traded. Its top is the value area high (VAH), its bottom is the value area low (VAL), and the point of control (POC) sits inside it.
- volume profile poc
- The volume profile POC (point of control) is the single price level where the most volume traded over the range you selected. It shows the price the market accepted most, and traders use it as a reference level for reactions and targets.
- High volume node
- A high volume node (HVN) is a price level or narrow price zone where much more volume traded than at the prices around it. It shows as a thick bulge on a volume profile, and price often slows, stalls or turns when it comes back there.
- Position Size
- Position size is how many units or lots you buy or sell in one trade. You set it from the money you are willing to lose and the distance to your stop-loss, so a stop that gets hit costs a planned amount.
- Volume profile
- Volume profile is a chart indicator that shows how much volume traded at each price over a chosen period. It draws this as a sideways histogram, so you can see which prices the market accepted and which ones it moved through quickly.
- Price Swing
- A price swing is one move in a single direction, from a turning low to a turning high or the reverse. You measure it in pips from one swing point to the next.
More on this subject: Volume & order flow guide, terms and tools
User reviews
No reviews yet. Members who download the tool can review it here.
Sign in and download the tool to review it.
Build a checklist with it
Session Volume Profile does one job on the chart: zone / level. Put it on the same chart as the tools below and the IndicatorFree panels merge into one checklist card, ordered trend, zone, signal, risk.
- Trend / contextEMA Lead GaugeAdds the trend side: which way the market leans before you act on Session Volume Profile.
- Entry signalInside Bar BreakoutAdds the entry signal: the moment to act once Session Volume Profile has set the scene.
The Lab has not tested these combinations. Each tool is tested on its own; the card only lines up what each one says. Free members get 2 new tools a day. If one has to wait until tomorrow, install BlackBox to raise the limit to 5 a day (20 on a live account).
FAQ
Does Session Volume Profile repaint?
Repaint: not tested. This indicator draws zone, panel, which the IndicatorFree harness cannot read through iCustom().
Why can’t my EA read the zones?
Zones and the panel are chart objects, not indicator buffers, so iCustom() does not return them.
How do I get alerts on my phone?
Enter your MetaQuotes ID under Tools → Options → Notifications, tick "Enable push notifications", and keep the push alert input on.
Does it use real volume on stocks or futures?
Yes, if your broker's feed carries it. With `UseRealVolumeIfAvailable` on, a period uses real volume when at least half of its bars have it. If fewer than half do, that period falls back to tick volume, so a feed with patchy real volume can give you tick-volume profiles.
Why is my POC different from another volume profile tool?
The POC depends on `NumRows`, on `ProfileSourceTF`, on whether real or tick volume is used, and on where the period starts (server 00:00 by default). Change any one of these and the busiest row can move.
How do I get the alerts on my phone?
Set `AlertPush` to true. Push notifications only arrive if your terminal is linked to MetaTrader mobile through your MetaQuotes ID in the terminal options.
Can I see more than three days at once?
Yes. `PeriodsToShow` accepts 1 to 8 periods, including the developing one. `HistogramMaxWidthBars` keeps each histogram inside its own period so they don't overlap.
Why does the developing profile look thin after midnight?
In Daily mode a new period starts at server 00:00. Just after that, the new profile is built from only a few source bars over a narrow range, so the histogram is short and the POC can still move. It fills in as the day goes on, and the previous days' profiles stay on the chart next to it as long as `PeriodsToShow` is 2 or more.
Changelog
- 1.00Initial release: automatic Daily, Weekly, Monthly or rolling-bar volume profile with Point of Control, Value Area, secondary High/Low Volume Node markers, and a dashboard comparing the developing period against the. · 2026-10-09
Final verdict
Lab verdict
Session Volume Profile does the job a session profile should do. It draws the period's histogram, POC, value area and HVN/LVN lines on their own every day, week or month. It keeps the last periods side by side so you can see value migrating, and it puts the developing levels and the POC shift into one panel.
The alerts trigger only on closed bars, so a wick that pokes through the box does not set them off. It loads on MT5 build 6230 and the file is small. There is no Lab hit rate behind any alert, though, so its strength is showing you where price is, not telling you when to trade.
Limits to know before you download
- The developing period redraws by design. Anything you read from it early in the period is provisional.
- On feeds without real volume it falls back to tick volume, which counts price updates, not contracts traded.
- The default periods follow broker server midnight, so the daily profile depends on your broker's time zone.
- Profiles follow only the four
PeriodModeoptions (Daily, Weekly, Monthly, Rolling bars). There is no input for a hand-picked range. - The detail of each profile is limited by the source history your terminal has (M1 by default).
Use it or skip it
The table below sums up when the tool fits your trading and when it does not.
- –You trade around levels and want daily or weekly POC and value area drawn for you
- –You want to see if today's value is building above, inside or below yesterday's
- –You want closed-bar alerts at value area edges and POC instead of watching the screen
- –You want buy/sell arrows with a tested win rate
- –You need a profile over a range you choose yourself
- –You trade off the developing POC minutes after the period opens
Settings to start with
Keep the defaults on M5 to M15 with Daily periods first. If you move to H4 with Weekly periods, try NumRows 40 and POCShiftAlertPoints 300 as a starting point. The Lab has not tested these values, so compare them with the defaults on your own symbol. On symbols with large point values, scale RetestBufferPoints up until the buffer covers a few pips, not a fraction of one.
Pairing idea
This tool tells you where volume sat, but not when a strong move hits those levels. Climax Volume can flag a buying or selling climax bar that prints at the VAH, VAL or an LVN, so you get a location and a reaction in one view. This is an idea to try, and the Lab has not tested the pair.