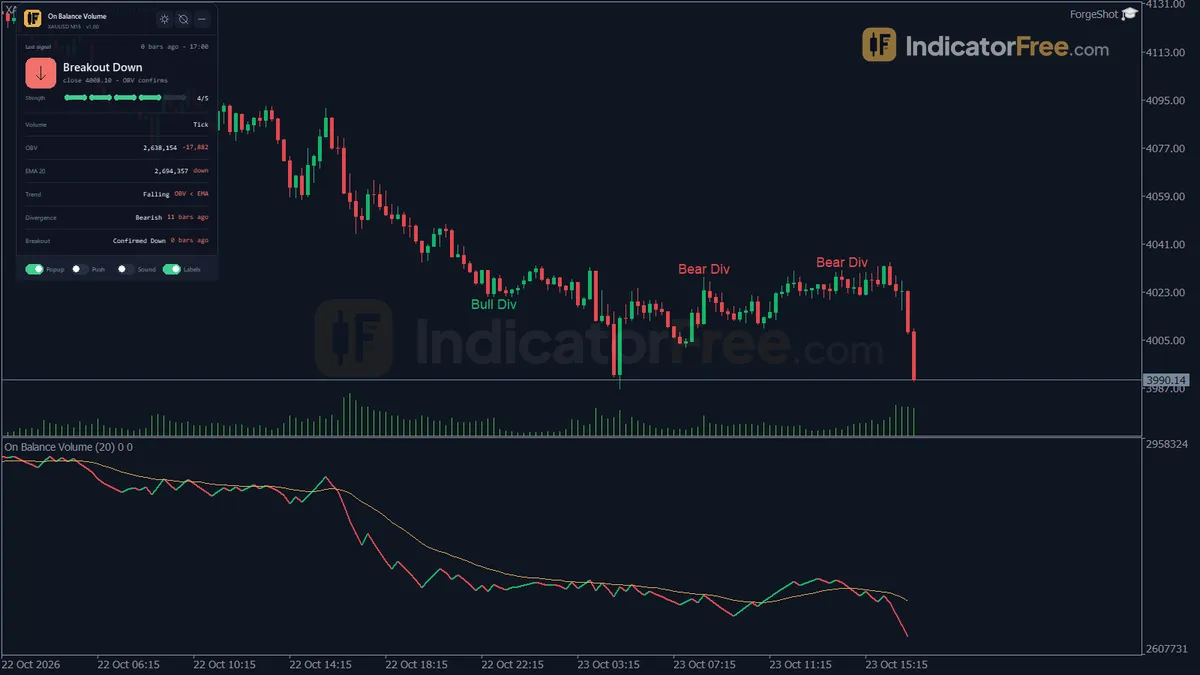
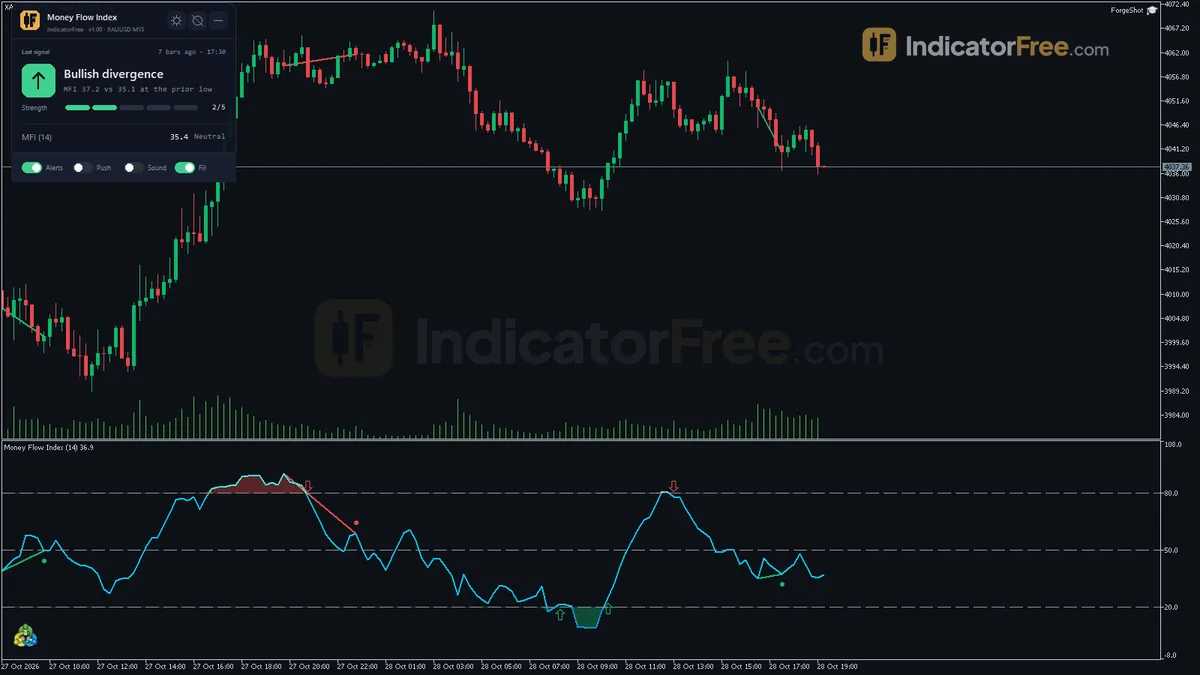
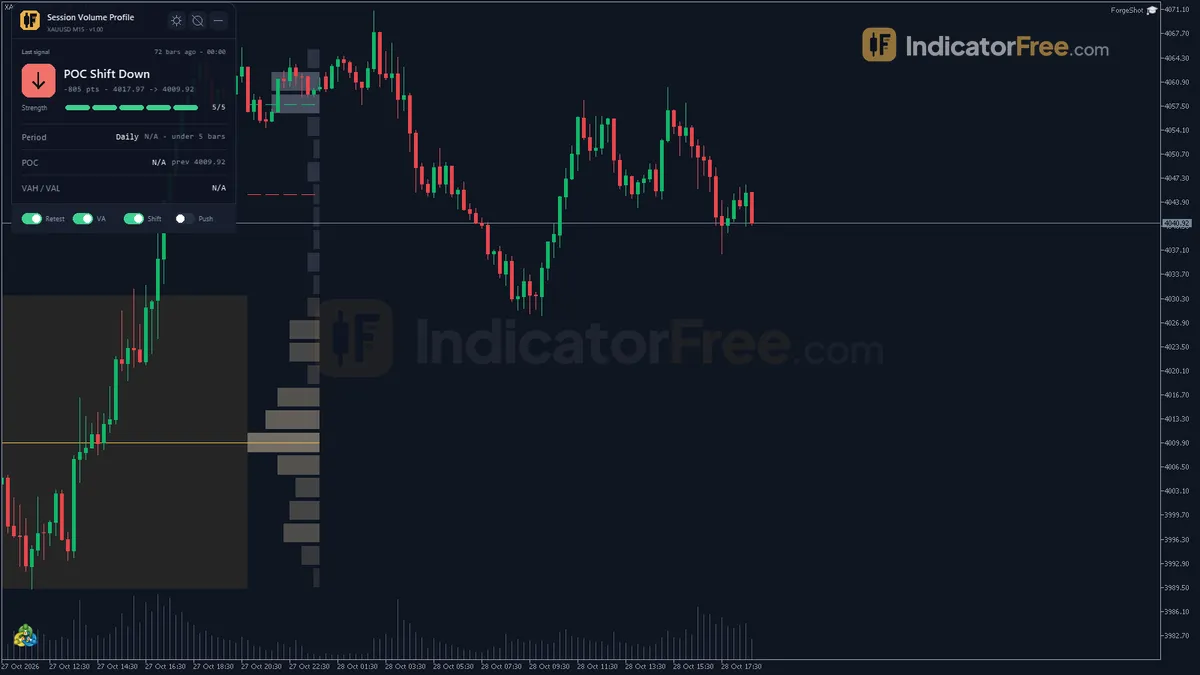
"Low Volume Node"
Free Low Volume Node indicator for MT5: marks volume-profile valleys as zones, with sweep and rejection alerts. Lab-checked on MT5 build 6230.
- Repainted
- Not tested
- Signals / week
- —
- Tested on
- —
- Tested
- 2026-10-05
Overview
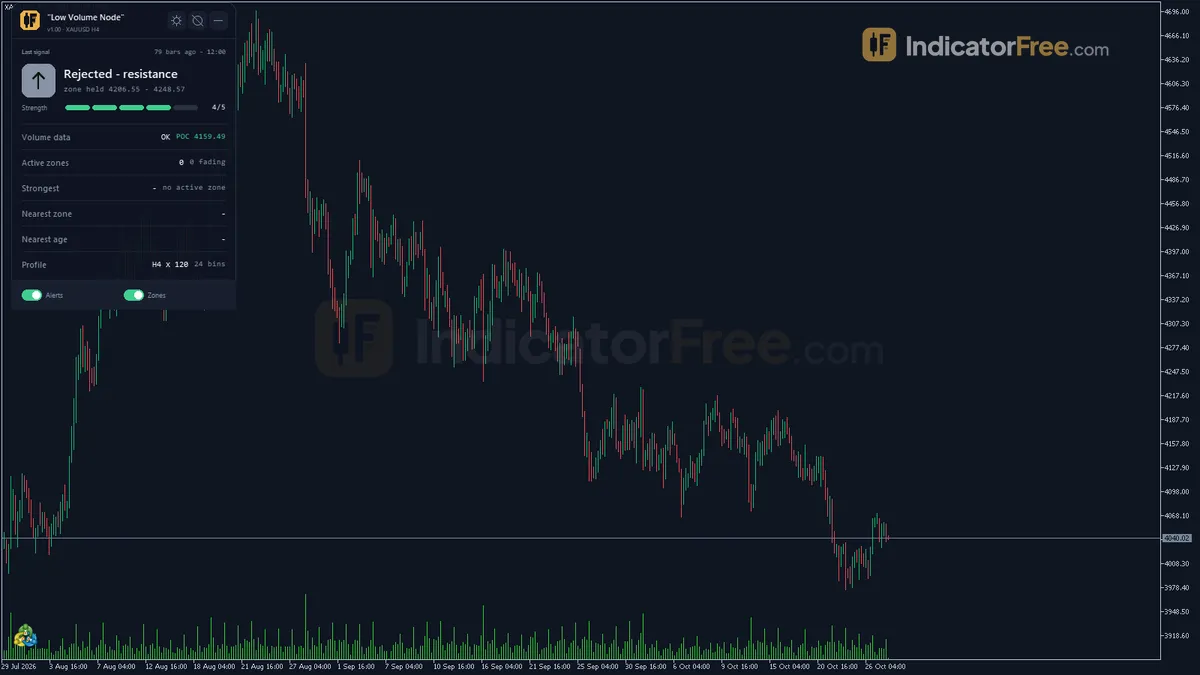
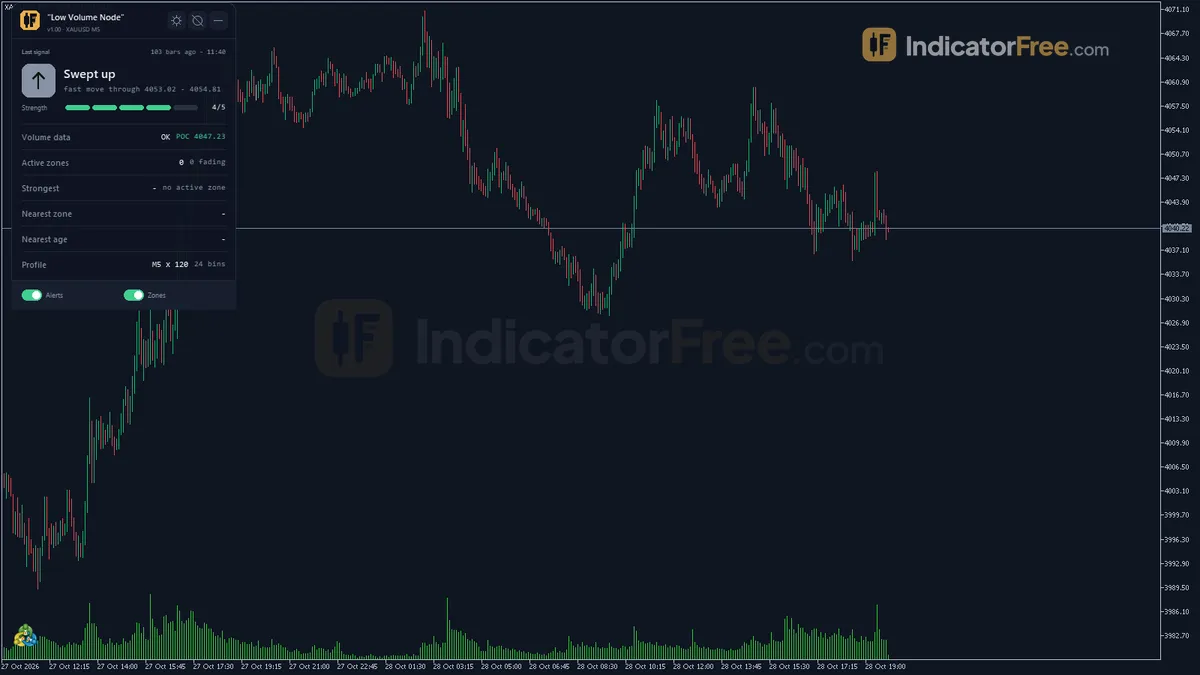
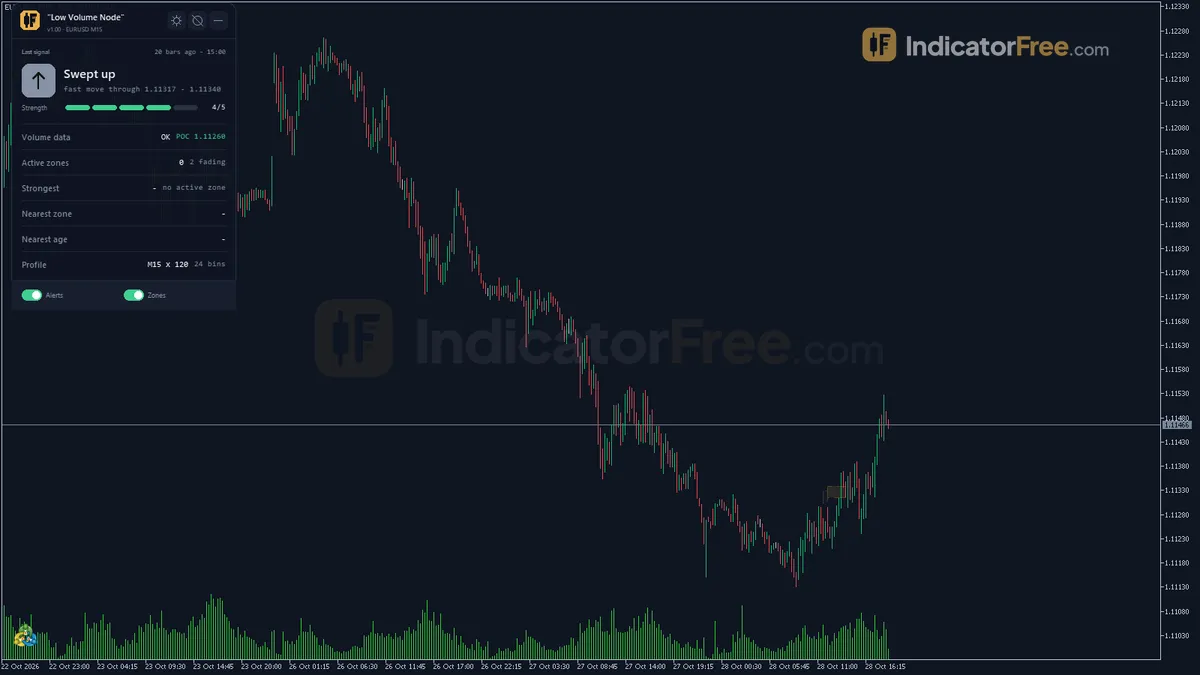
The free Low Volume Node indicator marks volume-profile valleys (a thin bin with a busy peak on both sides) as zones on your MT5 chart and alerts on sweeps and rejections. Built for traders who use volume-by-price levels. Lab-run v1.00 with default inputs on build 6230 on 2026-10-05, on M5, H4 and EURUSD charts.
What a low volume node is
A low volume node (LVN) is a price level in a volume profile where little trading took place.
What it draws on the chart
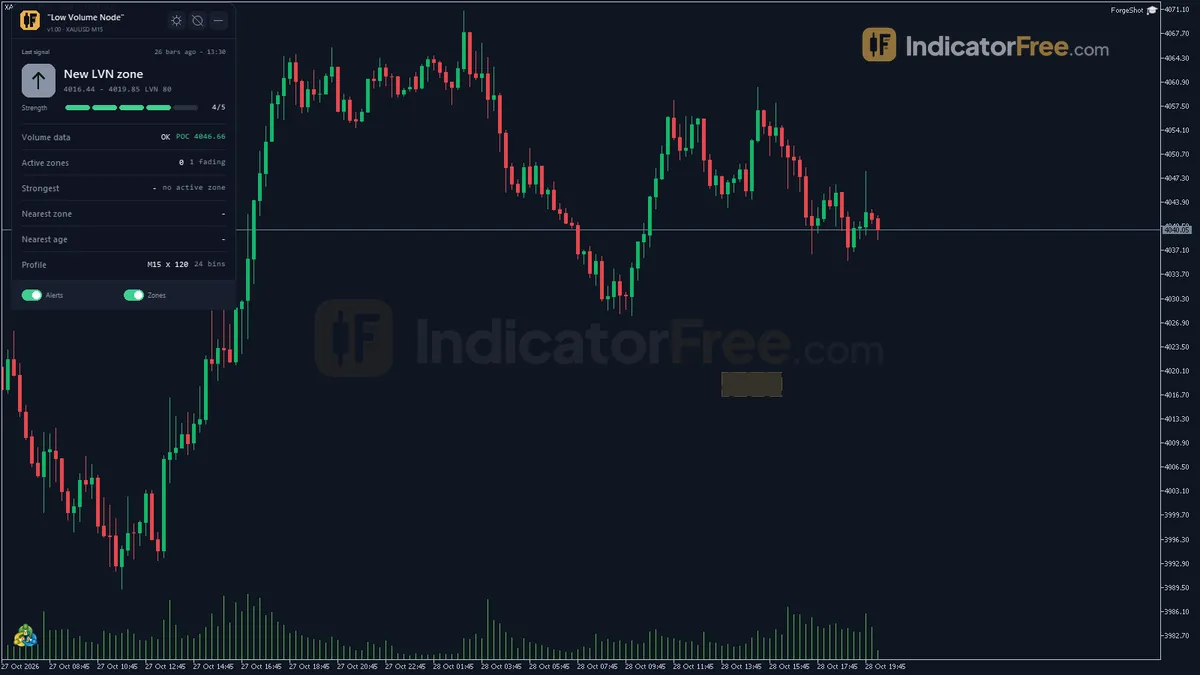
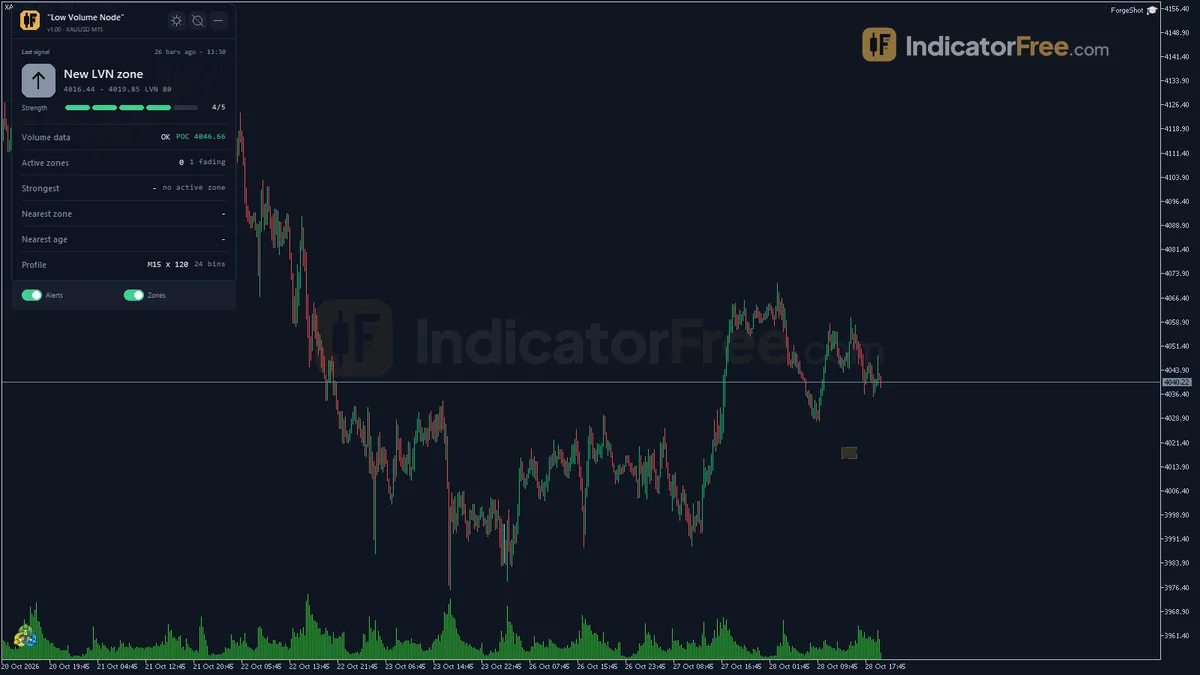
- LVN zones: rectangles in the main chart window, not a subwindow. The fill blends with the background according to the zone's Strength, and each active zone carries an
LVN <strength>label. Up to 6 zones are shown by default, strongest first. - Filled zones: each time a new ProfileTimeframe bar closes, the profile is rebuilt. A zone that no longer appears in it is marked Filled. Its volume has filled in, or it has left the window. A Filled zone is drawn faded and dashed, then deleted 30 profile-timeframe bars later (FadeOutBars).
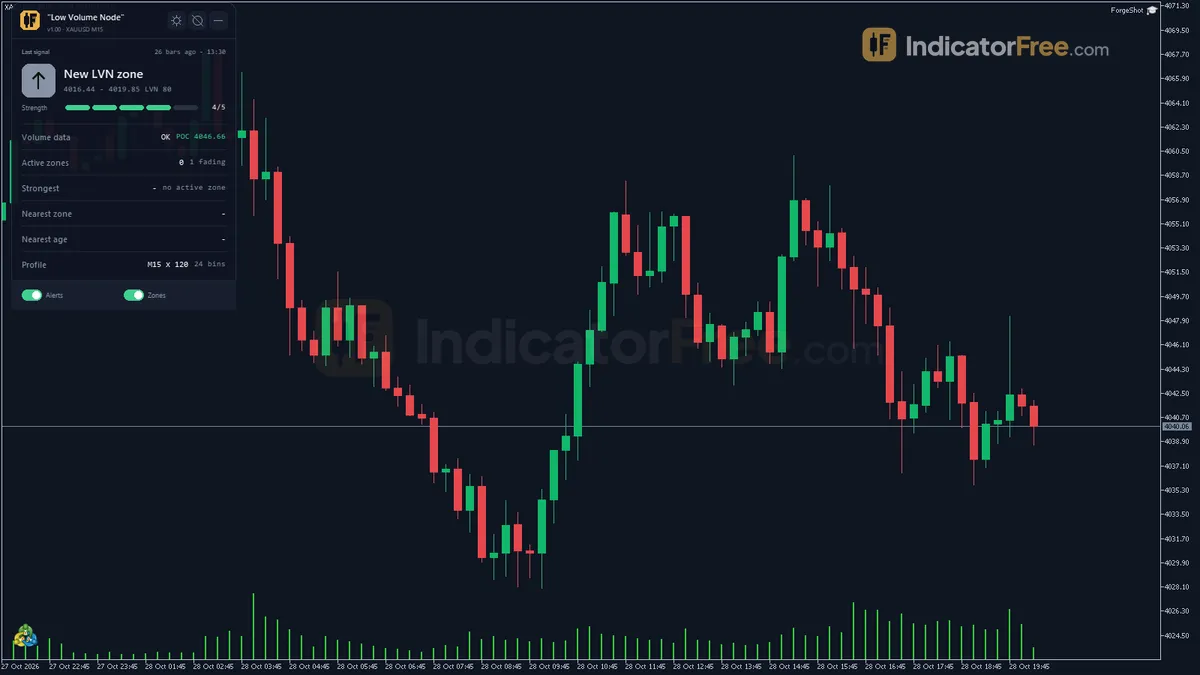
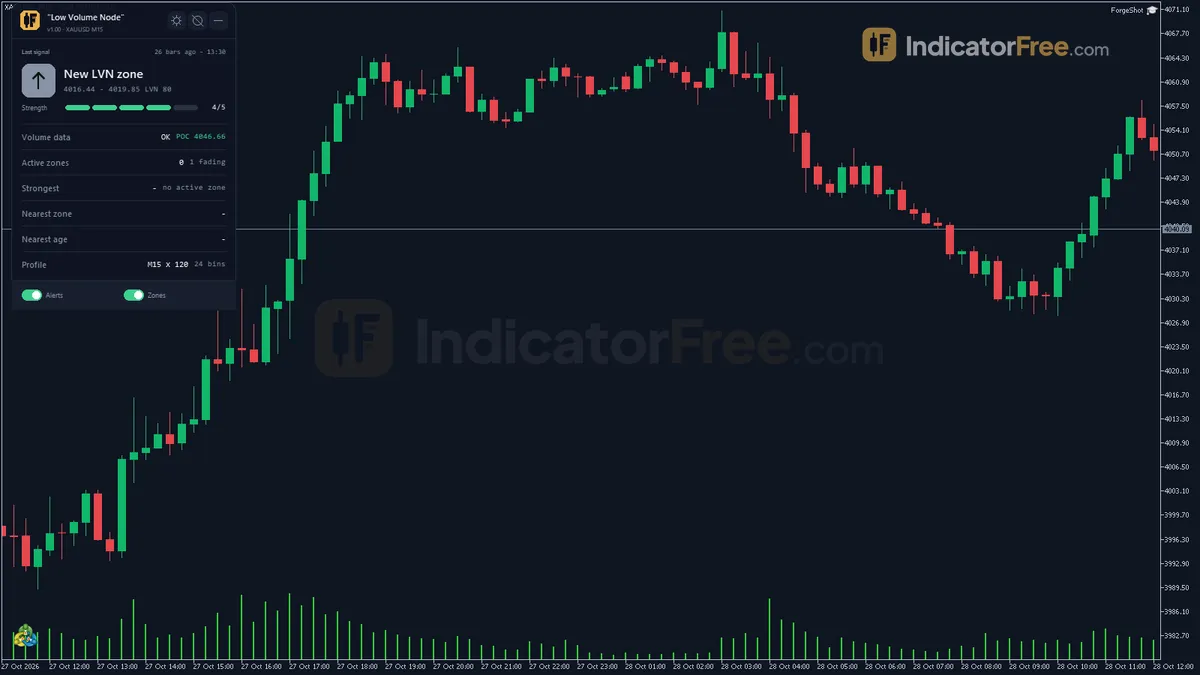
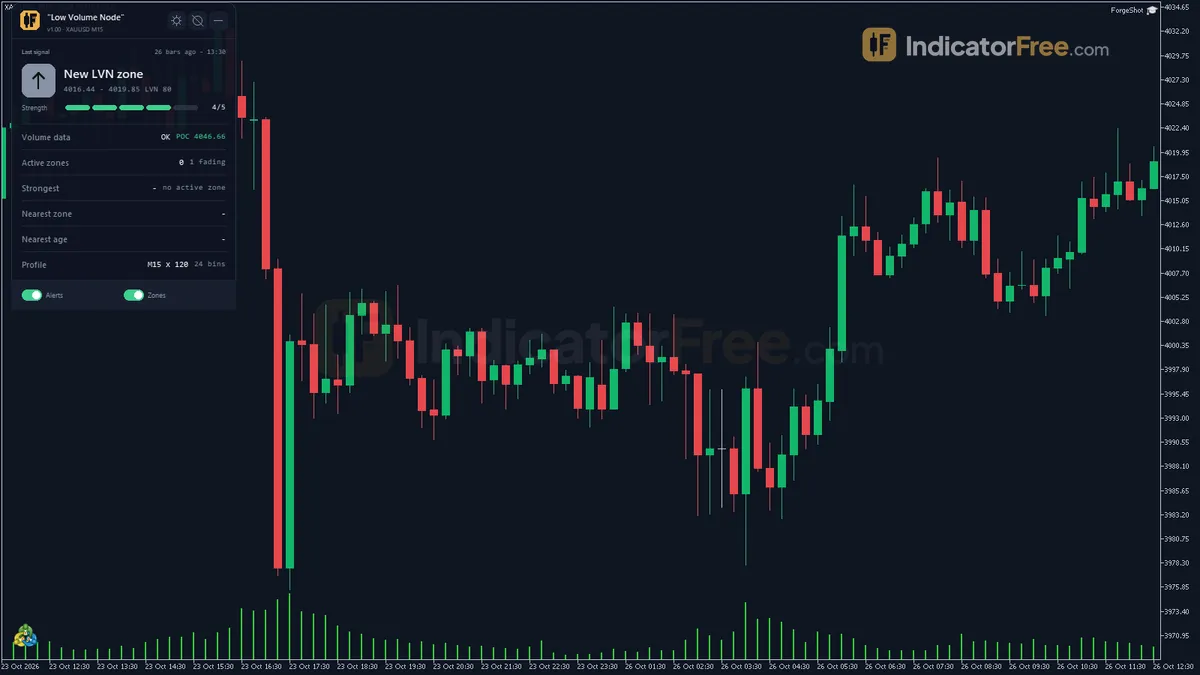
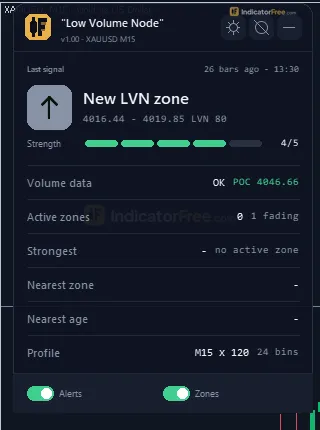
- Zones panel: the last LVN event, the volume data status, the active zone count, the strongest zone, the distance to the nearest zone in pips and in ATR, that zone's age in bars, and the POC price.
What the Lab checked, and what it did not measure
The Lab ran the 159.9 KB file on MT5 build 6230 with default inputs. It installed, and drew zones and the panel on M5 and H4 charts and on EURUSD, and kept them across several weeks of history.
The Lab facts for this tool contain no signal statistics. There is no count of sweeps or rejections, no follow-through rate and no repaint count. Treat the sweep and rejection alerts as prompts to look at the chart, not as tested entries.
How it works
- 1Builds a volume profile from the last window of closed bars, splitting the price range into bins.
Bin volume = sum of bar tick volume / bins the bar spansInputs: ProfileTimeframe, WindowBars, NumBins, MinBinSizePoints, MaxSpanBins - 2A low volume node is a bin with little volume and a high-volume bin on both sides. Adjacent bins merge.
Bin volume <= LVNThresholdPct x max binInputs: LVNThresholdPct, HVNPeakPct - 3Zones match by overlap, strength is how far below the peak they sit, the strongest show and filled ones fade.
Strength = 1 - lowest bin volume / max bin volumeInputs: MaxZonesShown, FadeOutBars - 4A fast big-body close through the zone is a sweep. Closes staying on the entry side mean rejection.
Sweep body >= FastMoveBodyATRMult x ATRInputs: ATRPeriod, FastMoveBodyATRMult, RetestConfirmBars
Specifications
- Platform
- MetaTrader 5
- Version
- 1.00
- Type
- Indicator
- Window
- Main chart
- Draws
- 1 zone, 1 panel
- Alerts
- popup, push, sound
- Repaints
- not tested
- Inputs
- 24
- Tested on
- MT5 build 6230 · 2026-10-05
Repaint test
Repaint: not tested. This indicator draws zone, panel, which the IndicatorFree harness cannot read through iCustom().
IndicatorFree — tested 2026-10-05 · MT5 build 6230. Results come from historical data, not live trading, and do not guarantee future results.
What it draws
- Rectangles (Low Volume Nodes) drawn as chart objects, not buffers — they are not readable by iCustom() in an EA.
- An on-chart panel (Zones); values shown in the panel are not exposed as buffers.
Inputs
| Input | Default | What it does |
|---|---|---|
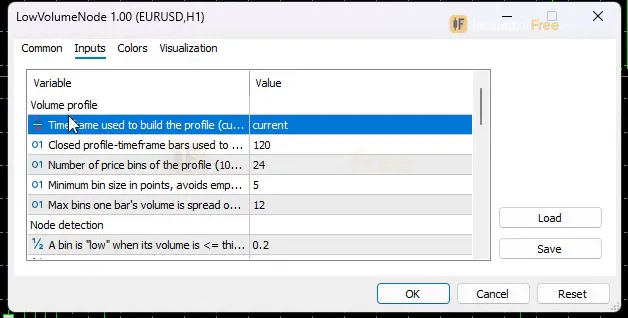
| ProfileTimeframe | CURRENT | Timeframe used to build the profile (current = chart timeframe; higher = HTF nodes) |
| WindowBars | 120 | Closed profile-timeframe bars used to build the profile (30-500) |
| NumBins | 24 | Number of price bins of the profile (10-60) |
| MinBinSizePoints | 5 | Minimum bin size in points, avoids empty bins in a very tight range (1-50) |
| MaxSpanBins | 12 | Max bins one bar's volume is spread over; wider bars are clamped around their body center (3-30) |
| LVNThresholdPct | 0.2 | A bin is "low" when its volume is <= this fraction of the POC bin volume (0.05-0.5) |
| HVNPeakPct | 0.5 | A bin is a "peak" when its volume is >= this fraction of the POC volume; a peak is required on both sides (0.2-0.9) |
| MaxZonesShown | 6 | Max active zones drawn and monitored, strongest first (1-15) |
| FadeOutBars | 30 | Profile-timeframe bars a Filled zone stays faded on the chart before deletion (5-200) |
| ATRPeriod | 14 | ATR period (profile timeframe) for the fast sweep threshold (5-50) |
| FastMoveBodyATRMult | 0.5 | Min candle body, in ATR, for a fast sweep through a zone (0.1-2.0) |
| RetestConfirmBars | 1 | Bars that must not close through the zone after a rejection (1-5) |
| AlertOnNewZone | true | Alert when a new Low Volume Node zone forms |
| AlertOnSweep | true | Alert when a closed bar sweeps quickly through a zone |
| AlertOnReject | true | Alert when a zone rejects price (acts as support / resistance) |
| AlertPopup | true | Use popup alerts |
| AlertPush | false | Use push notifications |
| AlertSound | false | Play a sound |
| ZoneColor | C'232,176,75' | Zone color (fill is blended with the chart background by Strength) |
| ShowZoneLabels | true | Show the "LVN <strength>" label on each active zone |
| ShowPanel | true | Show the panel |
| PanelScale | 1 | Panel size multiplier (DPI is applied automatically) |
| Theme | Dark | Chart color theme |
| RestoreTheme | true | Restore the original chart colors when the indicator is removed |
How to read it
Install: copy the file into MQL5/Indicators, restart MT5 or refresh the Navigator, then drag Low Volume Node onto a chart.
How a zone forms and becomes a signal
The flow below follows one zone from the profile build to an alert. Each step uses only the conditions in the tool's own logic.
- 1Build the profileLast WindowBars closed ProfileTimeframe bars, split into NumBins price bins; each bar's tick volume is shared across the bins it spans
- 2Find the valleyBin volume <= LVNThresholdPct x POC bin, with a bin >= HVNPeakPct x POC on both sides; neighbouring low bins merge
- 3Rank and drawStrength = 1 - lowest bin / max bin; the strongest MaxZonesShown zones are drawn and monitored
- 4SweepA closed bar with body >= FastMoveBodyATRMult x ATR closes through the zone
- 5RejectionPrice enters the zone but closes stay on the entry side for RetestConfirmBars bars
Reading the three events
- New zone: a valley has appeared in the latest profile. Nothing has happened at it yet. Treat it as a level to watch.
- Sweep: a large-bodied closed candle went straight through the zone. At default settings the body is at least 0.5 ATR, using a 14-period ATR on the profile timeframe. This fits the usual idea that thin areas get crossed quickly. Your trade question becomes: where is the next high-volume area on the far side?
- Rejection: price entered the zone but did not close through it for 1 bar (RetestConfirmBars). The zone acted as support or resistance.
The chart below shows what a rejection looks like. Candle 4 crossed the thin zone with a 27-pip body (the sweep shape). Candle 10 wicked down to 1.0857, inside the zone, and closed at 1.0864, above it. Candle 11 did not close through, so the rejection is confirmed.
A decision rule for each event
- Rejection: consider a trade in the direction of the rejection only if the zone's label shows Strength 0.9 or higher (untested starting point). Also check that the panel's distance in ATR to the next zone gives the trade room. If the next zone is less than about 1 ATR away, skip it. That threshold is a rule of thumb, not a Lab result.
- Sweep: do not chase the sweep candle. Use it as a sign that the thin area is done. Look for the next busy area or POC as a target or reaction point.
- New zone: no action. Add the level to your plan.
A common misread
A faded, dashed rectangle is not an active zone. It is a Filled zone (see What it draws on the chart above). Only active zones (up to MaxZonesShown) are monitored for sweeps and rejections. Look for the solid fill and the LVN <strength> label. Also check the panel's active zone count before you trust a box.
Inputs to change first
- ProfileTimeframe (default CURRENT): this has the biggest effect. Set it higher than your chart to see higher-timeframe nodes. Starting point not tested by the Lab: on an M5 chart, try H1 and compare it with the default.
- LVNThresholdPct (default 0.2, range 0.05-0.5): lower values mark fewer, deeper valleys. At 0.2, every marked zone has a strength of at least 0.8. Untested starting point: 0.15 if you see too many zones.
- HVNPeakPct (default 0.5, range 0.2-0.9): raise it to require larger peaks on both sides. Lower it if no zones appear in a choppy range.
- WindowBars / NumBins (120 / 24): more bars give a longer memory, and more bins give finer but noisier zones.
- MaxZonesShown (6): untested starting point: 3 for a cleaner chart.
- FastMoveBodyATRMult (0.5): raise it if sweep alerts fire on ordinary candles.
Alerts
There are three alert types. AlertOnNewZone, AlertOnSweep and AlertOnReject are all on by default. They are delivered as a popup in the MT5 Alerts window (AlertPopup, on), a push notification to the MT5 mobile app (AlertPush, off; this needs your MetaQuotes ID set in the terminal) and a sound (AlertSound, off). Sweep alerts are based on closed bars.
Installation
- 1Download LowVolumeNode.ex5 from the button above (Google Drive).
- 2In MetaTrader 5: File → Open Data Folder → MQL5 → Indicators. Copy LowVolumeNode.ex5 there.
- 3Restart MT5 or right-click Indicators in Navigator → Refresh.
- 4Drag "Low Volume Node" onto a chart. For push alerts, enable "Allow push notifications" under Tools → Options → Notifications.
- Tested on MT5 build 6230.
Key terms and guides
- Order Fill
- An order fill is the moment your buy or sell order is actually executed: it is matched at a real price and opens (or closes) a position, for the full size or only part of it.
- Horizontal level
- A horizontal level is a price where the market has turned more than once, drawn as a flat line across the chart. Traders use it to plan entries, stop losses and targets.
- High volume node
- A high volume node (HVN) is a price level or narrow price zone where much more volume traded than at the prices around it. It shows as a thick bulge on a volume profile, and price often slows, stalls or turns when it comes back there.
- Position Size
- Position size is how many units or lots you buy or sell in one trade. You set it from the money you are willing to lose and the distance to your stop-loss, so a stop that gets hit costs a planned amount.
- Profile
- A profile in trading is a saved set of chart windows on your platform: which symbols are open, their timeframes, indicators and layout. The word also appears in volume profile, market profile and risk profile, which mean different things.
- Volume profile
- Volume profile is a chart indicator that shows how much volume traded at each price over a chosen period. It draws this as a sideways histogram, so you can see which prices the market accepted and which ones it moved through quickly.
More on this subject: Volume & order flow guide, terms and tools
User reviews
No reviews yet. Members who download the tool can review it here.
Sign in and download the tool to review it.
Build a checklist with it
"Low Volume Node" does one job on the chart: entry signal. Put it on the same chart as the tools below and the IndicatorFree panels merge into one checklist card, ordered trend, zone, signal, risk.
- Trend / contextEMA Lead Gauge"Low Volume Node" tells you when; this tells you which way the market leans, so you can skip signals against it.
- Zone / levelOrder Block LocatorShows the zones and levels, so you can see whether a signal from "Low Volume Node" fires at a level worth trading.
The Lab has not tested these combinations. Each tool is tested on its own; the card only lines up what each one says. Free members get 2 new tools a day. If one has to wait until tomorrow, install BlackBox to raise the limit to 5 a day (20 on a live account).
FAQ
Does "Low Volume Node" repaint?
Repaint: not tested. This indicator draws zone, panel, which the IndicatorFree harness cannot read through iCustom().
Why can’t my EA read the zones?
Zones and the panel are chart objects, not indicator buffers, so iCustom() does not return them.
How do I get alerts on my phone?
Enter your MetaQuotes ID under Tools → Options → Notifications, tick "Enable push notifications", and keep the push alert input on.
Does the Low Volume Node indicator repaint?
The profile is built only from closed bars, and the sweep check uses closed bars. Zones can still become Filled, as the overview explains. The Lab facts contain no repaint count for this tool.
Why does my chart show no zones?
A zone needs a low bin with a high-volume peak on both sides. A one-way trend or a narrow range may have no such valley. Try lowering HVNPeakPct, or raise WindowBars so the profile covers more history.
Can I see H4 nodes while trading on M15?
Yes. Set ProfileTimeframe to H4 and the profile is built from closed H4 bars, while the zones are drawn on your M15 chart. FadeOutBars and ATRPeriod are then also counted in H4 bars.
How do I get the alerts on my phone?
Set AlertPush to true and enter your MetaQuotes ID in the MT5 terminal's notification settings. New-zone, sweep and rejection alerts will then reach the MT5 mobile app.
What does the number in the LVN label mean?
It is the zone's Strength: 1 minus the zone's lowest bin volume divided by the largest bin volume. A value closer to 1 means a deeper, emptier valley.
Changelog
- 1.00Initial release: closed-bar volume-by-price profile with a valley-between-two-peaks filter so only true low volume nodes are marked, not the thin tail of the profile. · 2026-10-09
Final verdict
The Lab's judgement
Low Volume Node finds valleys between two peaks and watches the strongest 6 for a sweep or a rejection. The two-peak filter is its real strength. It stops the tool from marking the thin tail of the profile, which is not a true node. The Strength label and the panel's distance in ATR let you judge a zone without opening a profile. It ran on MT5 build 6230 on M5 and H4 charts.
Its limits
- Tick volume only. Bin volume comes from bar tick volume. On forex and CFDs this counts price updates, not traded contracts, so the profile is an approximation.
- Volume is spread evenly. Each bar's volume is divided across the bins it covers, and wide bars are clamped to MaxSpanBins around the body center. It does not use tick-level data, so the edges of a zone are estimates.
- Zones change by design. See Filled zones in the overview.
- No measured edge. See What the Lab checked, and what it did not measure in the overview.
Use it or skip it
The comparison below sums up who gets value from it.
- –You already trade volume-by-price levels
- –You want higher-timeframe nodes on a lower-timeframe chart
- –You want alerts instead of watching levels yourself
- –You will confirm rejections with your own structure or trend read
- –You need real exchange volume, not tick volume
- –You want a buy/sell arrow with a tested win rate
- –You need fixed levels that never update
- –You trade from a single alert without checking context
Settings to start with
Start with the defaults so you learn how the zones behave. Then raise ProfileTimeframe one or two steps above your chart, and cut MaxZonesShown to 3 if the chart feels busy. These are untested starting points, so compare them with the defaults. Keep the popup alert on and turn on push only after a few days, once you trust which alerts matter to you.
A pairing idea
This tool shows the gaps but not the busy areas around them. Try Session Volume Profile for the daily or weekly POC and value area. You can also use Fixed Range Profile to check one swing by hand. Together they show where a sweep is likely to run to. This is an idea to try: the Lab has not tested the pair.