On Balance Volume
Free On Balance Volume indicator for MT5: OBV with EMA signal, divergence labels and breakout check. 0 of 158 signals changed in the Lab repaint test.
- Repainted
- 0 / 158
- Signals / week
- —
- Tested on
- EURUSD M15
- Tested
- 2026-10-09
Overview
On Balance Volume for MT5 draws the OBV line and an EMA signal line in a separate sub-window. It labels price/OBV divergences on the price chart and tells you whether a price breakout is backed by OBV. In the Lab's repaint test on EURUSD M15, 0 of 158 logged signals changed after they appeared.
It helps traders who want a volume check before trusting a breakout or a trend move, mainly when price is pushing into new highs or lows.
What the indicator puts on your chart
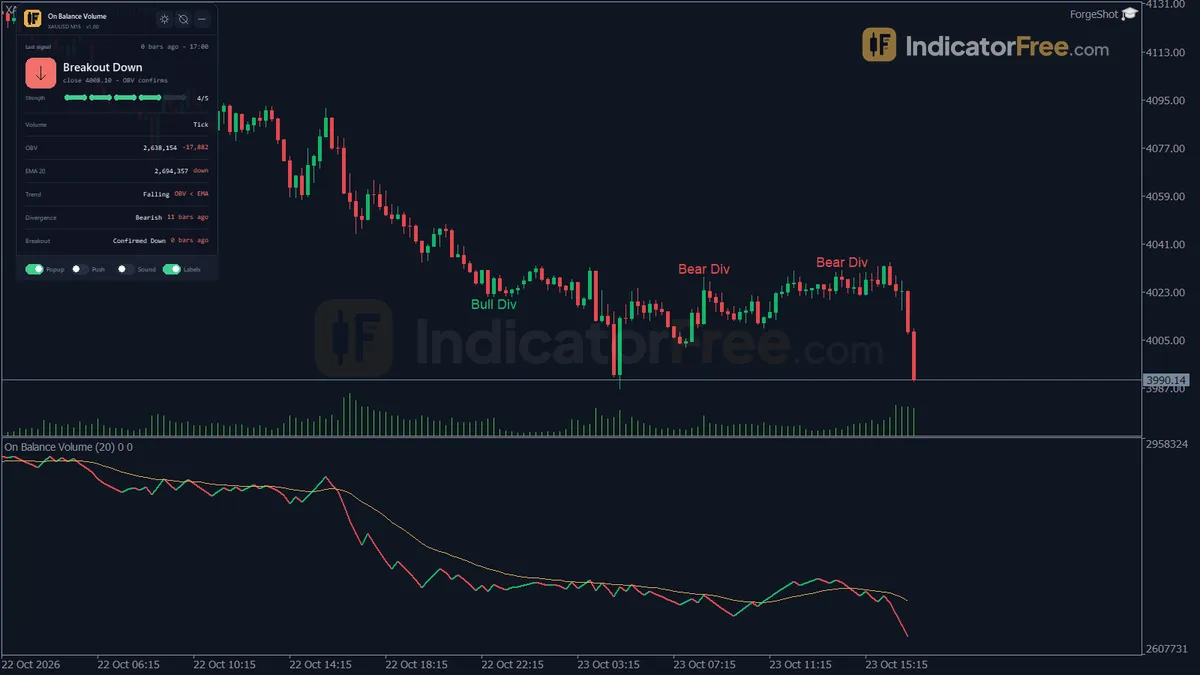
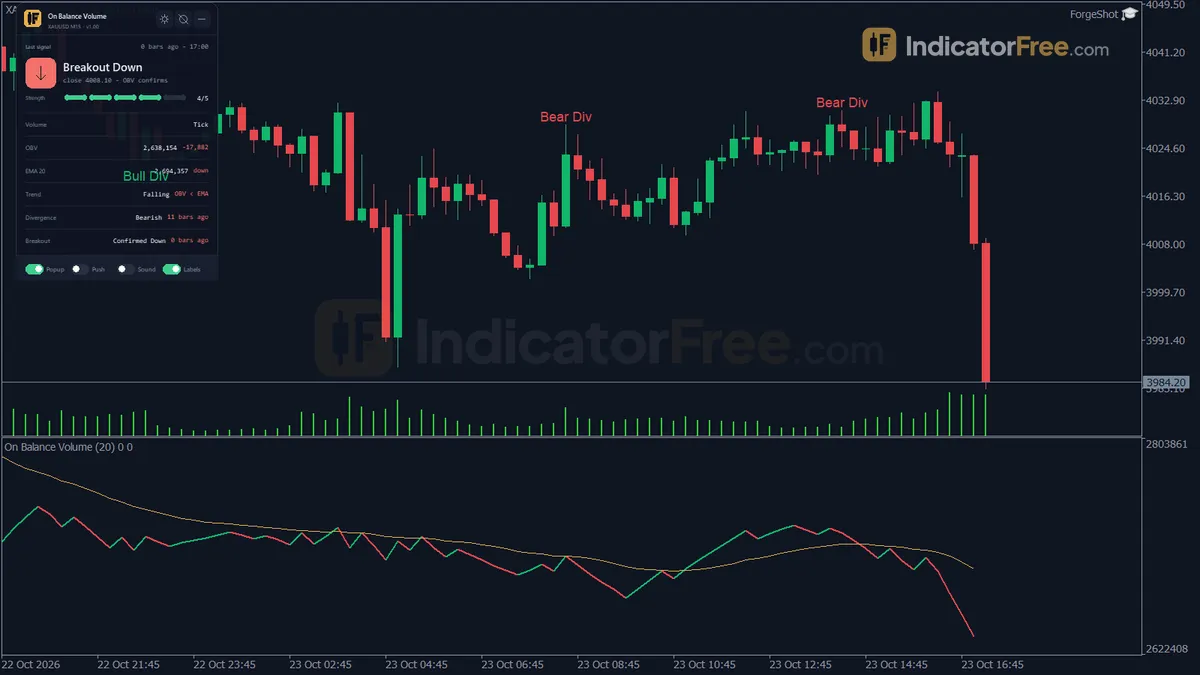
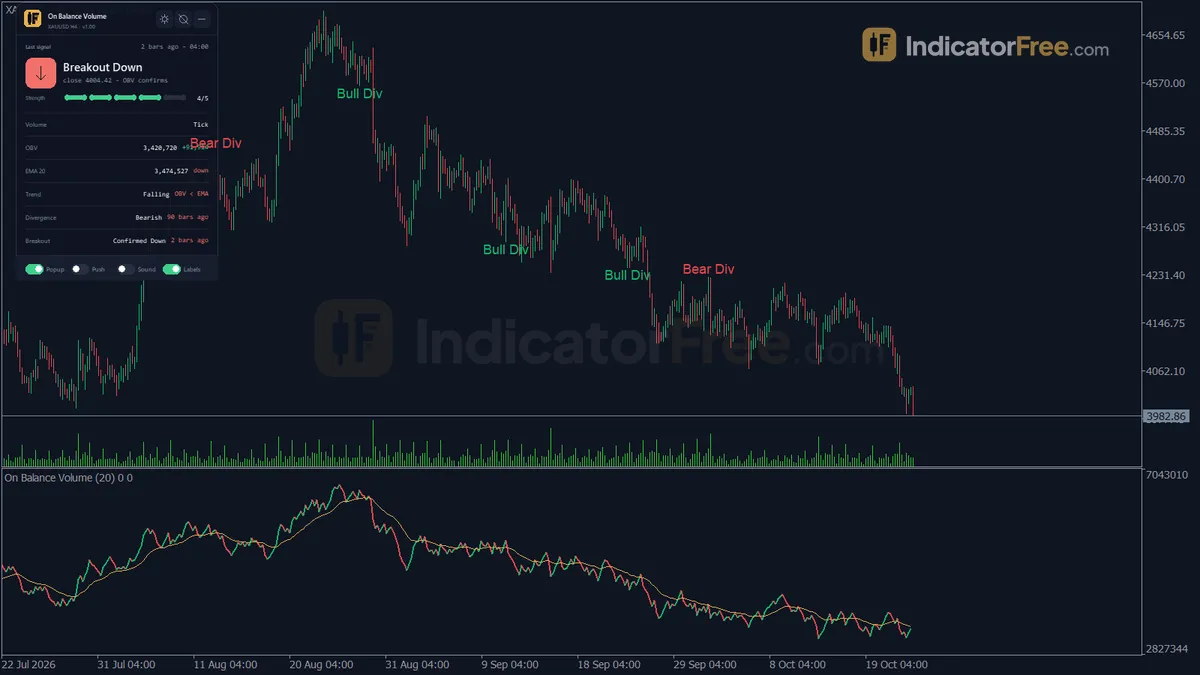
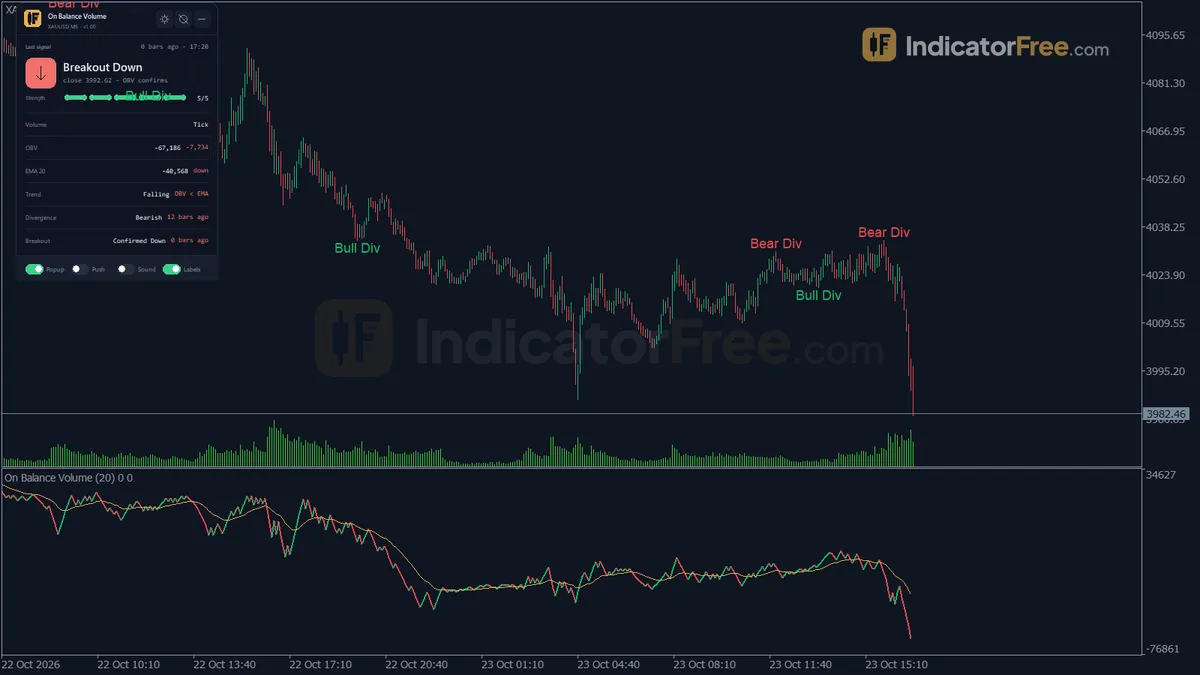
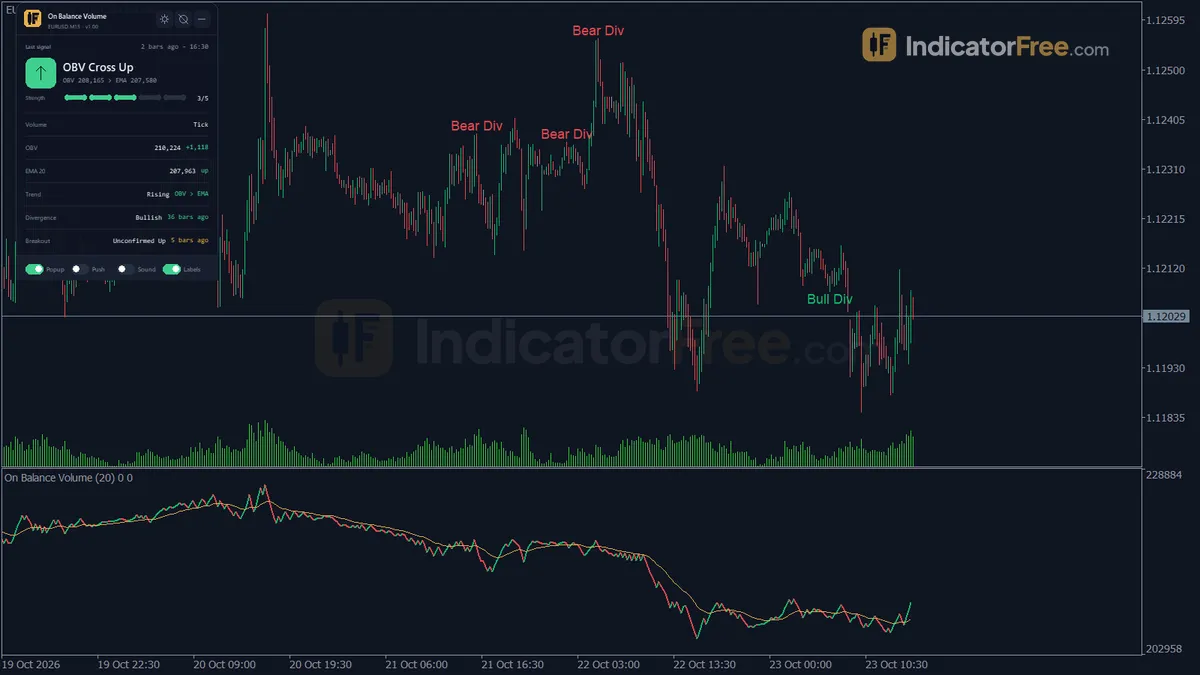
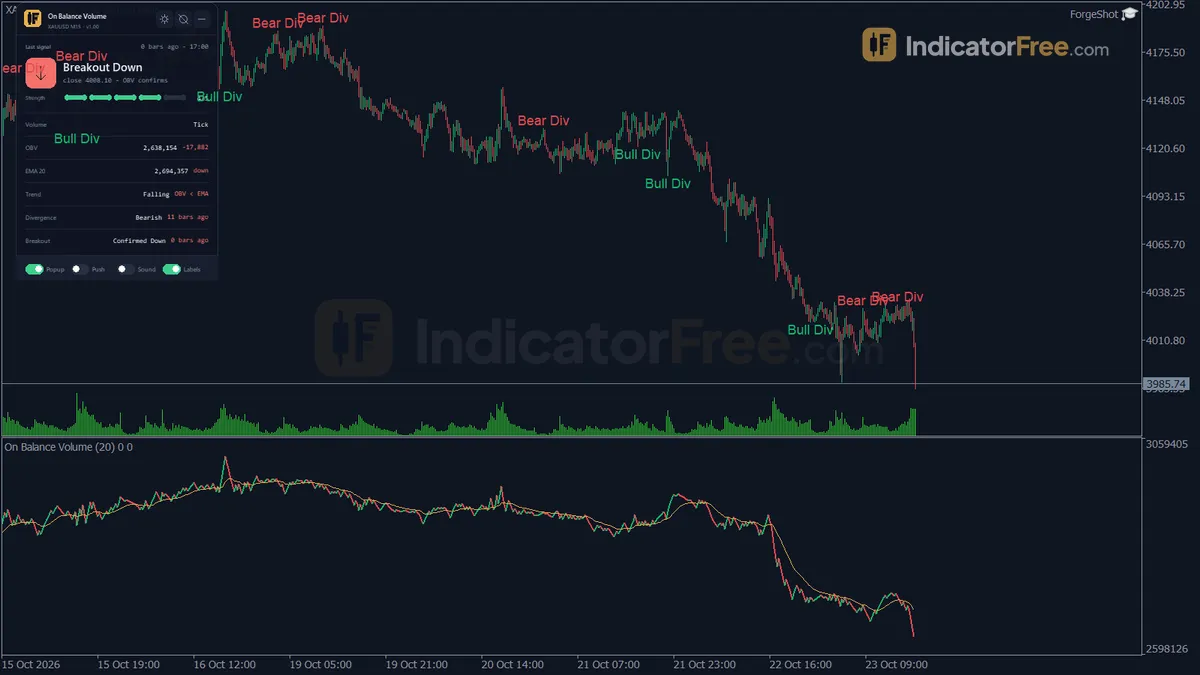
On Balance Volume is a running total. It adds the bar's volume when the close rises and subtracts it when the close falls, so its direction shows whether volume leans with or against price. The tool draws four things:
- OBV line (sub-window): the running total, colored bar to bar.
- OBV Signal (sub-window): an EMA of OBV, 20 periods by default.
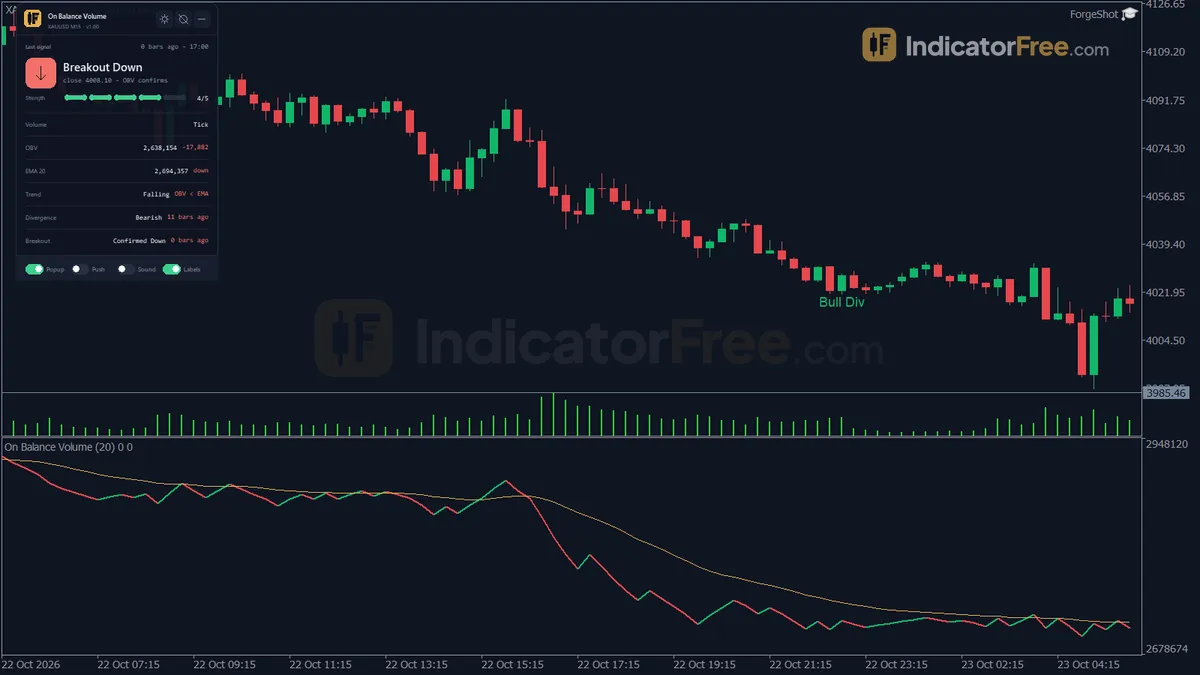
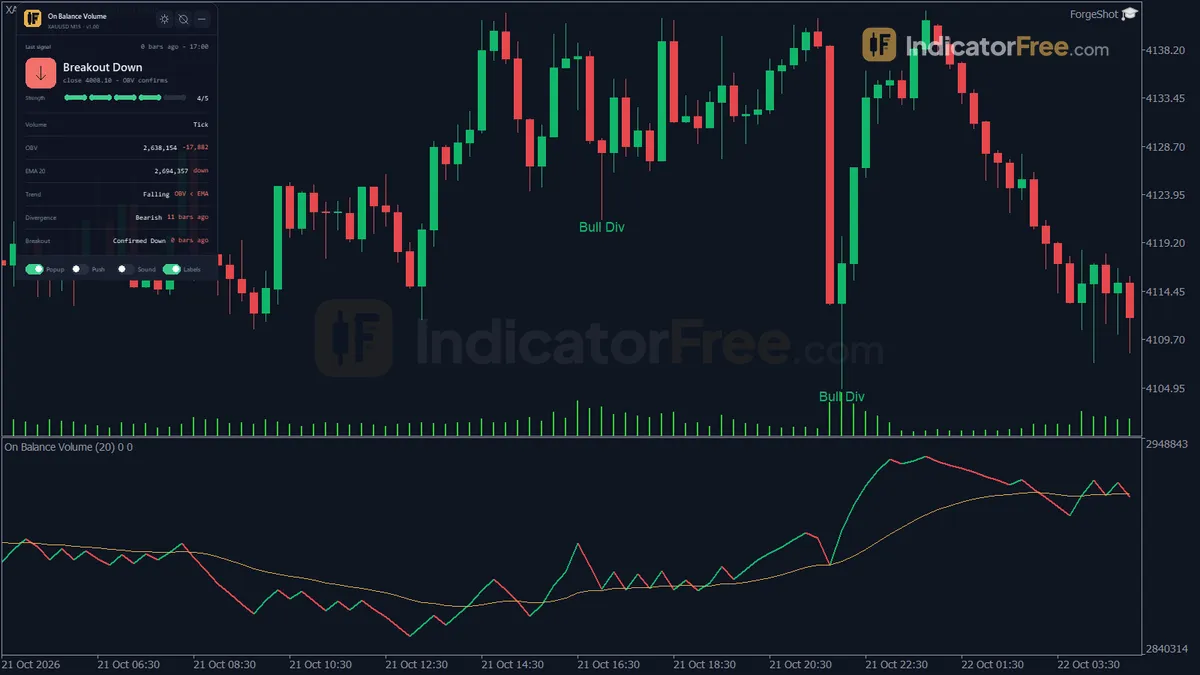
- Divergence labels (price chart): a Bull Div label under a swing low or a Bear Div label over a swing high when price makes a new extreme and OBV does not. The chart keeps only the latest MaxDivMarkersVisible labels (default 100) and deletes the oldest when a new one is drawn.
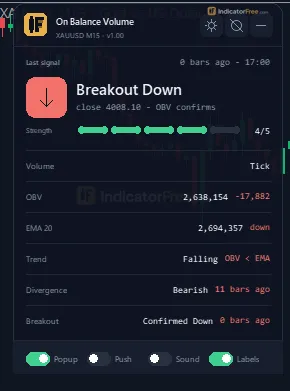
- OBV Status panel: the last OBV signal and its strength, the volume source, the current OBV, the Signal EMA and its direction, the OBV trend, the last divergence and the last breakout status.
The drawing below shows how a bearish divergence looks across the two panes.
How the Lab tested it
The Lab tested version 1.00 (135.7 KB) on MT5 build 6230 on 2026-10-09. For the repaint test it ran EURUSD M15 from 2026-07-09 to 2026-10-08 on real ticks from Raw Trading Ltd. It logged every signal as it appeared and then checked it again once the history was complete.
- 158 signals logged, 0 changed. A signal you see on the live chart is the same signal you will see in history. Your backtest screenshots are not flattered by later redrawing.
- Maximum delay: 0 bars. Each signal showed up on the bar where the Lab logged it, not on a later bar.
The Lab did not measure what price did after the signals, so this page gives no win rate. The repaint result tells you the signals are stable. It does not tell you they are profitable.
Who it is for
It suits traders who already trade breakouts or trend pullbacks and want a second opinion from volume. It does not suit someone looking for a stand-alone buy/sell arrow.
How it works
- 1Accumulates volume: adds the bar's volume when close rises, subtracts it when close falls, and leaves it unchanged otherwise.
OBV = OBV_prev +/- Volume depending on Close vs previous CloseInputs: VolumeSource - 2Smooths OBV with an exponential moving average to form a signal line.
Signal = Signal_prev + k x (OBV - Signal_prev), k = 2 / (SignalPeriod + 1)Inputs: SignalPeriod - 3Records a cross signal when OBV crosses its signal line while that line slopes the same way over three bars.
- 4Checks if close breaks the highest or lowest close of the lookback, and whether OBV breaks its range too.Inputs: BreakoutLookback
- 5Finds price swing highs and lows and marks divergence when price makes a new extreme that OBV does not follow.
Bearish: higher price high with lower OBVInputs: SwingLookback, ShowDivMarkers, MaxDivMarkersVisible
Specifications
- Platform
- MetaTrader 5
- Version
- 1.00
- Type
- Indicator
- Window
- Separate window
- Draws
- 2 lines, 1 zone, 1 panel
- Alerts
- popup, push, sound
- Repaints
- No (0 of 158 signals changed)
- Inputs
- 14
- Tested on
- MT5 build 6230 · 2026-10-09
Repaint test
No repaint detected. In a 9 Jul 2026 – 8 Oct 2026 test on EURUSD M15 (Raw Trading Ltd real ticks), 158 signals were logged at bar close and re-read at the end of the test: 0 changed. Arrows print on the bar that closes the signal, with no delay.
IndicatorFree — tested 2026-10-09 · MT5 build 6230 · Raw Trading Ltd real ticks. Results come from historical data, not live trading, and do not guarantee future results.
What it draws
- A line (OBV) from buffer 0.
- A line (OBV Signal) from buffer 2.
- Rectangles (Divergence Labels) drawn as chart objects, not buffers — they are not readable by iCustom() in an EA.
- An on-chart panel (OBV Status); values shown in the panel are not exposed as buffers.
Inputs
| Input | Default | What it does |
|---|---|---|
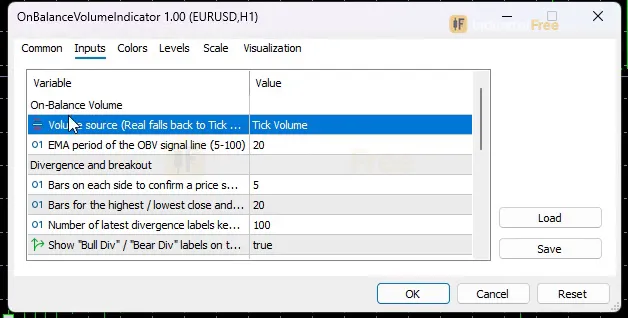
| VolumeSource | Tick Volume | Volume source (Real falls back to Tick when the broker has no real volume) |
| SignalPeriod | 20 | EMA period of the OBV signal line (5-100) |
| SwingLookback | 5 | Bars on each side to confirm a price swing (2-20), also the divergence delay |
| BreakoutLookback | 20 | Bars for the highest / lowest close and OBV in the breakout check (10-100) |
| MaxDivMarkersVisible | 100 | Number of latest divergence labels kept on the price chart (20-500) |
| ShowDivMarkers | true | Show "Bull Div" / "Bear Div" labels on the price chart |
| EnableAlertPopup | true | Popup alert on a new divergence, OBV / Signal cross or unconfirmed breakout |
| EnableAlertPush | false | Push notification to MetaTrader mobile for the same events |
| EnableAlertSound | false | Play a sound for the same events |
| AlertSoundFile | alert2.wav | Sound file from the MT5 Sounds folder |
| ShowPanel | true | Show the on-chart panel |
| Theme | Dark | Chart color theme |
| RestoreTheme | true | Restore the original chart colors when the indicator is removed |
| PanelScale | 1 | Panel size multiplier (0.6-2.0), DPI is applied automatically |
How to read it
Install: copy the file into your MQL5/Indicators folder, refresh the Navigator and drag the indicator onto a chart.
Reading the OBV and Signal lines
The OBV number itself means little, because it is a running total and its size depends on how much history is loaded. Read three things instead: its direction, its swing highs and lows, and where it sits relative to the signal line.
- OBV above a rising signal line means volume is leaning toward buyers.
- OBV below a falling signal line means volume is leaning toward sellers.
- OBV going flat and weaving around the signal line means there is no volume bias, so ignore crosses there.
How a cross signal forms
A cross is only recorded when the signal line agrees with it, as the flow below shows.
- 1Bar closesClose above previous close adds the bar's volume, below subtracts it, equal leaves OBV unchanged
- 2Signal EMA updatesk = 2 / (SignalPeriod + 1), 20 by default
- 3OBV crosses the Signal lineUpward cross or downward cross
- 4Slope checkThe Signal line must slope the same way as the cross over three bars
- 5Cross recordedPanel updates and the alerts you enabled fire
Because of the slope check, the indicator skips crosses against the signal line's direction. That cuts down the noise from small back-and-forth crosses, but it also means the first cross at a turning point is often skipped.
Breakout check: Confirmed or Unconfirmed
When the close breaks the highest or lowest close of the last BreakoutLookback bars (default 20), the indicator checks whether OBV also broke its own range over the same bars.
- Confirmed: price and OBV both broke out, so volume agrees with the move.
- Unconfirmed: price broke out but OBV stayed inside its range, so the move has no volume behind it yet.
Divergence labels and their built-in delay
A swing high or low needs SwingLookback bars (default 5) on each side to be confirmed. The input description says this is also the divergence delay. So when a Bull Div or Bear Div label appears, it marks a swing that is already SwingLookback bars old.
The common misread is to treat the label as an entry on the bar it sits on. You could not have seen it there in real time. Count the bars from the label to the current bar before you judge how late you are.
Inputs to change first
- SignalPeriod (5-100, default 20): lower values make the signal line follow OBV more closely and give more crosses. Higher values give fewer, slower crosses.
- SwingLookback (2-20, default 5): lower values give earlier but more frequent divergences on small swings. Higher values give later divergences on bigger swings only.
- BreakoutLookback (10-100, default 20): sets how big a range the breakout has to clear.
- VolumeSource (default Tick Volume): Real falls back to Tick when your broker supplies no real volume.
- ShowDivMarkers / MaxDivMarkersVisible (20-500): hide the labels or limit how many stay on the chart.
- ShowPanel, PanelScale (0.6-2.0, DPI applied automatically), Theme and RestoreTheme: change the look. The theme recolors the chart, and RestoreTheme puts your original colors back when you remove the indicator.
Alerts
Alerts fire on three events: a new divergence, an OBV/Signal cross and an unconfirmed breakout. EnableAlertPopup (on by default) shows them in the MT5 alert window. EnableAlertPush sends them to the MetaTrader mobile app. EnableAlertSound plays AlertSoundFile (default alert2.wav) from the MT5 Sounds folder.
Decision rules
- Breakout: trade a breakout only if the status reads Confirmed. When it reads Unconfirmed, skip it or wait for OBV to break its range as well.
- Cross: take an OBV/Signal cross only in the direction price is already trending. Skip it when OBV has been weaving around the signal line.
- Divergence: treat it as a warning to tighten or stop adding, not as an entry. Act only if a later cross in the divergence's direction backs it up.
Installation
- 1Download OnBalanceVolumeIndicator.ex5 from the button above (Google Drive).
- 2In MetaTrader 5: File → Open Data Folder → MQL5 → Indicators. Copy OnBalanceVolumeIndicator.ex5 there.
- 3Restart MT5 or right-click Indicators in Navigator → Refresh.
- 4Drag On Balance Volume onto a chart. For push alerts, enable "Allow push notifications" under Tools → Options → Notifications.
- Tested on MT5 build 6230.
Key terms and guides
- Balance
- Balance is the money in your trading account counting only closed trades, deposits, withdrawals and charges the broker has booked. It ignores the profit or loss on positions that are still open.
- Bearish divergence
- Bearish divergence is when price makes a higher high but a momentum oscillator such as RSI or MACD makes a lower high. It warns that buying pressure is fading before price turns down.
- Swing High/Low
- A swing high is a candle whose high sits above the highs of the candles on both sides of it. A swing low is a candle whose low sits below the lows on both sides. Together they mark the turning points of price.
- Every tick based on real ticks
- Every tick based on real ticks is the MT5 Strategy Tester mode that replays the actual bid and ask ticks your broker recorded, with the real changing spread, instead of ticks the tester invents from 1-minute bars.
- Exponential moving average
- The exponential moving average (EMA) is a moving average that gives the newest closes the most weight, so it turns sooner than a simple moving average. Traders use it to read trend direction and to time entries on pullbacks.
- Signal line
- A signal line is a moving average of an indicator's own line, such as the 9-period average of the MACD line. When the indicator crosses above or below it, traders read it as a change in momentum.
More on this subject: Volume & order flow guide, terms and tools
User reviews
No reviews yet. Members who download the tool can review it here.
Sign in and download the tool to review it.
Build a checklist with it
On Balance Volume does one job on the chart: entry signal. Put it on the same chart as the tools below and the IndicatorFree panels merge into one checklist card, ordered trend, zone, signal, risk.
- Trend / contextParabolic SAR ProOn Balance Volume tells you when; this tells you which way the market leans, so you can skip signals against it.
- Zone / levelFixed Range ProfileShows the zones and levels, so you can see whether a signal from On Balance Volume fires at a level worth trading.
The Lab has not tested these combinations. Each tool is tested on its own; the card only lines up what each one says. Free members get 2 new tools a day. If one has to wait until tomorrow, install BlackBox to raise the limit to 5 a day (20 on a live account).
FAQ
Does On Balance Volume repaint?
No repaint detected. In a 9 Jul 2026 – 8 Oct 2026 test on EURUSD M15 (Raw Trading Ltd real ticks), 158 signals were logged at bar close and re-read at the end of the test: 0 changed. Arrows print on the bar that closes the signal, with no delay.
Why can’t my EA read the zones?
Zones and the panel are chart objects, not indicator buffers, so iCustom() does not return them.
How do I get alerts on my phone?
Enter your MetaQuotes ID under Tools → Options → Notifications, tick "Enable push notifications", and keep the push alert input on.
Why does it open in a separate window?
It plots values on their own scale, so MT5 draws it below the price chart.
Does it work on other pairs?
Tested on EURUSD only; other symbols not tested.
Should I use Real or Tick volume?
Pick Real if your broker supplies real volume for that symbol; otherwise the indicator falls back to Tick on its own. The Lab's repaint test used the default, Tick Volume.
Which timeframe and symbol was it tested on?
The repaint test ran on EURUSD M15. The indicator also runs on other timeframes such as M5 and H4, but the Lab has no test numbers for them, so check its behaviour on your own chart first.
Why do I get alerts for unconfirmed breakouts but not confirmed ones?
The alert inputs list only three events: new divergences, OBV/Signal crosses and unconfirmed breakouts. Confirmed breakouts appear in the panel's last breakout status instead.
Will it change my chart colors?
Yes, the Theme input (Dark by default) recolors the chart. Leave RestoreTheme on and your original colors come back when you remove the indicator.
Can I declutter the price chart?
Set ShowDivMarkers to false to hide the divergence labels, or lower MaxDivMarkersVisible (minimum 20) to keep fewer of them. Set ShowPanel to false to hide the status panel.
Changelog
- 1.00Initial release: On-Balance Volume line with bar-to-bar coloring, an EMA signal line, automatic price/OBV divergence detection with on-chart labels, and volume confirmation of price breakouts (Confirmed/Unconfirmed). · 2026-10-09
Final verdict
Lab verdict
This is a well-built OBV with three useful extras: a signal line with a slope filter, automatic divergence labels and a volume check on breakouts. The clean repaint result in the Lab test is its strongest point, because what you review in history is what you would have seen live. The OBV Status panel also saves you from reading the sub-window bar by bar.
Its limits are clear:
- The Lab has no follow-through numbers for any signal, so none of them is proven to win.
- On the default Tick Volume, OBV counts price updates, not traded size.
- A bar's full volume is added or subtracted no matter how small the close-to-close move was.
- Divergence labels arrive SwingLookback bars after the swing.
- The repaint test covered EURUSD M15 only.
Use it or skip it
- –You trade breakouts and want to know if volume agrees
- –You want divergence spotted and labelled for you
- –You need alerts for crosses and unconfirmed breakouts on mobile
- –You want a stand-alone entry arrow with a tested win rate
- –You need divergence the moment a swing forms
- –You trade tight ranges where OBV weaves around its signal line
Settings to start with
Start on the defaults, since they are what the Lab tested. Turn on EnableAlertPush if you are away from the screen. If divergences feel too late on higher timeframes such as H4, try SwingLookback 3. If crosses come too often on M5, try SignalPeriod 30. Neither value was tested by the Lab, so compare each with the default on your own chart before you rely on it.
A pairing idea
OBV tells you whether volume backs a move, but not where the important price levels are. You could pair it with Session Volume Profile and look for Confirmed breakouts out of the session value area. Or use Fixed Range Profile to see where volume clustered inside a range you drag. This is an idea to try: the Lab has not tested the pair.