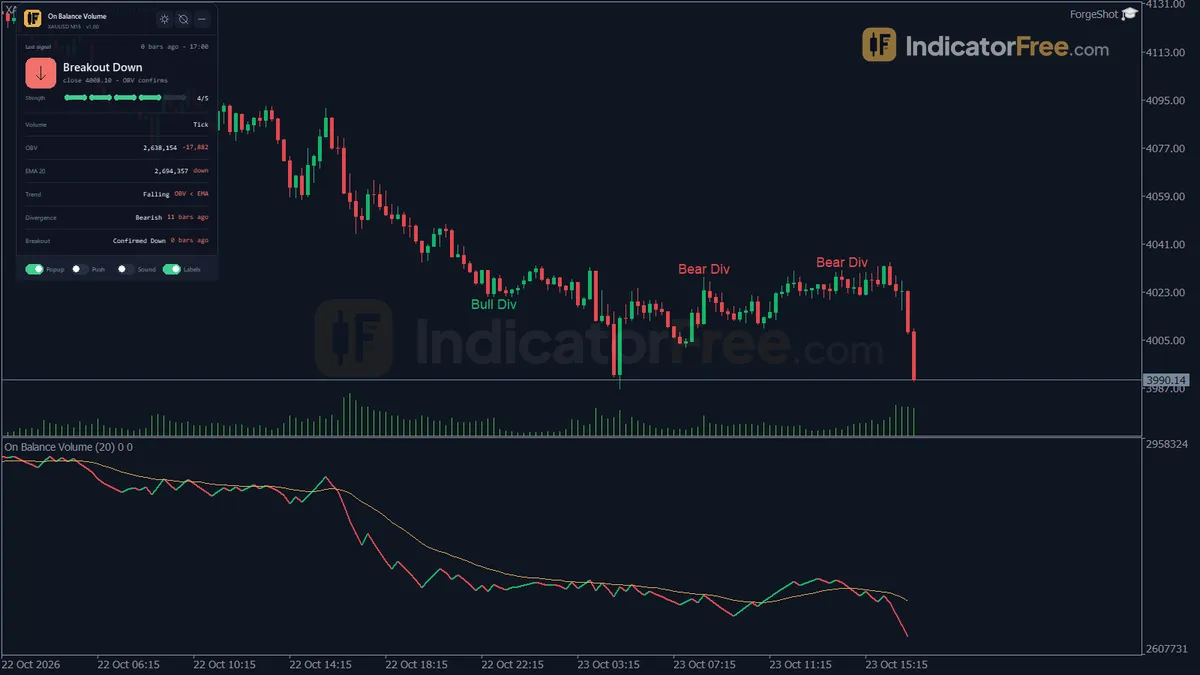
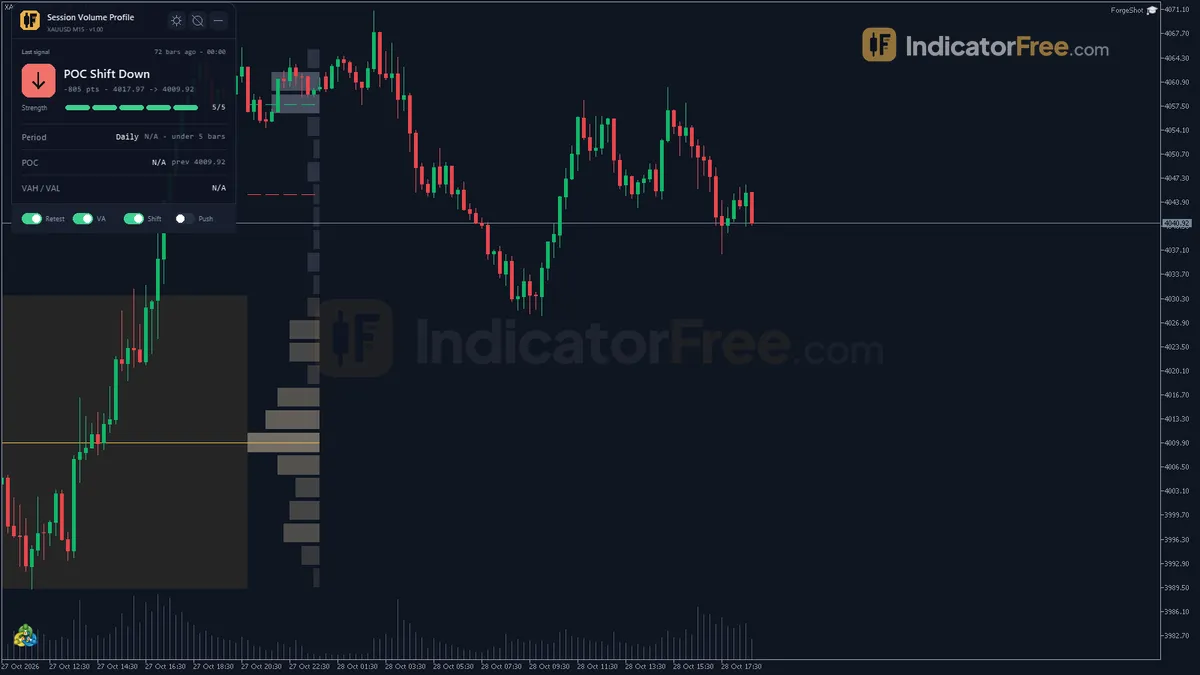
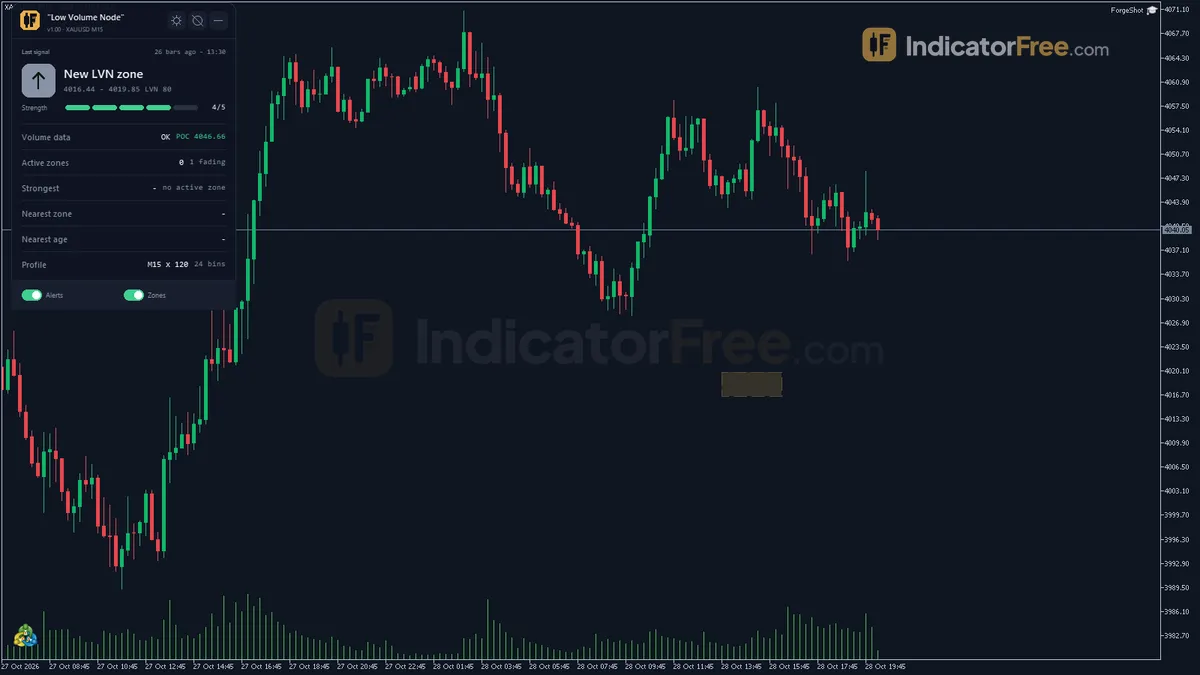
Money Flow Index
Free Money Flow Index indicator for MT5 with zone-exit and divergence arrows, plus alerts. In the Lab's repaint test, 0 of 758 signals changed.
- Repainted
- 0 / 758
- Signals / week
- —
- Tested on
- EURUSD M15
- Tested
- 2026-10-09
Overview
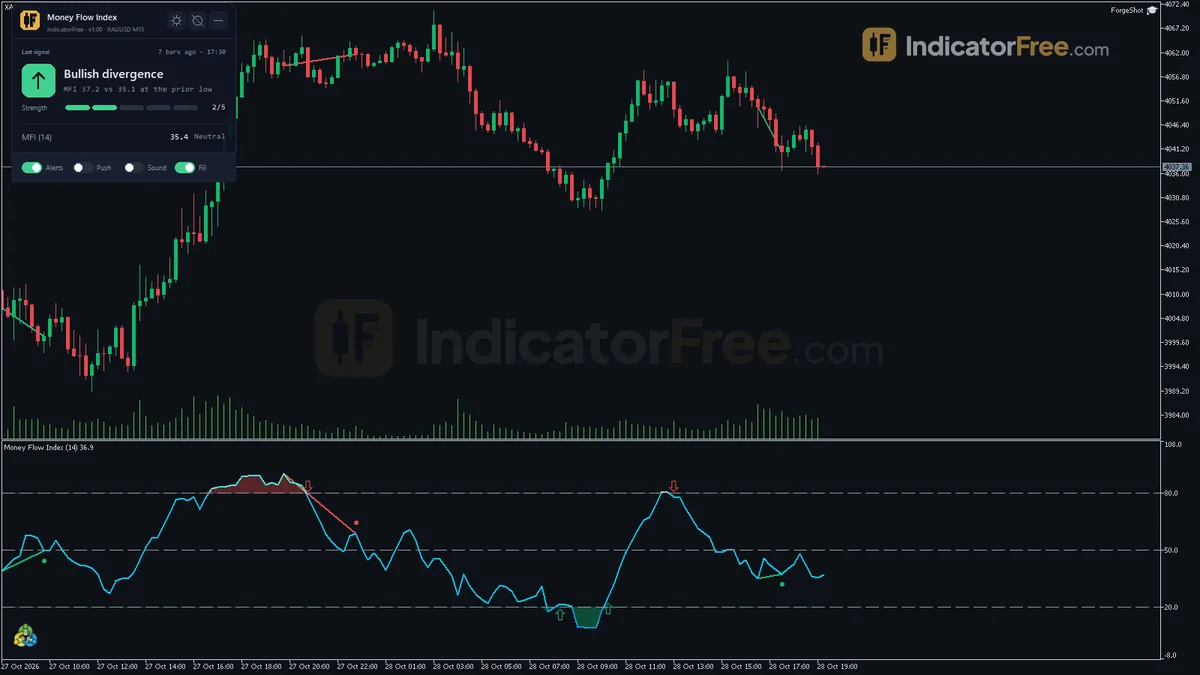
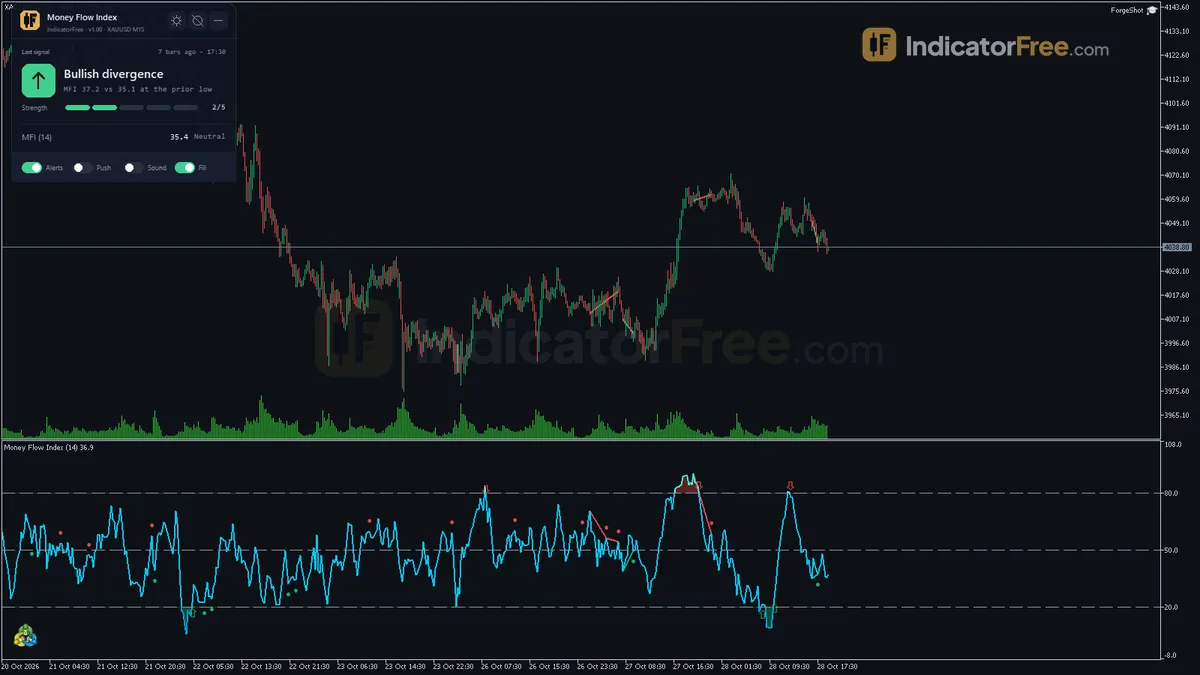
The Money Flow Index indicator for MT5 draws a 0-100 MFI line in a separate subwindow. It shades the overbought and oversold zones, places an arrow on a closed bar when MFI leaves a zone, and draws regular divergence lines for you. In the Lab's repaint test, 0 of 758 logged signals changed after they appeared. It suits traders who want a volume-weighted momentum trigger with alerts, without having to watch the line all day.
What it puts on your chart
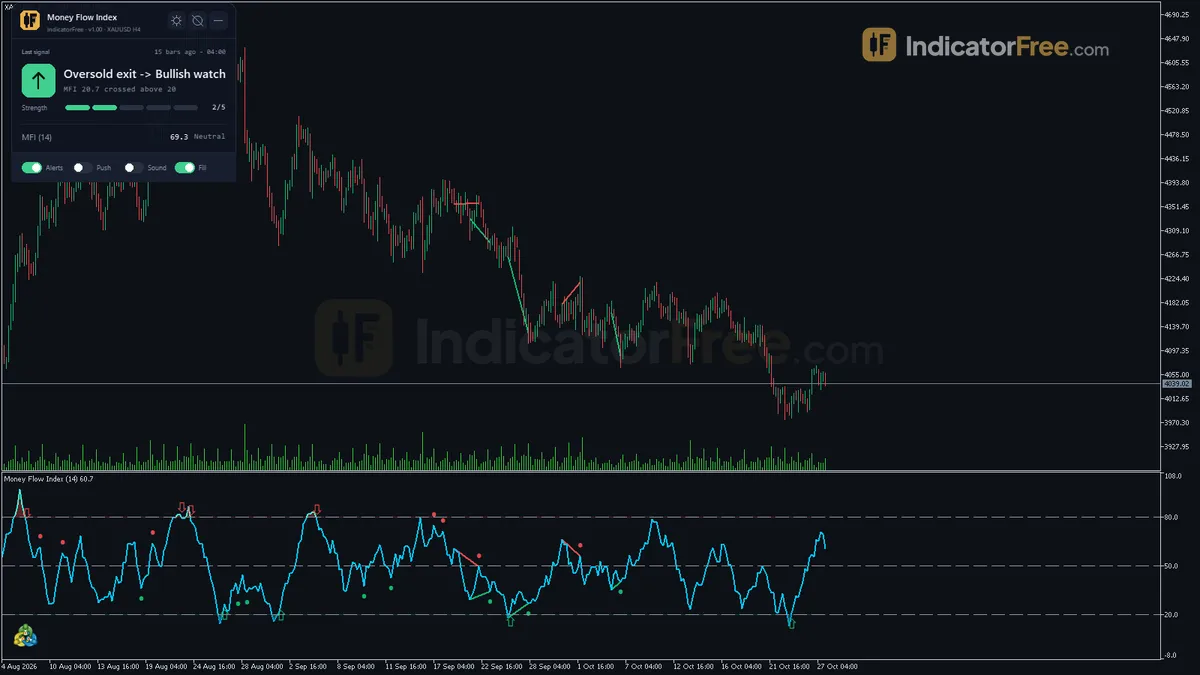
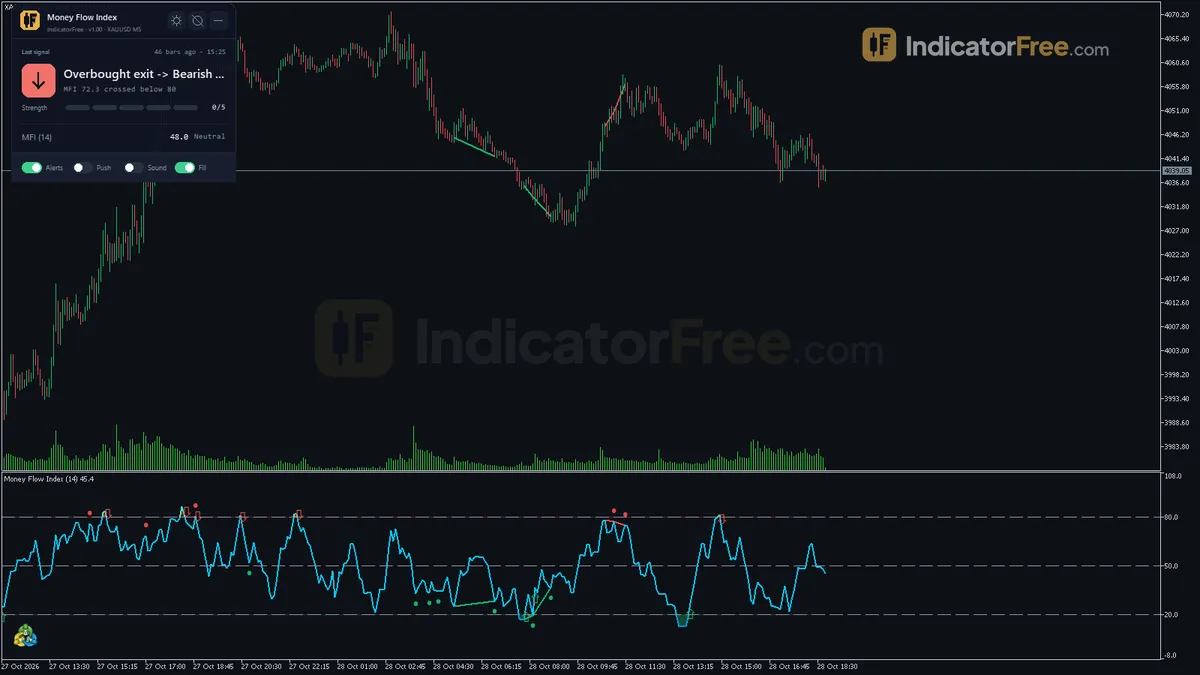
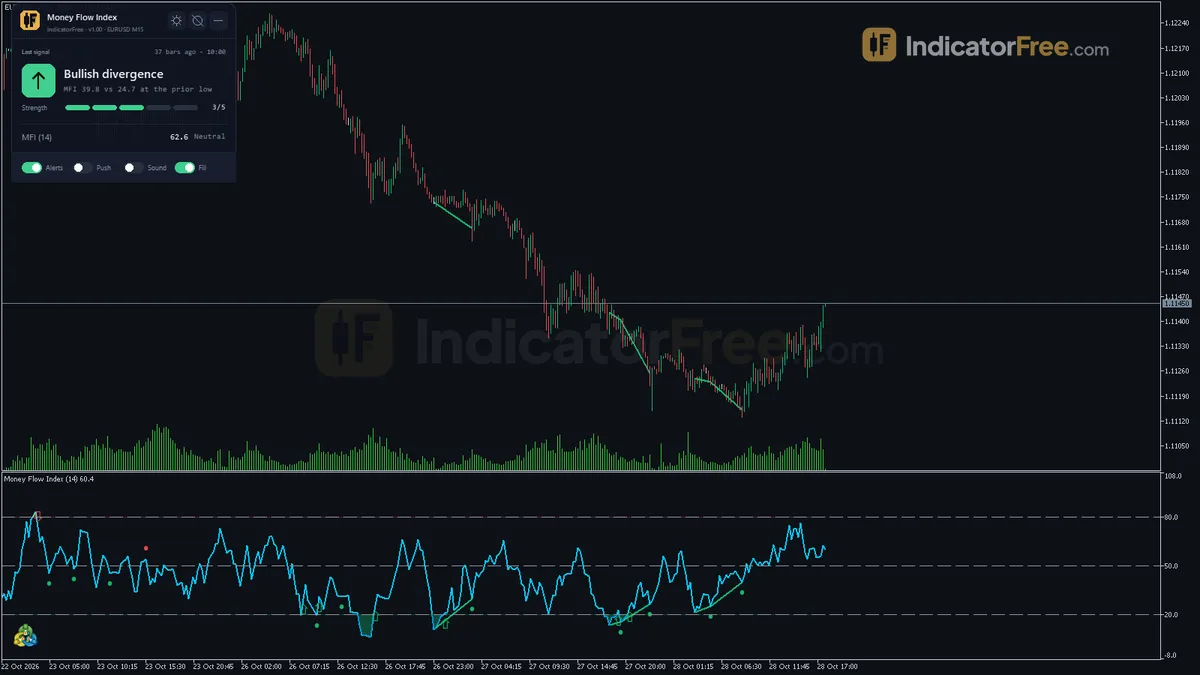
- MFI Line: the main oscillator, from 0 to 100, in its own subwindow.
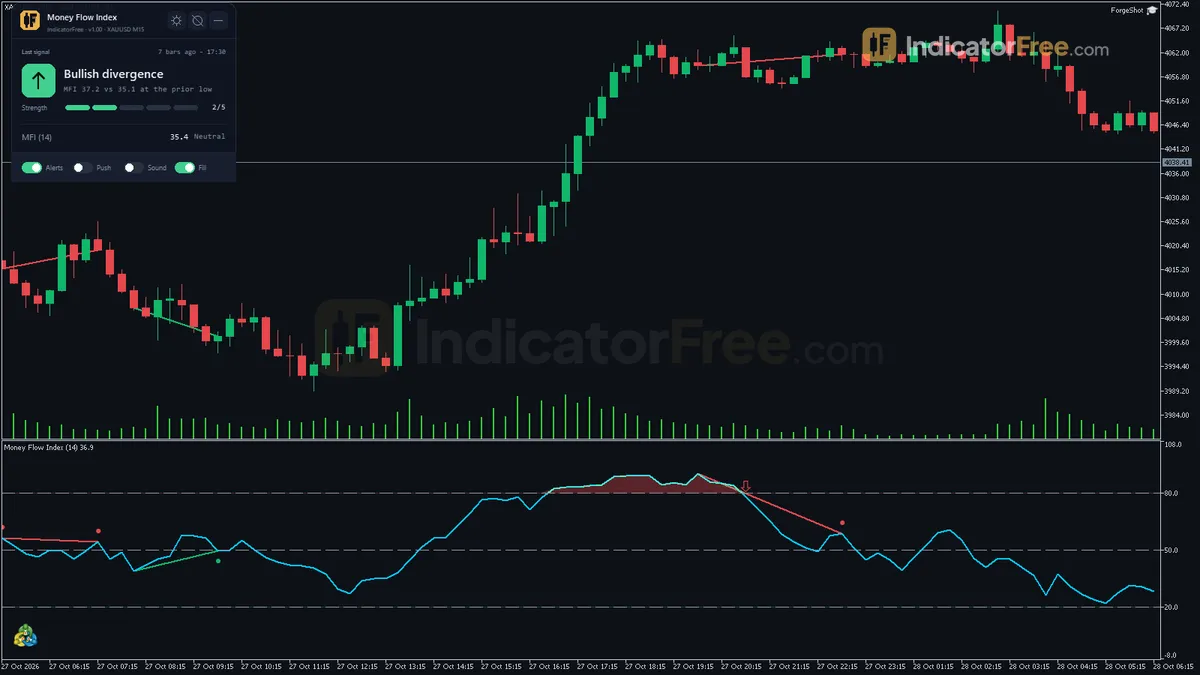
- Zone fill: the area of the line above the overbought level or below the oversold level is filled. You can turn this off.
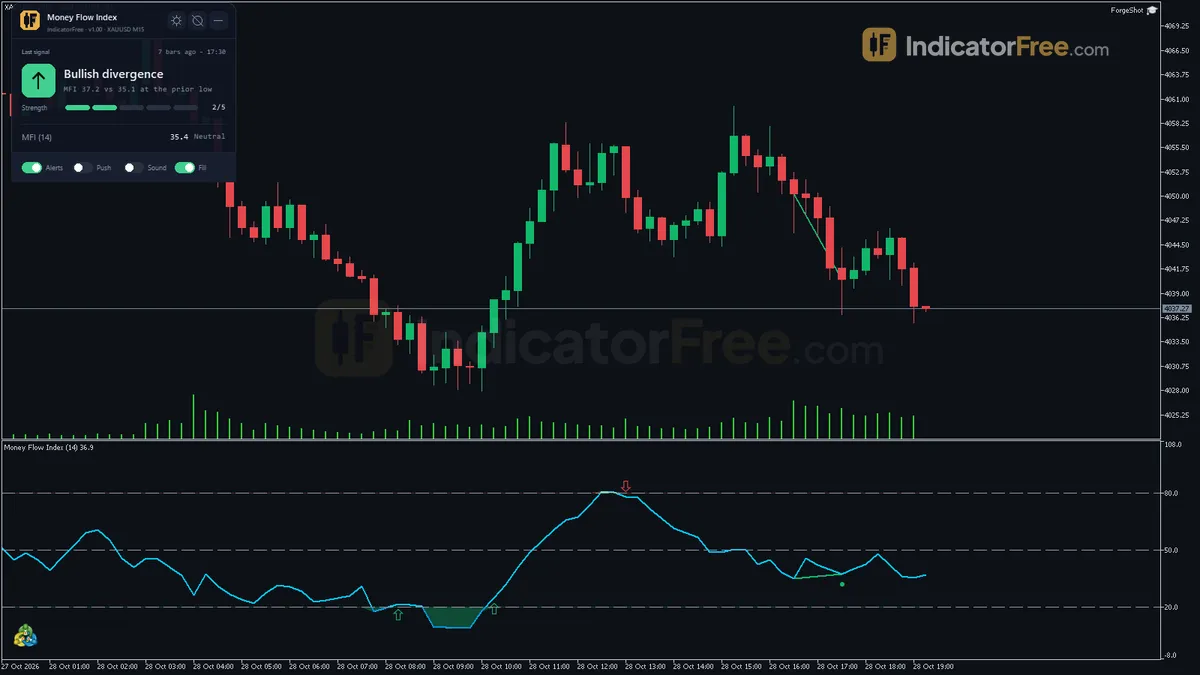
- Oversold Exit / Overbought Exit arrows: zone-exit signals, checked only on closed bars.
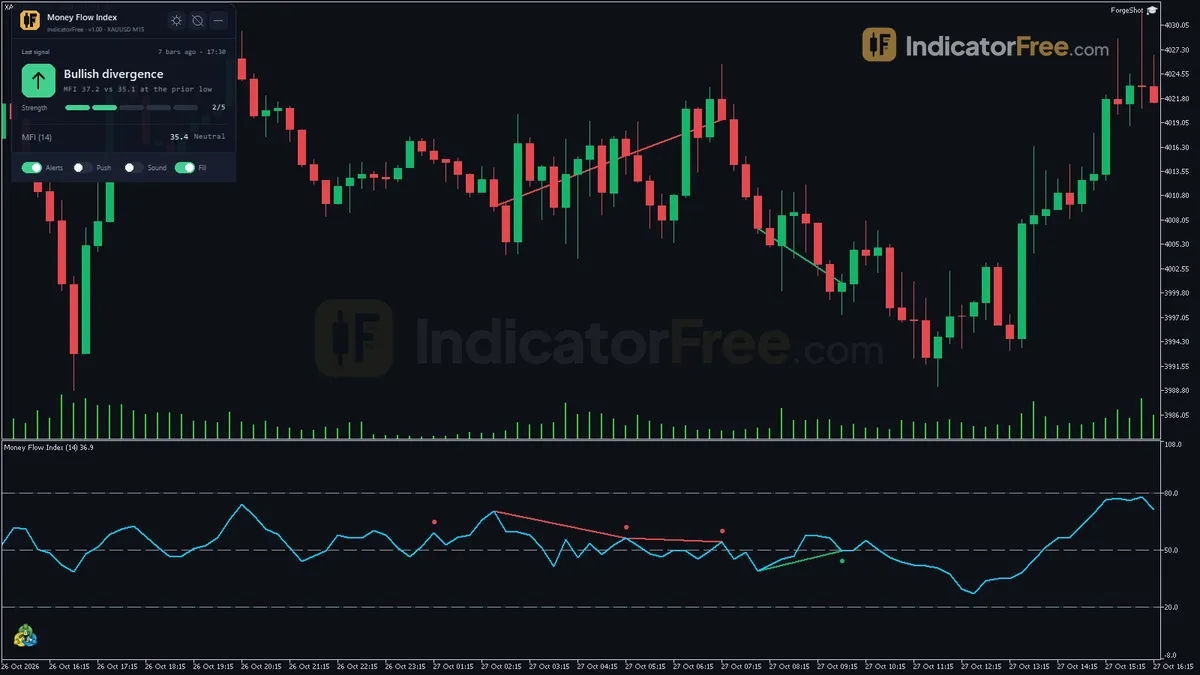
- Bullish / Bearish Divergence arrows: regular divergence between closing prices and MFI swing points.
- Divergence Lines: trendline pairs that link the two swings of each divergence. Older pairs are deleted automatically.
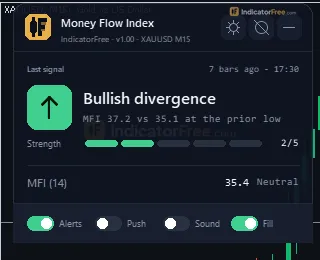
- Status panel: a summary of the latest signal and the current MFI state.
How the Lab tested it
The Lab ran version 1.00 (148 KB) on MetaTrader 5 build 6230 and finished testing on 2026-10-09. The repaint test used EURUSD M15 from 2026-07-09 to 2026-10-08, with real ticks from Raw Trading Ltd. Every signal was logged when it appeared and then compared with the finished history.
- 758 signals logged, 0 changed. No arrow moved or disappeared after it was drawn. What you see in history is what you would have seen live.
- Maximum arrow delay: 0 bars. No arrow was drawn later than its rule allows. Divergence arrows are still drawn
PivotRightBarsbars after the swing, because that is when the swing is confirmed.
What the Lab did not measure
The Lab tested repainting only. It did not test how often price moved in the arrow's direction afterwards, so there is no win rate for this tool. The test also covered one symbol and one timeframe. Treat the arrows as honest, non-repainting triggers whose edge you still have to check on your own market.
Who it is for
It is for swing and intraday traders who already use overbought/oversold or divergence ideas and want them marked, counted and alerted on closed bars. If you want a tool that tells you the trend direction, this is not that tool.
How it works
- 1Computes typical price per bar and multiplies it by volume (tick or real) to get raw money flow.
Typical = (High + Low + Close) / 3, Flow = Typical x VolumeInputs: VolumeSource - 2Over the period, adds flow on bars where typical price rose (positive) and where it fell (negative).Inputs: MfiPeriod
- 3Converts to an index from 0 to 100: positive share of total flow.
MFI = 100 x positive flow / (positive flow + negative flow)Inputs: MfiPeriod - 4Marks a buy watch when MFI crosses back above oversold and a sell watch when it crosses back below overbought.
Buy watch: MFI_prev <= OversoldLevel and MFI > OversoldLevelInputs: OverboughtLevel, OversoldLevel - 5Finds MFI swing highs and lows and flags divergence when price closes beyond the last swing but MFI does not.
Bullish: lower price low with higher MFI lowInputs: EnableDivergence, PivotLeftBars, PivotRightBars, MaxDivergenceLines
Specifications
- Platform
- MetaTrader 5
- Version
- 1.00
- Type
- Indicator
- Window
- Separate window
- Draws
- 1 line, 4 arrows, 1 zone, 1 panel
- Alerts
- popup, push, sound
- Repaints
- No (0 of 758 signals changed)
- Inputs
- 20
- Tested on
- MT5 build 6230 · 2026-10-09
Repaint test
No repaint detected. In a 9 Jul 2026 – 8 Oct 2026 test on EURUSD M15 (Raw Trading Ltd real ticks), 758 signals were logged at bar close and re-read at the end of the test: 0 changed. Arrows print on the bar that closes the signal, with no delay.
IndicatorFree — tested 2026-10-09 · MT5 build 6230 · Raw Trading Ltd real ticks. Results come from historical data, not live trading, and do not guarantee future results.
What it draws
- A line (MFI Line) from buffer 0.
- Arrows (Oversold Exit) from buffer 7, drawn on the closed bar.
- Arrows (Overbought Exit) from buffer 8, drawn on the closed bar.
- Arrows (Bullish Divergence) from buffer 5, drawn on the closed bar.
- Arrows (Bearish Divergence) from buffer 6, drawn on the closed bar.
- Rectangles (Divergence Lines) drawn as chart objects, not buffers — they are not readable by iCustom() in an EA.
- An on-chart panel (Status); values shown in the panel are not exposed as buffers.
Inputs
| Input | Default | What it does |
|---|---|---|
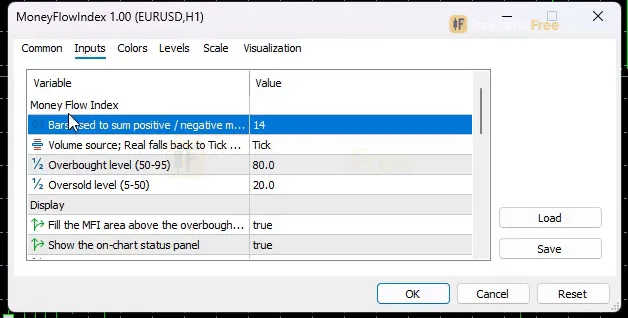
| MfiPeriod | 14 | Bars used to sum positive / negative money flow (2-100) |
| VolumeSource | Tick | Volume source; Real falls back to Tick when the window has no real volume |
| OverboughtLevel | 80 | Overbought level (50-95) |
| OversoldLevel | 20 | Oversold level (5-50) |
| ShowZoneFill | true | Fill the MFI area above the overbought / below the oversold level |
| ShowDashboard | true | Show the on-chart status panel |
| PanelScale | 1 | Panel size multiplier (DPI is applied automatically) |
| Theme | Dark | Chart color theme |
| RestoreTheme | true | Restore the original chart colors when removed |
| EnableDivergence | true | Detect and draw regular divergence between Close and MFI pivots |
| PivotLeftBars | 3 | Bars left of an MFI pivot (2-10) |
| PivotRightBars | 3 | Bars right of an MFI pivot to confirm it; divergence appears this many bars late (2-10) |
| MaxDivergenceLines | 5 | Divergence line pairs kept on the chart; the oldest pair is deleted (1-20) |
| UseMTFConfirm | false | Label signals with the MFI of a higher timeframe (closed bars) |
| MTFTimeframe | H4 | Higher timeframe; disabled if not above the chart timeframe |
| MTFFilterMode | LabelOnly | LabelOnly: label only; BlockWeak: no alerts for signals against the higher timeframe |
| AlertPopup | true | Popup alert on a new zone exit or divergence |
| AlertPush | false | Push notification (SendNotification) |
| AlertSound | false | Play a sound on a new signal |
| SoundFile | alert.wav | Sound file (in the terminal Sounds folder) |
How to read it
Reading the MFI line
The Money Flow Index is an oscillator like RSI, except that each bar is weighted by volume. The tool calculates typical price as (High + Low + Close) / 3 and multiplies it by volume. Over MfiPeriod bars, it then reports the positive share of that flow: MFI = 100 x positive flow / (positive flow + negative flow).
Above OverboughtLevel (default 80), most recent flow has been buying pressure. Below OversoldLevel (default 20), most has been selling pressure. Being inside a zone is not a signal on its own.
Zone-exit arrows
- Oversold Exit: MFI was at or below
OversoldLevelon the previous closed bar and is above it on the last closed bar. This starts a buy watch. - Overbought Exit: MFI was at or above
OverboughtLevelon the previous closed bar and is below it on the last closed bar. This starts a sell watch.
The illustration below shows what both signal types look like in the subwindow.
Divergence arrows and lines
With EnableDivergence on, the tool looks for MFI swing points. A swing low counts as a pivot when it is lower than the PivotLeftBars bars before it and the PivotRightBars bars after it. A swing high counts when it is higher than those same bars.
- Bullish Divergence: two consecutive confirmed MFI pivot lows. Close at the second pivot is lower than at the first, but MFI at the second pivot is higher.
- Bearish Divergence: two consecutive confirmed MFI pivot highs. Close at the second pivot is higher than at the first, but MFI at the second pivot is lower.
A pivot is confirmed only after PivotRightBars more bars have closed. That is why the divergence arrow, its line pair and its alert always arrive that many bars after the swing itself. This wait is also what stops the divergence from repainting. The flow below shows each step.
- 1First MFI pivot lowLower than PivotLeftBars bars before it and PivotRightBars bars after it
- 2MFI recovers, then dips againA second candidate low forms
- 3Compare the two pivotsClose is lower at the second pivot, MFI is higher
- 4Wait PivotRightBars closed barsThe pivot is not confirmed until these bars close
- 5Arrow, line pair and alertDrawn on confirmation; the oldest line pair is removed above MaxDivergenceLines
The status panel
When ShowDashboard is on, the panel shows:
- the last zone-exit or divergence signal, how many bars ago it fired, and its strength
- the current MFI value and zone
- the watch state
- the last divergence and the divergence count
- the higher-timeframe confirmation
- the volume source in use
Use PanelScale to resize the panel. DPI scaling is applied automatically.
Inputs to change first
| Input | Default | What changing it does |
|---|---|---|
MfiPeriod | 14 | Range 2-100. Lower values make MFI faster and cause more zone exits. Higher values smooth the line and cause fewer exits. |
OverboughtLevel / OversoldLevel | 80 / 20 | Ranges 50-95 and 5-50. More extreme levels mean fewer, rarer exit arrows. |
VolumeSource | Tick | Real uses real volume; see FAQ. |
PivotRightBars | 3 | Range 2-10. Higher values confirm swings more firmly but delay the divergence arrow (see the flow above). |
PivotLeftBars | 3 | Range 2-10. Higher values require bigger swings, so you get fewer divergences. |
MaxDivergenceLines | 5 | Range 1-20. Sets how many line pairs stay on the chart. |
UseMTFConfirm / MTFTimeframe / MTFFilterMode | off / H4 / LabelOnly | Adds the higher timeframe's MFI to each signal; see FAQ. |
Theme recolors the chart. With RestoreTheme on, your original colors return when you remove the indicator.
Alerts
A new zone exit or divergence can trigger three alert types:
- Popup: shows in the MT5 Alert window.
AlertPopupis on by default. - Push notification: sent to the MetaTrader mobile app through
SendNotificationwhenAlertPushis on. This needs your MetaQuotes ID set in the terminal. - Sound: plays
SoundFilefrom the terminal's Sounds folder whenAlertSoundis on.
A decision rule for each signal
These three rules were not tested by the Lab. Check them against the defaults on your own chart.
- Oversold Exit: act only if the higher-timeframe MFI on the signal's label (H4 by default) is also above
OversoldLevel, or if a Bullish Divergence formed in the same dip. A lone exit while price keeps making lower lows is just a pause. - Overbought Exit: the same rule in reverse. Act only if the higher-timeframe MFI on the label is also below
OverboughtLevel, or after a recent Bearish Divergence. - Divergence arrows: if price has already moved far from the pivot by the time the arrow appears, skip the trade instead of chasing it.
The most common misread
Traders often sell when MFI enters the overbought zone. This tool never signals on entry. The arrow fires only when MFI leaves the zone on a closed bar. In a strong uptrend, MFI can stay above 80 for a long time, and fading it early is exactly the trade the exit rule is built to avoid.
Installation
- 1Download MoneyFlowIndex.ex5 from the button above (Google Drive).
- 2In MetaTrader 5: File → Open Data Folder → MQL5 → Indicators. Copy MoneyFlowIndex.ex5 there.
- 3Restart MT5 or right-click Indicators in Navigator → Refresh.
- 4Drag Money Flow Index onto a chart. For push alerts, enable "Allow push notifications" under Tools → Options → Notifications.
- Tested on MT5 build 6230.
Key terms and guides
- Bearish divergence
- Bearish divergence is when price makes a higher high but a momentum oscillator such as RSI or MACD makes a lower high. It warns that buying pressure is fading before price turns down.
- Momentum
- Momentum is how fast price is moving in one direction. The Momentum indicator compares the latest close with the close a set number of bars ago, so it shows whether a move is speeding up or slowing down.
- Order Fill
- An order fill is the moment your buy or sell order is actually executed: it is matched at a real price and opens (or closes) a position, for the full size or only part of it.
- Overbought
- Overbought means a momentum oscillator, usually the RSI, has moved above a high threshold such as 70, showing a price move is stretched and may pause or turn down.
- Every tick based on real ticks
- Every tick based on real ticks is the MT5 Strategy Tester mode that replays the actual bid and ask ticks your broker recorded, with the real changing spread, instead of ticks the tester invents from 1-minute bars.
- Oversold
- Oversold means price has fallen so far and so fast that a momentum oscillator, most often the RSI, reads below its lower line (usually 30). It shows that selling is stretched. It does not promise a bounce.
More on this subject: Volume & order flow guide, terms and tools
User reviews
No reviews yet. Members who download the tool can review it here.
Sign in and download the tool to review it.
Build a checklist with it
Money Flow Index does one job on the chart: entry signal. Put it on the same chart as the tools below and the IndicatorFree panels merge into one checklist card, ordered trend, zone, signal, risk.
- Trend / contextDMIMoney Flow Index tells you when; this tells you which way the market leans, so you can skip signals against it.
- Zone / levelFixed Range ProfileShows the zones and levels, so you can see whether a signal from Money Flow Index fires at a level worth trading.
The Lab has not tested these combinations. Each tool is tested on its own; the card only lines up what each one says. Free members get 2 new tools a day. If one has to wait until tomorrow, install BlackBox to raise the limit to 5 a day (20 on a live account).
FAQ
Does Money Flow Index repaint?
No repaint detected. In a 9 Jul 2026 – 8 Oct 2026 test on EURUSD M15 (Raw Trading Ltd real ticks), 758 signals were logged at bar close and re-read at the end of the test: 0 changed. Arrows print on the bar that closes the signal, with no delay.
Can I use Money Flow Index in an EA?
Yes. Read buffer 7 (Oversold Exit) with iCustom() on bar 1 — the last closed bar.
Why can’t my EA read the zones?
Zones and the panel are chart objects, not indicator buffers, so iCustom() does not return them.
How do I get alerts on my phone?
Enter your MetaQuotes ID under Tools → Options → Notifications, tick "Enable push notifications", and keep the push alert input on.
Why does it open in a separate window?
It plots values on their own scale, so MT5 draws it below the price chart.
Does it work on other pairs?
Tested on EURUSD only; other symbols not tested.
Which timeframe and symbol should I use the Money Flow Index indicator on?
It runs on any MT5 symbol and timeframe, but the Lab's repaint test covered only EURUSD M15. On other markets, scroll back through history and check how often the arrows would have helped you before you trade them.
Should I set VolumeSource to Real or Tick?
Use Real only when your symbol provides real volume. If the window has no real volume, the indicator falls back to Tick on its own, and the status panel shows which source it is actually using.
How do I get the alerts on my phone?
Turn on AlertPush. Also enter your MetaQuotes ID from the MetaTrader mobile app in the terminal's notification settings, because the indicator sends alerts through SendNotification. Popup alerts stay on by default unless you turn off AlertPopup.
Does the higher-timeframe filter hide arrows from the chart?
With MTFFilterMode set to LabelOnly, every signal still appears with the higher timeframe's MFI label attached. BlockWeak only stops alerts for signals that go against the higher timeframe. The filter switches off if MTFTimeframe is not above your chart timeframe.
Changelog
- 1.00Initial release: classic volume-weighted Money Flow Index (0-100) with filled overbought/oversold zones and closed-bar zone-exit arrows.; Automatic confirmed regular divergence (price vs. · 2026-10-09
Final verdict
Strengths
The arrows can be trusted as recorded. The Lab's repaint test found no signal that changed or arrived late, so on the tested EURUSD M15 data, history matches what you would have seen live. The tool also goes further than the stock MFI:
- automatic divergence detection with lines
- a status panel with signal strength and a divergence count
- an optional higher-timeframe filter that can silence alerts against the bigger trend
- popup, push and sound alerts
Limits you should accept before installing
- No proven edge. The Lab tested repainting, not profitability. Whether a zone exit leads to a move on your symbol is still an open question.
- Divergence is late by design. See the flow figure in How it works.
- Zone exits repeat in trends. A strong trend can produce several exit arrows against it. Without
UseMTFConfirm, nothing filters them. - Old divergence lines disappear. Only
MaxDivergenceLinespairs are kept, so older evidence is removed from the chart. - Tick volume, not traded volume. Default money flow uses tick volume, not exchange volume.
The comparison below sums up when the tool fits your trading and when to leave it out.
- –You trade reversals or pullbacks and want closed-bar confirmation
- –You already use overbought/oversold or divergence and want it automated
- –You can add a higher-timeframe or trend filter
- –You want alerts instead of watching the subwindow
- –You want a stand-alone buy/sell system with a tested win rate
- –You trade strong trend continuation, where zone exits fire against you
- –You need divergence the moment a swing forms, not bars later
- –You need exchange-traded volume and your symbol only has tick volume
Settings to start with
Start on the defaults. They are what the Lab ran. Then try these changes one at a time. None of them was tested by the Lab, so compare each with the default on your own chart:
- Fewer alerts against the trend: set
UseMTFConfirm= true andMTFFilterMode= BlockWeak. KeepMTFTimeframe= H4 on M15 to H1 charts. - Fewer, rarer zone exits: set
OverboughtLevel85 andOversoldLevel15. - Earlier divergence on lower timeframes like M5: set
PivotRightBars2. Expect more weak pivots.
Bottom line: this is a clean, non-repainting MFI trigger with useful extras. Treat it as a timing tool inside a plan you already trust, not as the plan itself.