Accumulation Zone Finder
Free MT5 indicator that boxes Wyckoff-style accumulation zones from tight ATR ranges and tick-volume absorption. Lab-run on build 6230, EURUSD M15.
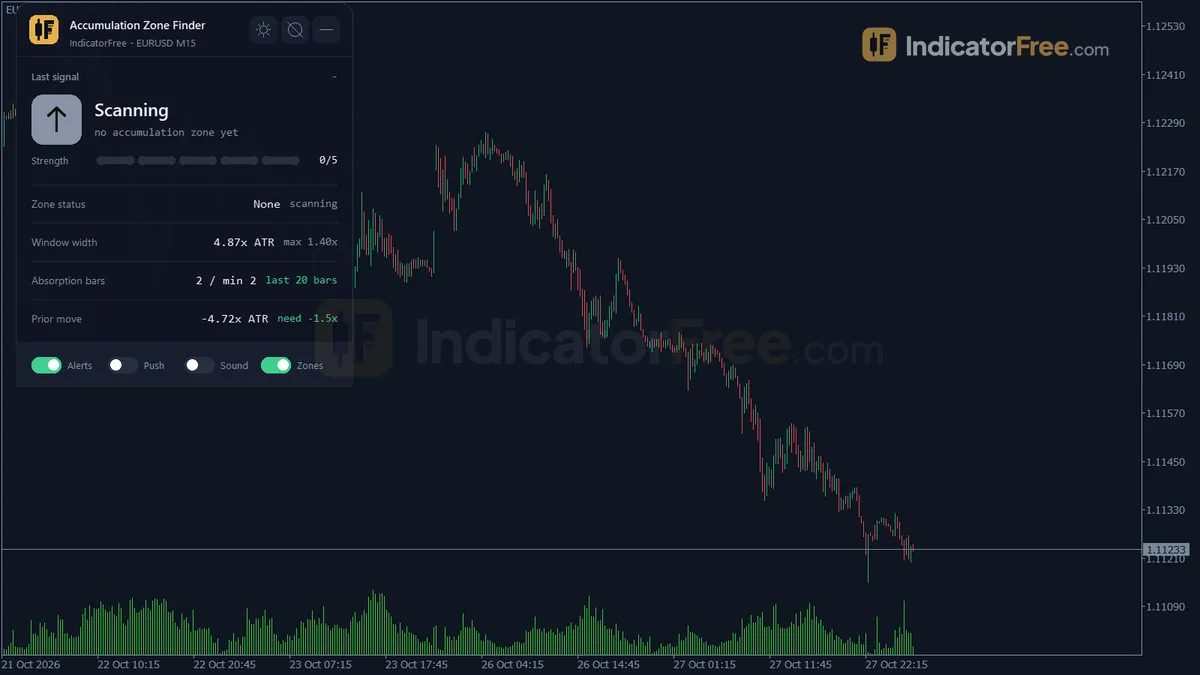
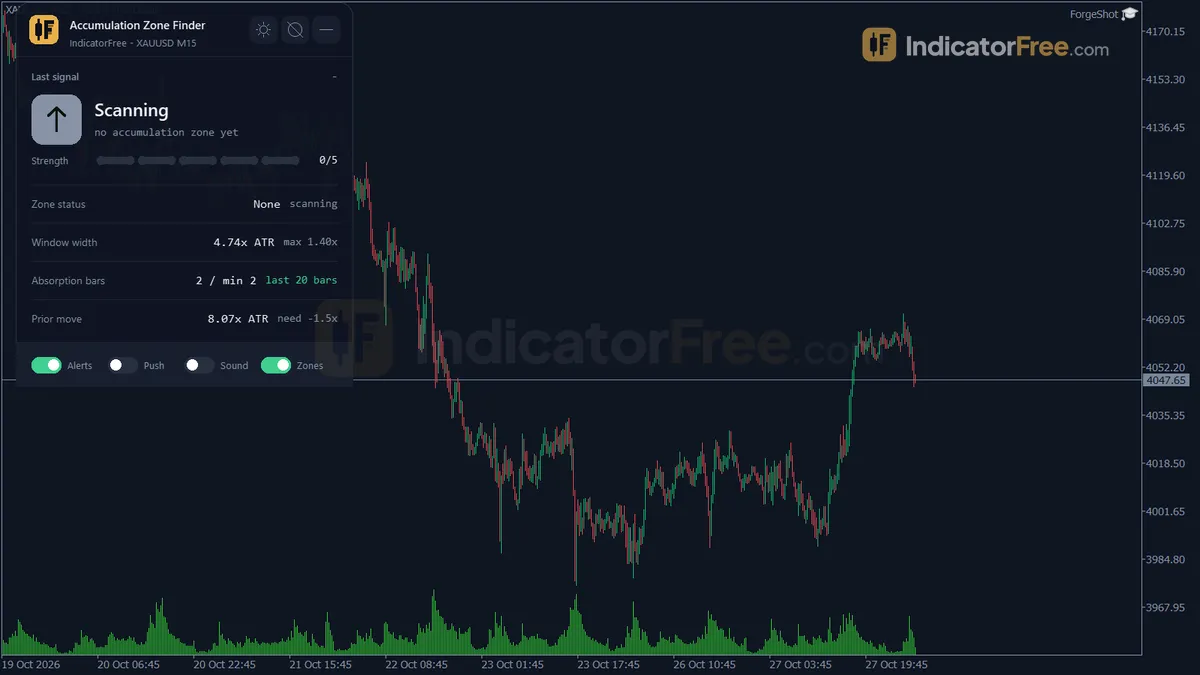
- Repainted
- Not tested
- Signals / week
- —
- Tested on
- —
- Tested
- 2026-10-05
Overview
The Accumulation Zone Finder is a free MT5 indicator that draws boxes on the main chart where price goes quiet after a drop and heavy selling volume fails to push it lower. When price later breaks above a box on strong tick volume, it prints an arrow. In the Lab's repaint test on EURUSD M15 (2026.07.06 to 2026.10.02), the default settings fired no breakout signals at all.
It suits patient traders who want to find where sellers are being absorbed before a move up, and who don't mind waiting a long time between signals.
What the Lab result means for you
The Lab ran version 1.00 (146.6 KB) on MT5 build 6230 on 2026-10-05. Over almost three months of EURUSD M15 data, not one bar passed every breakout filter at the default settings. That tells you two things.
- The defaults are very strict. If you leave every input as it is, expect long stretches with no arrows on a chart like EURUSD M15. The section on inputs explains which filters to loosen first.
- Repainting has not been measured. A test with no signals has nothing to check, so this page can't give you a repaint number. The arrow's rule does use the bar's close, so judge each arrow only after its bar has closed. If you loosen the settings, watch a few live arrows yourself before you rely on them.
What it draws on the chart
In the Wyckoff accumulation idea, a falling market stops falling and moves sideways while larger buyers quietly absorb the selling. This tool turns that idea into fixed, measurable rules. It works in the main chart window, not in a separate sub-window, and draws:
- Accumulation Zone: a rectangle around the tight range.
- Zone Quality Tag: a label on the zone with its live quality score from 0 to 100.
- Failed Zone Mark: a label that appears when price closes below the zone.
- Accumulation Breakout: an arrow on the bar that closes above the zone with high volume.
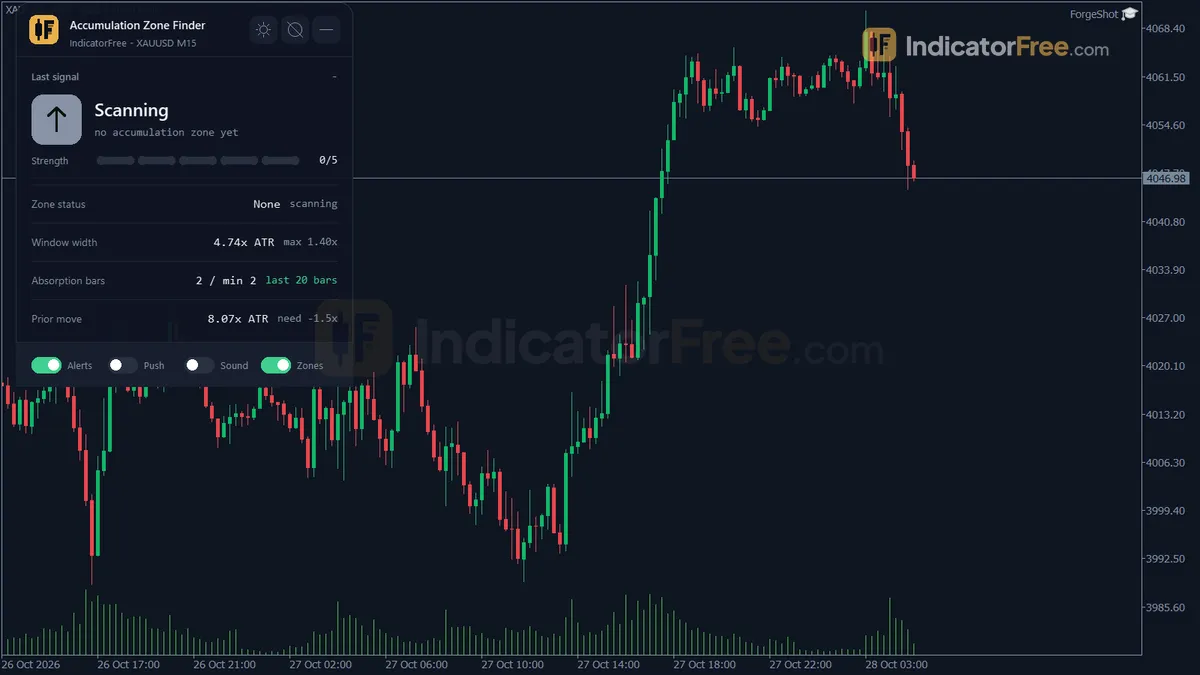
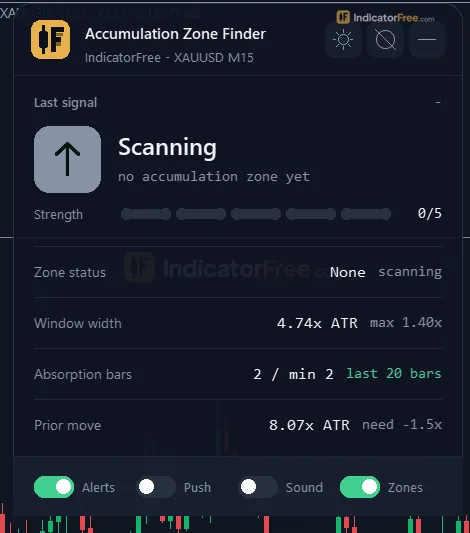
- Zone Status panel: shows the latest zone's status, quality score, high and low, the number of bars in the zone and the number of absorption bars.
By default the tool keeps up to 5 zones on the chart (MaxActiveZones). When there are more, it deletes the oldest finished zone first, or the oldest zone if none have finished. A zone's tag and fail mark are deleted along with it.
Who should skip it
Skip it if you want frequent entries or a ready-made buy/sell system. It only looks for bullish accumulation. It never draws distribution zones or sell arrows, so it is no help for short trades.
How it works
- 1Computes a 14-bar ATR and a 20-bar average tick volume on closed bars, used to size every threshold.
ATR = Wilder average of True Range over 14 | VolAvg = mean tick volume over 20 - 2Takes the high-low box of the last window of bars and requires it to be tight versus ATR.
Box range = highest high - lowest low | tight if range <= MaxRangeATRMult x ATRInputs: BoxBars, MaxRangeATRMult - 3Counts absorption bars: bearish bars with a volume spike but small range per volume versus the prior 50 bars.
Absorb bar: close < open, volume > VolAvg x VolumeSpikeMult, range/volume < RefEff x EfficiencyThresholdInputs: VolumeSpikeMult, EfficiencyThreshold - 4Confirms a zone with enough absorption bars and, optionally, a prior price drop of several ATR before the window.
Zone if Absorb >= MinAbsorbBars and Close change over PriorTrendBars <= -PriorDownMoveATRMult x ATRInputs: MinAbsorbBars, RequirePriorDownMove, PriorTrendBars, PriorDownMoveATRMult - 5Fails the zone on a close below its low minus a buffer, a high-volume close above its high breaks out.
Fail: Close < Low - InvalidateATRMult x ATR | Breakout: Close > High + BreakoutATRMult x ATRInputs: InvalidateATRMult, BreakoutATRMult, BreakoutVolumeMult
Specifications
- Platform
- MetaTrader 5
- Version
- 1.00
- Type
- Indicator
- Window
- Main chart
- Draws
- 1 arrow, 3 zones, 1 panel
- Alerts
- popup, push, sound
- Repaints
- not tested
- Inputs
- 22
- Tested on
- MT5 build 6230 · 2026-10-05
Repaint test
Repaint: not tested. This indicator draws arrow, zone, panel, which the IndicatorFree harness cannot read through iCustom().
IndicatorFree — tested 2026-10-05 · MT5 build 6230. Results come from historical data, not live trading, and do not guarantee future results.
What it draws
- Arrows (Accumulation Breakout) from buffer 2, drawn on the closed bar.
- Rectangles (Accumulation Zone) drawn as chart objects, not buffers — they are not readable by iCustom() in an EA.
- Rectangles (Zone Quality Tag) drawn as chart objects, not buffers — they are not readable by iCustom() in an EA.
- Rectangles (Failed Zone Mark) drawn as chart objects, not buffers — they are not readable by iCustom() in an EA.
- An on-chart panel (Zone Status); values shown in the panel are not exposed as buffers.
Inputs
| Input | Default | What it does |
|---|---|---|
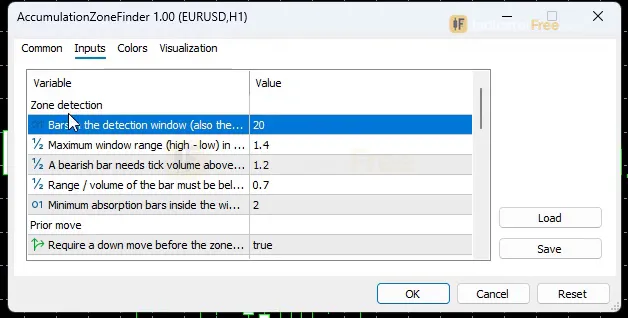
| BoxBars | 20 | Bars in the detection window (also the confirmation delay of a zone) |
| MaxRangeATRMult | 1.4 | Maximum window range (high - low) in ATR14 for the window to count as tight |
| VolumeSpikeMult | 1.2 | A bearish bar needs tick volume above its 20-bar average x this value |
| EfficiencyThreshold | 0.7 | Range / volume of the bar must be below the reference efficiency x this value |
| MinAbsorbBars | 2 | Minimum absorption bars inside the window to confirm a zone |
| RequirePriorDownMove | true | Require a down move before the zone (Wyckoff accumulation after markdown) |
| PriorTrendBars | 30 | Bars before the window used to measure the prior move |
| PriorDownMoveATRMult | 1.5 | Prior down move must be at least this many ATR14 (when required) |
| InvalidateATRMult | 0.5 | Close below zone low minus this many ATR14 marks the zone as failed |
| BreakoutATRMult | 0.3 | Close above zone high plus this many ATR14 (with volume) is a breakout |
| BreakoutVolumeMult | 1.3 | Breakout bar tick volume must be above its 20-bar average x this value |
| ShowZones | true | Show zone boxes, quality tags and failure marks (also a panel toggle) |
| MaxActiveZones | 5 | Zones kept on the chart; finished zones are deleted first when exceeded |
| EnableAlerts | true | Popup alert (also a panel toggle) |
| EnablePush | false | Push notification to the MT5 mobile app (also a panel toggle) |
| EnableSound | false | Play a sound (also a panel toggle) |
| SoundFile | alert.wav | Sound file played by the sound alert |
| AlertOnNewZone | true | Also alert when a new accumulation zone is confirmed |
| AlertOnFailure | true | Also alert when a zone fails (close below the zone) |
| Theme | Dark | Chart color theme applied on load |
| RestoreTheme | true | Restore the original chart colors when the indicator is removed |
| PanelScale | 1 | Panel size multiplier (DPI is handled automatically) |
How to read it
How one zone forms
Every threshold is measured against a 14-bar ATR (average true range) and the 20-bar average tick volume, both calculated on closed bars. A zone needs all of the steps below. The prior-drop step can be turned off.
- 1Tight boxThe high-low range of the last BoxBars bars (20) is no more than MaxRangeATRMult (1.4) x ATR14
- 2Absorption barsBearish bars with tick volume above the 20-bar average x VolumeSpikeMult (1.2) but a small range for that volume: range/volume below the 50-
- 3Enough absorptionAt least MinAbsorbBars (2) absorption bars inside the window
- 4Prior drop (optional)The close fell at least PriorDownMoveATRMult (1.5) x ATR over the PriorTrendBars (30) bars before the window
- 5Zone confirmedBox, quality tag and panel update; optional new-zone alert
- 6Breakout or failureArrow on a close above high + 0.3 ATR with volume above average x 1.3, or a fail mark on a close below low - 0.5 ATR
An absorption bar is the core of the tool. It is a red bar with a lot of volume that barely moves price. This pattern is often called effort versus result: sellers put in a lot of effort, but price hardly falls.
Reading the box, the arrow and the fail mark
The figure below is an illustration of a typical signal: a drop, a tight range containing two absorption bars, then a high-volume close above the box.
- The box is drawn late. BoxBars is both the size of the window and the confirmation delay. A zone appears only after its whole window has printed, so the box covers bars that are already in the past. A common misread is to treat the left edge of a new box as a missed entry. The tool tells you about the zone now, not when it started.
- Quality tag. The 0 to 100 score updates while the zone is live. Treat it as a way to rank zones against each other. The Lab has not measured whether higher scores lead to better breakouts.
- Failed Zone Mark. A close below the zone low minus InvalidateATRMult x ATR (0.5 by default) ends the zone. Don't buy a zone after it has failed.
- Arrow. It needs a close, not just a wick, above the zone high plus BreakoutATRMult x ATR, and tick volume above the 20-bar average x BreakoutVolumeMult. A spike that pokes above the box and falls back inside doesn't count.
A decision rule for the arrow
Take an Accumulation Breakout arrow only when all of these are true:
- Its bar has closed.
- The zone has no fail mark.
- The panel shows at least the minimum number of absorption bars, and the quality score is high compared with your other recent zones.
- There is clear room above the price before the next resistance.
One idea for a stop is the zone low minus 0.5 ATR, the same level the tool uses to mark a zone as failed. Skip the arrow when the breakout bar is very large compared with the box. In that case most of the move has already happened.
Inputs to change first
- RequirePriorDownMove / PriorDownMoveATRMult: the context filter. Leaving it on keeps only zones that follow a real markdown. Turning it off finds many more boxes, but more of them are plain pauses in a range.
- MinAbsorbBars, VolumeSpikeMult, EfficiencyThreshold: these set how much absorption a zone needs. Lowering MinAbsorbBars or VolumeSpikeMult, or raising EfficiencyThreshold, admits more zones.
- MaxRangeATRMult and BoxBars: a wider range limit or a shorter window finds looser, more frequent boxes. A shorter BoxBars also confirms zones sooner.
- BreakoutATRMult and BreakoutVolumeMult: lower values let arrows fire earlier, but they also let more fake-outs through.
Alerts and display
Alerts can fire on breakouts, on new zones (AlertOnNewZone) and on failed zones (AlertOnFailure). Popup alerts are on by default. EnablePush sends alerts to the MT5 mobile app, and EnableSound plays SoundFile (alert.wav). Both are off by default. ShowZones, EnableAlerts, EnablePush and EnableSound can also be switched from the panel.
The tool applies its Theme (Dark by default) to the chart colors when it loads. RestoreTheme puts your original colors back when you remove the indicator. PanelScale resizes the panel, and DPI is handled automatically.
Installation
- 1Download AccumulationZoneFinder.ex5 from the button above (Google Drive).
- 2In MetaTrader 5: File → Open Data Folder → MQL5 → Indicators. Copy AccumulationZoneFinder.ex5 there.
- 3Restart MT5 or right-click Indicators in Navigator → Refresh.
- 4Drag Accumulation Zone Finder onto a chart. For push alerts, enable "Allow push notifications" under Tools → Options → Notifications.
- Tested on MT5 build 6230.
Key terms and guides
- Average True Range
- Average True Range (ATR) is a volatility indicator that shows how far price typically moves per candle, gaps included, averaged over a set number of candles. It measures the size of moves, not their direction.
- Lot size
- Lot size is the volume of a trade, counted in lots. In forex, one standard lot is 100,000 units of the base currency, and the lot size you choose sets how much money each pip of price movement is worth.
- Downtrend
- A downtrend is a market move where each swing high and each swing low is lower than the one before it, which shows that sellers are in control.
- Position Size
- Position size is how many units or lots you buy or sell in one trade. You set it from the money you are willing to lose and the distance to your stop-loss, so a stop that gets hit costs a planned amount.
- Zone strength
- Zone strength is a grade of how likely a supply or demand zone is to hold when price comes back to it. You judge it by how fast price left the zone, whether that move broke structure, and how often the zone has been tested.
- Tick volume
- Tick volume is the number of price changes (ticks) a price feed records during one candle. In forex, where no central exchange reports how much was traded, it is the usual way to judge how active the market was.
More on this subject: Supply, demand & key levels guide, terms and tools
User reviews
No reviews yet. Members who download the tool can review it here.
Sign in and download the tool to review it.
Build a checklist with it
Accumulation Zone Finder does one job on the chart: zone / level. Put it on the same chart as the tools below and the IndicatorFree panels merge into one checklist card, ordered trend, zone, signal, risk.
- Trend / contextMarket Structure ShiftAdds the trend side: which way the market leans before you act on Accumulation Zone Finder.
- Entry signalInside Bar FakeoutAdds the entry signal: the moment to act once Accumulation Zone Finder has set the scene.
The Lab has not tested these combinations. Each tool is tested on its own; the card only lines up what each one says. Free members get 2 new tools a day. If one has to wait until tomorrow, install BlackBox to raise the limit to 5 a day (20 on a live account).
FAQ
Does Accumulation Zone Finder repaint?
Repaint: not tested. This indicator draws arrow, zone, panel, which the IndicatorFree harness cannot read through iCustom().
Can I use Accumulation Zone Finder in an EA?
Yes. Read buffer 2 (Accumulation Breakout) with iCustom() on bar 1 — the last closed bar.
Why can’t my EA read the zones?
Zones and the panel are chart objects, not indicator buffers, so iCustom() does not return them.
How do I get alerts on my phone?
Enter your MetaQuotes ID under Tools → Options → Notifications, tick "Enable push notifications", and keep the push alert input on.
How does it calculate volume on forex pairs?
It uses MT5 tick volume, which is the number of price updates in each bar, not the real traded volume. Each bar's tick volume is compared with its 20-bar average, so only relative spikes matter.
Which timeframe should I use it on?
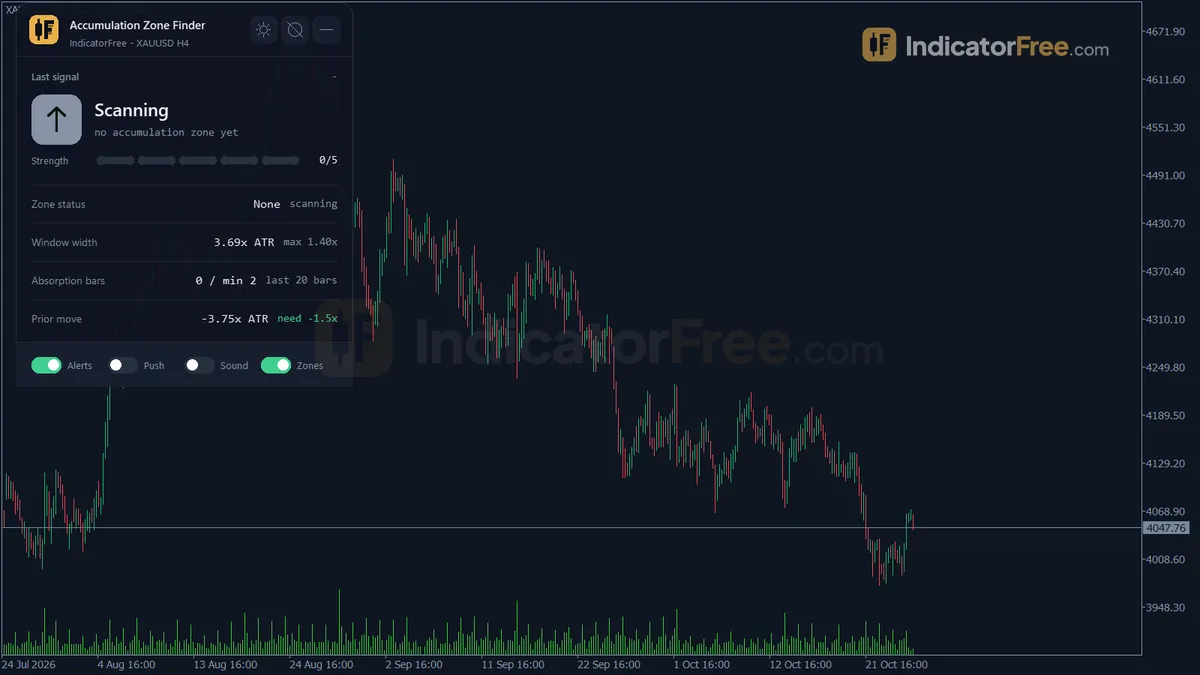
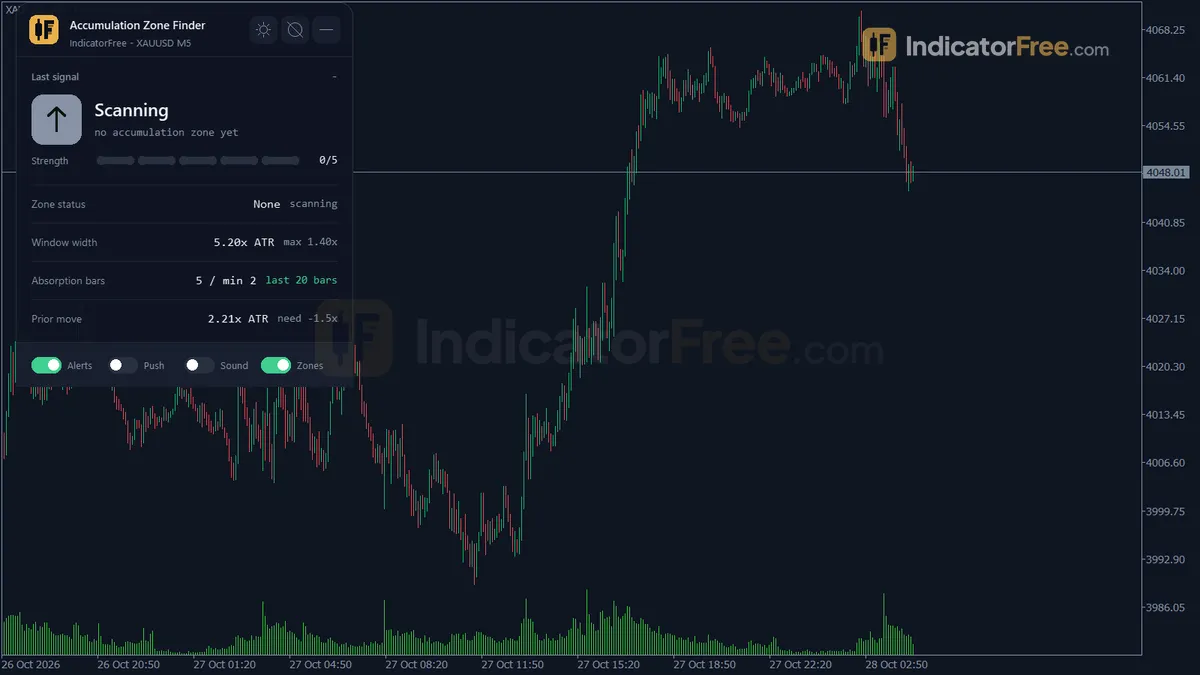
The Lab tested EURUSD M15. The screenshots also show the tool loaded on H4 and M5, but those timeframes were not tested. On any timeframe, a zone appears only after BoxBars bars, so higher timeframes mean longer waits.
Why do old zones disappear from my chart?
The tool keeps up to MaxActiveZones zones (5 by default). It deletes finished zones first, then the oldest. Raise this input if you want more history on screen.
Will it change my chart colors?
Yes. It applies the Theme you choose when it loads. With RestoreTheme left on, your original colors come back when you remove the indicator.
Can I get the alerts on my phone?
Yes. Set EnablePush to true, or switch it on from the panel, and alerts are sent to the MT5 mobile app. Your terminal must be linked to the app for push notifications.
Changelog
- 1.00Initial release: Wyckoff-style accumulation zone detection combining a tight ATR-based range with a tick-volume absorption filter (effort-vs-result) and an optional prior-down-move context check, 0-100 live zone quality. · 2026-10-09
Final verdict
Is the Accumulation Zone Finder worth installing?
Yes, if you want an objective, rules-based way to spot absorption after a drop, and you accept that it needs tuning. Every rule is written in ATR and tick-volume terms you can check on the panel. The zone, the quality tag and the fail mark give you a clear story for each setup: forming, broken out or failed.
The weak point is signal frequency. The Lab's EURUSD M15 run produced nothing to evaluate at the default settings. So there is no Lab evidence yet on how often the arrows work or whether they hold their place. Treat it as a tool for finding where to look, not a trigger that has been proven.
- –Price has fallen hard and starts moving sideways
- –You want long setups with a clear failure level
- –You can wait for a closed bar and a confirmed zone
- –You plan to adjust the filters for your symbol and timeframe
- –You need sell signals or frequent entries
- –You want an arrow that has been proven in testing
- –The zone already shows a Failed Zone Mark
- –The breakout bar is very large compared with the box
Starting settings to try
Start with the defaults and check whether zones appear on your chart at all. If you see few zones or no arrows on M15, try changing one input at a time:
- Set RequirePriorDownMove to false.
- Or lower BreakoutVolumeMult to 1.1.
- Or set MinAbsorbBars to 1.
These values have not been tested by the Lab. Compare each one with the default on the same chart before you trust the extra signals. Avoid loosening everything at once, or the boxes stop meaning absorption.
Pairing idea
The Accumulation Zone Finder tells you where buyers may be stepping in, but not where the move might stall. Key Level Map can show the scored resistance zones above a breakout, so you can judge the room in step 4 of the decision rule. This is an idea to try. The Lab has not tested the pair.