Walk-forward analysis
Also called WFA, WFO, walk-forward optimisation, walk-forward testing, walk-forward test, rolling out-of-sample test
Walk-forward analysis tests a trading strategy by tuning its settings on one stretch of past data, then trading those settings on the next stretch it has never seen, and repeating this step by step through history.
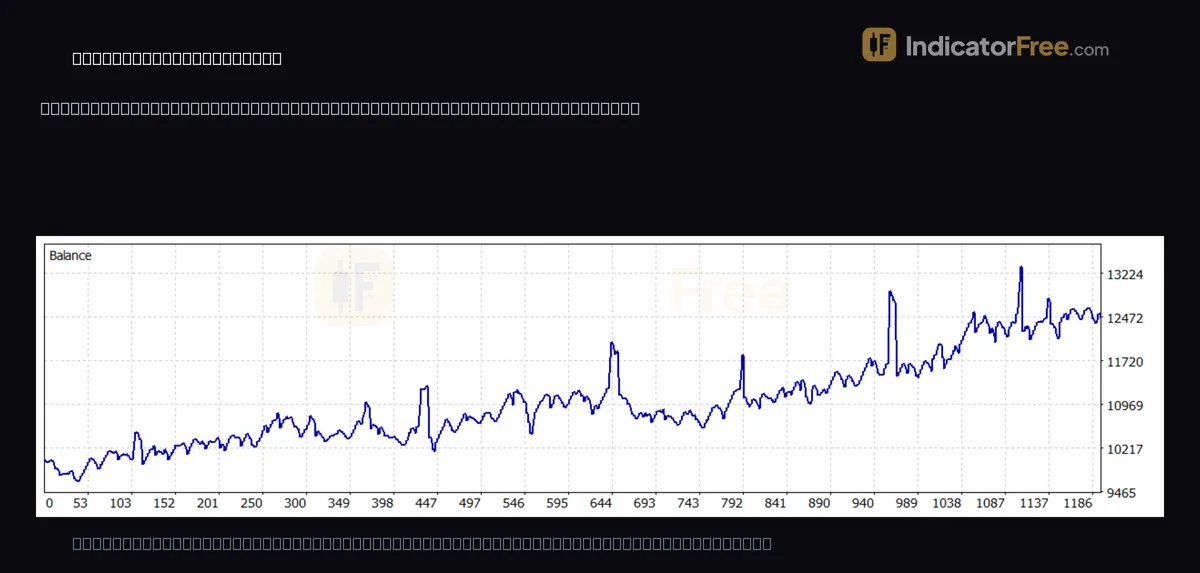
A backtest can look good only because its settings were tuned to that exact stretch of history. Walk-forward analysis shows how much of the result survives on data the tuning never touched, which is closer to what your account will meet.
Why one continuous backtest cannot answer the same question
Most guides call this trap overfitting (curve fitting): settings that match the noise in past prices instead of a repeatable edge. An overfitted strategy looks strong on the data it was tuned on and weakens on anything new.
The backtest report at the top of this page is a past example, not a prediction. It covers XAUUSD on the 15-minute chart from 2026.03.24 to 2026.09.24: 836 trades, profit factor 1.11, maximum equity drawdown 6.11%.
A profit factor of 1.11 means $1.11 of gross profit for each $1.00 of gross loss. That is a thin margin: a small drop on unseen data would take it below 1.00, which is a losing strategy.
A single report cannot tell you whether that 1.11 is a real edge or a fit to those exact six months. Splitting the period into tune-and-test windows can.
What walk-forward analysis does to a backtest
Tuning a strategy's settings until past results look best is called optimisation. The data used for tuning is the in-sample period. The data kept hidden from the tuning is the out-of-sample period.
A walk-forward run chains several of these pairs. You optimise on one window, lock the settings, and trade the next window untouched. Then you slide both windows forward and repeat.
Only the out-of-sample pieces count. Joined end to end, they form a track record in which every trade used settings chosen before that trade happened.
The diagram below shows four runs over 18 months, each with six months of tuning followed by three months of unseen trading.
A worked walk-forward test you can redo by hand
The figures in this section are an illustrative example. You have 18 months of price history for an Expert Advisor. You tune on six months, test on the next three, and step forward three months each time.
Number of runs: (18 − 6) ÷ 3 = 4. The four test windows cover 4 × 3 = 12 months.
The tuned windows averaged $1,200 profit each over six months. The four unseen windows returned +$300, +$150, −$90 and +$240.
The last line is walk-forward efficiency: the share of tuned performance that survived on unseen data. Here the strategy kept a quarter of it.
That changes how you trade it. If you plan your risk and expectations around $200 a month, you are relying on a number that needed hindsight. The $50 figure is the one to plan with, and one of the four windows lost money.
A rule you can copy: write down a pass mark before you run the test, and set it by what the strategy has to survive, not by a round number. The out-of-sample profit must stay positive after spread, commission and swap, with room to spare, and the drawdown inside the unseen windows must be one you could sit through live. In this example the bar is 0.50, set in advance so the unseen profit has room to absorb costs. The result of 0.25 fails, so the strategy does not go live on those rules.
An efficiency near 100%, or above it, is not a reason to celebrate. Unseen data rarely matches the tuned result, so it usually points to too few trades per window or a lucky stretch. Check the trade count before you believe it.
Between a clear pass and a clear fail is a grey zone. Do not go live at full size there. Add more walk-forward windows, or trade the rules on demo or at minimum size, and decide again once the new results are in.
Where you set the windows in a strategy tester
You set a walk-forward test through the date range and optimisation options of your platform's strategy tester. Many testers include a forward option that holds back the final part of the range and reports it separately.
That gives you one split, not a rolling series. For the rolling version:
- Set the date range to the first tuning window and optimise.
- Note the chosen settings and the in-sample profit.
- Change the dates to the next window, switch optimisation off, and run those settings once.
- Record the out-of-sample profit, then move both windows forward.
A common misread: the optimiser's results table is ranked by in-sample performance. The top row is the best fit to the past, not the walk-forward result.
Checks before you trust a walk-forward result
- Count trades per test window. A window with a handful of trades proves nothing. Lengthen the window until each one holds a meaningful sample.
- Fix the window lengths first. If you keep changing them until the test passes, you have optimised the walk-forward itself.
- Watch the settings between runs. If the best value jumps from one extreme to the other each run, the strategy is fitting noise.
- Read each window, not only the total. One large window can hide several losing ones.
- Include spread, commission and swap. Costs hit thin edges hardest.
- Match your live routine to the test. If you tested three-month windows, re-tune every three months, with the same tuning target.
FAQ
Should I use a rolling or an anchored walk-forward?
Rolling drops the oldest data each step, so the settings follow recent conditions. Anchored keeps the start date fixed and lets the tuning window grow, which gives steadier settings that adapt more slowly. Use rolling if you think the market's behaviour shifts over time, anchored if your strategy trades rarely and needs every trade it can get.
Can I walk-forward test a manual strategy?
Yes. Write your rules using only an older part of the chart. Then step through later bars one at a time without looking ahead, and log every trade the rules give. Revise the rules only between blocks, never during one.
What should I do if a strategy fails the walk-forward test?
Do not re-tune until it passes. Reduce the number of adjustable settings, or accept that the rules do not hold up and move on. A failed test that saves you from a live loss has done its job.