









Monte Carlo test
Also called Monte Carlo simulation, Monte Carlo analysis, MC test, Trade shuffle test, Monte Carlo drawdown test
A Monte Carlo test reruns the trades from a backtest hundreds or thousands of times in random order or random combinations. It shows the range of drawdowns and results the same strategy could have produced by chance.
Your backtest shows one path out of the many that the same trades could have taken. The drawdown on that single path is rarely the deepest one you should plan for, so a lot size chosen from it can be too large.
What a Monte Carlo test does to your trade list
A backtest gives you a list of trade results in the order they happened. The order is partly luck. Five losers spread across a month hurt far less than the same five losers back to back.
A Monte Carlo test takes that list, mixes it at random, and rebuilds the equity curve. It repeats this many times and records the maximum drawdown (the largest fall from a peak in your balance before a new high) and longest losing streak of every run. You get a spread of outcomes in place of one number.
The chart below shows three of those runs built from the same trades, in an illustrative 100-trade example.
How the result changes your lot size: a worked example
The figures in this section are an illustrative example. You have a $10,000 account and a backtest of 100 trades at a fixed 0.10 lots: 50 winners of $250 and 50 losers of $125.
- Winners: 50 × $250 = $12,500
- Losers: 50 × $125 = $6,250
- Net profit: $12,500 − $6,250 = $6,250
In the backtest the largest peak-to-trough fall was $500, which here was four losers in a row. You then reshuffle the trades 1,000 times. Half of the runs had a drawdown of $750 or less. 95% of the runs had $1,250 or less, so 1 run in 20 was deeper than that.
Say you will not accept losing more than 10% of the account.
The backtest's $500 sits well inside that limit. The 95th percentile does not.
The decision rule: if the 95th percentile drawdown is above your limit, multiply your lot size by limit ÷ 95th percentile drawdown.
At 0.08 lots each loser costs $100 and the 95th percentile drawdown becomes $1,250 × 0.80 = $1,000, which is exactly your limit. Sizing to the 95th percentile still leaves a 1-in-20 chance of hitting your limit. If that is too much risk, use a smaller limit in step 1, and keep in mind that clustered losses (see the checks below) can make real trading worse than the test.
If you trade a prop-firm account and the firm's maximum loss is smaller than your own limit, use the firm's number as the limit in step 1. The shuffle tests total drawdown, not a daily loss limit, because it ignores which day trades fall on.
Which drawdown to shuffle: balance or equity
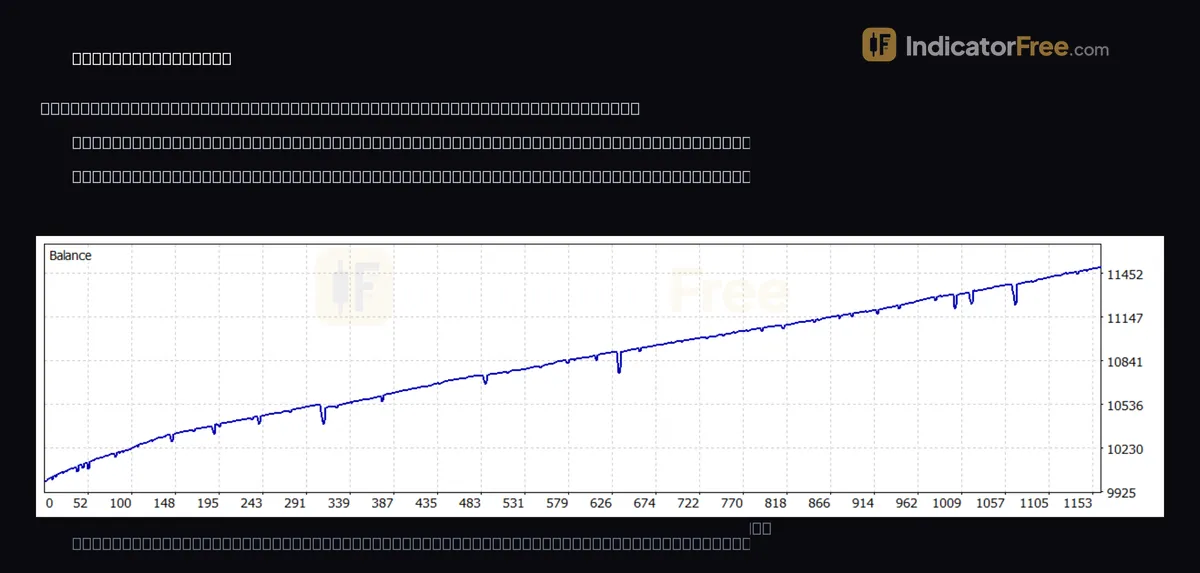
The backtest at the top of this page is a past example, not a prediction. It is an EA on XAUUSD on the 15-minute chart from 24 March 2026 to 24 September 2026, with 579 trades, a profit factor of 2.07, a maximum balance drawdown of 147.39 (1.35%) and a maximum equity drawdown of 645.19 (5.67%). A shuffle of closed trades rebuilds the balance curve, so the drawdown it tests is the balance drawdown, 1.35% here. The 5.67% equity drawdown also includes losses on trades that were still open, and the shuffle cannot reorder those. Once the shuffle has shown how deep the 1.35% can get, plan against whichever is larger: that figure or the 5.67%.
Where you run it and which settings to choose
Some backtesting programs include a Monte Carlo report; if yours does not, run the shuffle yourself in a spreadsheet or a short script:
- Export the trade list with net profit per trade.
- Put the results in a random order.
- Rebuild the running balance and record the largest peak-to-trough fall.
- Repeat, for example 1,000 times, then sort the drawdowns and read the value 95% of runs stay under.
You normally set three things: the number of runs, the confidence level you read (for example the 95th percentile), and the method.
| Method | What changes | What it tells you |
|---|---|---|
| Reshuffle | Order only; every trade used once | Range of drawdowns and losing streaks |
| Resample | Trades drawn at random, repeats allowed | Range of final profit as well as drawdown |
| Skip trades | A random share of trades removed | Whether the result leans on a few big winners |
With a fixed lot size, a pure reshuffle always ends on the same profit. If your report shows different final balances, it is resampling or skipping trades.
Checks before you trust a Monte Carlo result
- Use net results. Each trade must include spread, commission and swap, or every run is too optimistic.
- Count the trades. A list of a few dozen trades only reshuffles the same handful of losers. With a short list, treat the 95th percentile as a minimum, not an estimate, and keep size small until you have more trades. A list like the 579 trades above gives the test far more to work with.
- Compare losing streaks. Shuffling assumes trades do not depend on each other. If the backtest's longest losing streak is longer than the streak in about 95% of the shuffles, your losses probably cluster and the real drawdown can be worse than the test shows.
- Read the 95th percentile, not the median. The median is the outcome you beat only half the time.
- Do not treat the worst run as a ceiling. More runs will find a deeper one.
- Test clean trades. If the settings were tuned to fit the past, the test only reshuffles tuned trades. Run it on results from a period you did not use to pick the settings (out-of-sample data).
FAQ
What does a Monte Carlo permutation test check in trading?
It is a different test from the trade shuffle above: it shuffles the price data, not your trades. It asks whether the edge is real or luck. The test scrambles the market's price changes many times, runs the strategy on each scrambled version, and counts how often those results match or beat the real one. If scrambled data often does as well, the strategy has probably fitted noise.
Can I run a Monte Carlo test on a stock strategy?
Yes. The test only needs a list of trade results, so it works for stocks, forex, gold or indices. If you hold several stocks at once, they tend to fall together, so shuffle daily or weekly results rather than single trades.
How many runs should I set?
Run the test twice with the same settings. If the 95th percentile drawdown moves noticeably between the two, raise the number of runs until it holds steady.