









Out-of-sample test
Also called OOS test, Out-of-sample testing, OOS, Holdout test, Out-of-sample backtest
An out-of-sample test runs a trading strategy on price history that was not used to build or optimise it. It shows whether the rules still hold up on data they have never seen, before real money is at risk.
Any strategy can be made to look good on the data it was tuned on. The out-of-sample result is the first number the tuning could not flatter, so it is the one to size your risk from.
What an out-of-sample test checks that a normal backtest cannot
When you adjust settings until a backtest looks good, you are fitting the rules to one stretch of history. The data you tune on is called in-sample data. The data you keep hidden is out-of-sample data.
Overfitting means the settings describe the random noise of the past instead of a repeatable pattern. An overfitted strategy looks excellent in-sample and falls apart on fresh prices. The out-of-sample test is how you catch that before your account does.
Splitting your history into in-sample and out-of-sample
Most of the history is for tuning and the last slice is held back; the example below uses three years and one year. The order of the steps matters more than the exact ratio:
- Pick a stretch of history with good-quality price data (your tester's history quality figure should be at or near 100%, as in the report at the top of this page) and realistic spread and commission settings.
- Set a split date and do not look at anything after it.
- Build and optimise only on the earlier part.
- Freeze the settings.
- Run the later part once and record the result. Some strategy testers offer a forward period option that reports the last part of the range separately; it does the same job, as long as you do not pick settings by looking at the forward results.
If you change a setting and rerun, that data has become in-sample; you need new unseen data.
The drawing below shows the split. The equity curve climbs steadily where the settings were tuned, then turns flatter and choppier once it crosses into unseen data.
Worked example: how much of the edge survives
The figures here are an illustrative example. You optimise on three years and hold back a fourth.
In-sample, the strategy makes $6,000 in winning trades and loses $4,000 in losing trades. Out-of-sample, it makes $2,600 and loses $2,000.
The two periods differ in length, so compare a ratio, not total profit. Profit factor is gross profit divided by gross loss, and 1.00 means break-even. So the edge is the part above 1.00, and that is what you compare.
The strategy kept 60% of its edge. Say your pass mark, written down before the run, was half. This one passes, but you now plan around 1.30, not 1.50. If you had sized your trades for the in-sample figure, every losing streak would hit harder than you budgeted for.
Reading the out-of-sample result
| Out-of-sample result | What it usually means | What to do |
|---|---|---|
| Close to in-sample | The rules captured something that lasted past the tuning period | Move to a demo account or very small size |
| Weaker but still profitable | Normal; part of the in-sample result was noise | Trade it small; expect live results at or below this figure |
| Flat or losing | The settings were fitted to the past | Drop or rethink the idea; do not re-tune on the same data |
| Better than in-sample | Often luck or a kind market phase | If the out-of-sample trade count is clearly fewer than the third your split predicts, treat the result as luck; do not raise size |
How to tell if a backtest report is in-sample
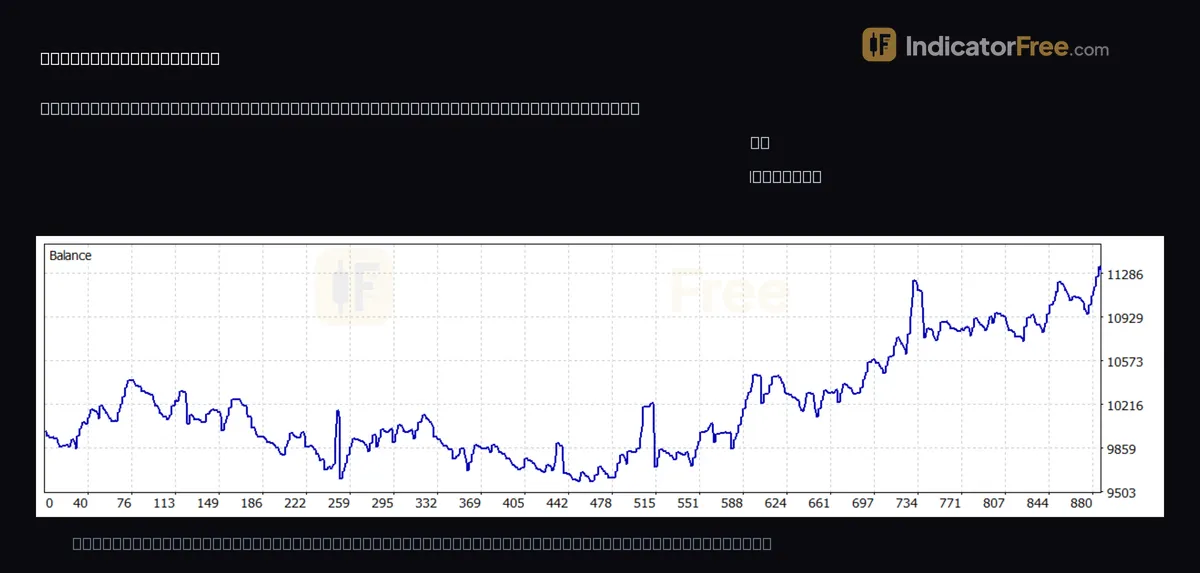
A common misread is treating any backtest report as proof. The report at the top of this page covers XAUUSD on the 15-minute chart from 2026.03.24 to 2026.07.24. It is a past example, not a prediction.
Its numbers alone cannot tell you which kind of test it was. Ask one question of any report: were the settings chosen using this same period? If yes, it is in-sample, however clean it looks.
If it is the held-back run, apply the edge-retained method. As an illustration, suppose these settings had scored a profit factor of 1.50 in-sample. That 1.50 is assumed; it is not in the report. The report's 1.15 would then keep only (1.15 − 1) ÷ (1.50 − 1) = 30% of the edge, below a 50% pass mark. On that assumption the settings fail, even though the report shows a profit over 610 trades.
Checks before you trust an out-of-sample result
- Count the trades. Check the out-of-sample trade count against what the split predicts. With the example's three-years-to-one split, a strategy trading at a steady pace should place about a third as many trades out-of-sample as in-sample. If it has clearly fewer than a third, extend the held-back period before judging the result.
- Same costs in both periods. Use the same spread, commission and slippage assumptions, or the comparison is meaningless.
- Compare drawdown too. Plan your risk around the larger of the two drawdowns. As an illustrative example, if in-sample drawdown was 6% and out-of-sample was 9%, size for 9%.
- Check the market type. If the held-back period was one long trend, a trend strategy passing tells you less than it seems.
FAQ
How much history should I hold back for the out-of-sample test?
In the example above the held-back year is a quarter of the history. Take that slice from the most recent prices, because they are closest to the market you will trade live, and use the trade-count check above to confirm it is long enough. A strategy that trades a few times a month needs a much longer held-back period than one that trades many times a day.
What is the difference between an out-of-sample test and a walk-forward test?
An out-of-sample test is one split: tune on the first part, test on the second. A walk-forward test repeats that split many times, rolling the window forward, so you get several out-of-sample results instead of one.
Does passing an out-of-sample test mean the strategy will work live?
No. It is still a simulation on past prices. Live trading adds real fills, changing spreads and market conditions that neither period contained.